


Deeply rooted in China’s food culture and history, salt plays an essential role in Chinese people’s food preparation and preservation. Globally, China is among the nations with the highest salt intake level(1). According to the Chinese national total diet survey in 2000, the average daily salt intake was 12 g/person(Reference Zhai and Yang2). The most recent national survey was carried out between 2009 and 2012. The data showed a decrease in mean daily salt intake down to 9·1 g/person, mainly due to changing dietary trends and replacement of salt with refrigeration for food preservation(Reference Hipgrave, Chang and Li3). However, the level is still much higher than the WHO’s recommended maximum daily salt intake level (5 g/d) and the 6 g/d target that many countries (including China) have set for their populations(1,Reference Shao, Hua and Yang4) . In China, almost all provinces exceed this target(Reference Hipgrave, Chang and Li3). An evaluation of the diet and public health impact across 195 countries indicates that, after age standardisation, China has the highest rates of diet-related CVD deaths and high intake of Na was the leading dietary risk for these deaths(Reference Afshin, Sur and Fay5).
Dietary salt intake is derived from different sources, with significant variations between countries. In most Western countries, the majority of salt intake comes from commercially manufactured foods or processed foods (e.g. breads, processed meat, sandwiches, soups, ready meals and takeaways)(Reference Zandstra, Lion and Newson6). In contrast, in China, salt intake is mainly from salt or soya sauce added in home cooking (about 80 %)(Reference Xi, Hao and Liu7,Reference Xu, Wang and Chen8) . However, it should be noted that, in recent years, the online catering sector has been undergoing an explosive growth in China(Reference Zhang, Wang, Wang and Ho9). Some population cohorts, especially younger generations of consumers from single-person households, increasingly use food delivery apps accessed through smartphones to deliver their daily meals(Reference Cho, Bonn and Li10). It is possible that this trend has altered the salt intake pattern of this particular demographic, although the actual impact is still unknown.
Following worldwide salt reduction initiatives, China has taken actions to reduce the population’s salt intake, with a primary focus on reducing salt/sodium added during cooking at home. At the national level, government-led initiatives such as the China Healthy Life for All campaign and National Nutrition Week have included salt reduction as an important message, highlighting the recommended daily maximum intake of salt and promoting salt reduction tools(Reference Shao, Hua and Yang4,11) . More specific to salt, the China Salt Reduction Initiative (2010–2020) and Action on Salt China (2017–2021, in collaboration with the UK) are employing a multisector approach to tackle the challenge of salt reduction(Reference He, Zhang and Li12). In 2017, the State Council set a goal of a 20 % reduction in citizens’ salt intake by 2030. In response to this ambition, in April 2018, the Chinese Center for Disease Control and Prevention along with the Chinese Nutrition Society officially launched salt reduction guidelines for the food industry, providing technical suggestions on product reformulations and stage targets for different food categories(13). In addition to national initiatives, Beijing and Shanghai municipal governments and Shandong provincial government have organised regional interventions(Reference Shao, Hua and Yang4). These regional interventions involve a wide range of measures, mainly including distribution of salt-restriction spoons (i.e. spoons with a volume to hold 2 g salt), promotion of low-sodium salt and low-salt foods to consumers and food catering services, and public awareness campaigns. During the intervention, the efforts had resulted in positive influence on the intervention groups’ salt reduction awareness, adoption of tools and actual salt intake levels(Reference Shao, Hua and Yang4,Reference Chen, Tian and Liao14,Reference You, Zhang and Wang15) . However, consumer surveys showed a decrease in impact after the intervention and common barriers that have stopped certain people to update salt restriction tools, for instance lack of education on correct use of the tools, inconvenience, difficulty of purchase and lack of perceived health benefits(Reference Shao, Hua and Yang4,Reference You, Zhang and Wang15–Reference Cai and Chen17) .
To achieve effective and sustained behavioural change, salt reduction programmes should be based on a solid understanding of consumer perceptions and behaviours(Reference Zandstra, Lion and Newson6,Reference Newson, Elmadfa and Biro18,Reference Regan, Potvin Kent and Raats19) . While lessons can be learned from successful salt reduction campaigns from other countries, Chinese public health practitioners should also fully consider the perceptions and behaviours of Chinese consumers specifically(Reference Liu, Li and Hong20). In China, the understanding of consumer issues around salt and salt reduction is still limited. For instance, the evaluation survey of the China Healthy Lifestyles for All initiative included only three simple questions regarding salt; and regional post-intervention surveys were restricted to specific villages or cities(Reference Shao, Hua and Yang4,Reference Chen, Tian and Liao14,Reference Zhang, Astell-Burt and Seo21,Reference Wang, Li and Ding22) . Using an online panel, Newson et al. (Reference Newson, Elmadfa and Biro18) conducted a standard seven-country survey and found that only 34 % of Chinese consumers know the recommended maximum salt intake; and while 83 % were interested in salt reduction, only 30 % had maintained salt reduction efforts. Using an across-country sample, the current study aimed to provide comprehensive and up-to-date insights about Chinese consumers’ knowledge, interest and behaviour in relation to salt and salt reduction that can be used to support current nationwide salt reduction initiatives.
Methods
Sampling
To obtain a representative sample of the Chinese population, a multistage hierarchical sampling method was employed. Geographically, China consists of seven large areas: North, Northeast, East, Central, South, Southwest and Northwest. Due to budget limit, six out of seven geographical areas were selected for sampling. The Northwest area was not included because it is the least populated area, accounting for only 7·25 % of China’s total population(23). We believe that the exclusion of this area (rather than any other area) should result in the least compromise on the representativeness of the sample. The decision was made to recruit approximately 380 participants from each area, because a power calculation suggested that to estimate the proportion of the population that possesses a particular property, a minimum sample size of 383 was required to achieve 95 % power with a significant level (α) of 0·05(24). For each of those six geographical areas, we randomly selected a provincial-level administrative division (i.e. the highest level of China’s administrative structure), which is either a province or a municipality (Table 1). At the second stage, probability-proportional-to-size sampling was employed to choose one city district and one town from each municipality/province, ending with twelve (i.e. 6 × 2) districts and towns. At the third stage, again using probability-proportional-to-size sampling, four villages/streets were selected from each district/town and four communities were selected from each village/street. This ends with 192 sampling points (i.e. 12 × 4 × 4). At the last stage, at each sampling point, twelve households were randomly selected for the interview. Professional fieldworkers based in the local Center for Disease Control and Prevention visited the households and administrated the survey face-to-face. The fieldworkers were also provided with an age quota, which was based on the 2011 census(23), in order to cover all age groups. The questions were displayed on a tablet computer; the fieldworker read out the question to the respondent and entered the respondent’s answers. In total 2444 participants took part in the survey. The data were collected between September and November 2017. Informed written consent was obtained from each participant on site, prior to the survey.
Table 1 Characteristics of the Chinese consumers (n 2430) from six of seven major geographical regions in mainland China who participated in the survey, September–November 2017

Research instrument
The survey included twenty-nine questions exploring knowledge on salt and salt reduction, consumer beliefs and behavioural intentions related to salt reduction, and consumer perspectives on strategies to reduce the population’s salt intake. Survey design was informed by previous literature(Reference Sarmugam and Worsley25,Reference Regan, Shan and Wall26) , pilot studies, and consultations with public health practitioners and experts. Declarative salt knowledge – factual knowledge regarding intake of salt in the diet – was assessed using questions from previous literature, adapted to be culturally suitable(Reference Sarmugam and Worsley25,Reference Regan, Shan and Wall26) . Six questions assessed participants’ understanding of dietary sources of salt intake, the maximum recommended daily salt intake (entered in grams per day or ‘don’t know’) and the relationship between salt and health (see Table 2 for full wording of the questions). Examples of food and flavouring products were selected based on commonly consumed products in China.
Table 2 Salt beliefs and knowledge of Chinese consumers (n 2430) from six of seven major geographical regions in mainland China, September–November 2017
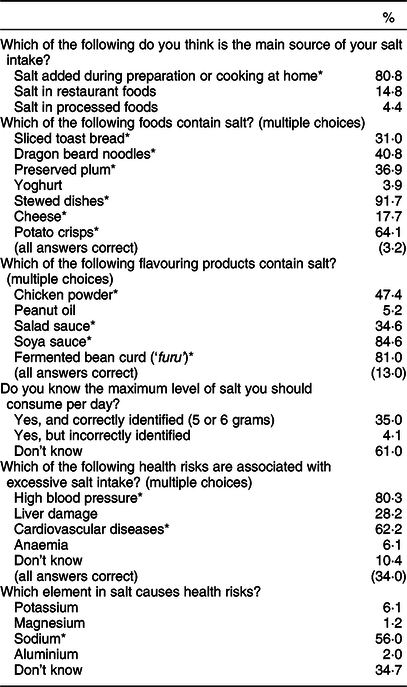
* Denotes the correct answer(s) for each question.
Participants’ beliefs and behaviours related to salt intake and salt reduction were also assessed with culturally adapted questions from previous literature(Reference Sarmugam and Worsley25,Reference Regan, Shan and Wall26) . Participants were asked about their salt intake behaviours and their interest in and motivations for reducing salt intake (see Tables 3 and 4 for full wording). The multiple-choice options included in the survey for the motivations and barriers for taking salt reduction action were developed based on a qualitative pilot exercise undertaken with non-academic staff at the first author’s affiliation, such as administrators, cleaners and security guards.
Table 3 Salt reduction intention and behaviour of Chinese consumers (n 2430) from six of seven major geographical regions in mainland China, September–November 2017
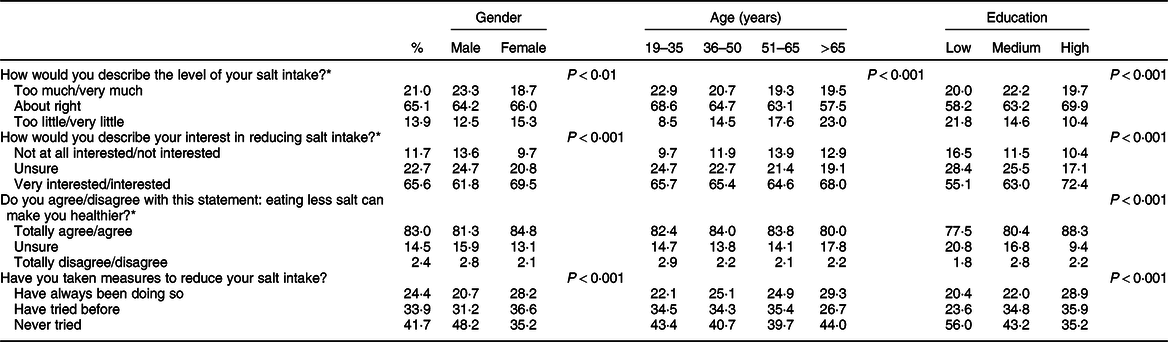
* For these questions, to reduce the complexity of result interpretation, five answering options were merged into three categories.
Table 4 Reasons behind salt reduction behaviour stated by Chinese consumers (n 2430) from six of seven major geographical regions in mainland China, September–November 2017
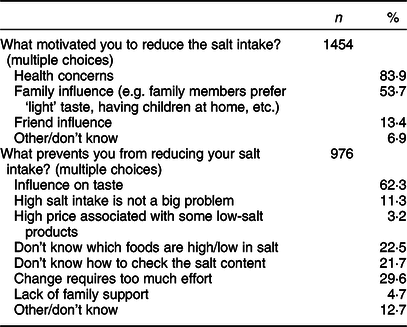
Note: participants were divided based on their answers to the previous question, ‘Have you taken measures to reduce your salt intake?’ (see Table 3). Those who answered ‘have always been doing so’ or ‘have tried before’ were presented with a follow-up question, ‘What motivated you to reduce the salt intake?’; those who answered ‘never tried’ were presented the question, ‘What prevents you from reducing your salt intake?’
To measure consumer awareness and adoption of salt reduction strategies, three questions (Table 5) were included. Salt-restriction spoons and low-sodium salt have been strongly promoted in previous Chinese national or regional salt reduction initiatives; thus, questions asked about both the awareness and the actual adoption of these strategies. The third question asked about salt-reduction cooking skills and was designed in consultation with internal nutrition experts at the first author’s affiliation. Multiple-choice options for this question included correct practices, as well as improper practices that commonly occur in Chinese families.
Table 5 Awareness of and adoption of salt reduction tools by Chinese consumers (n 2430) from six of seven major geographical regions in mainland China, September–November 2017
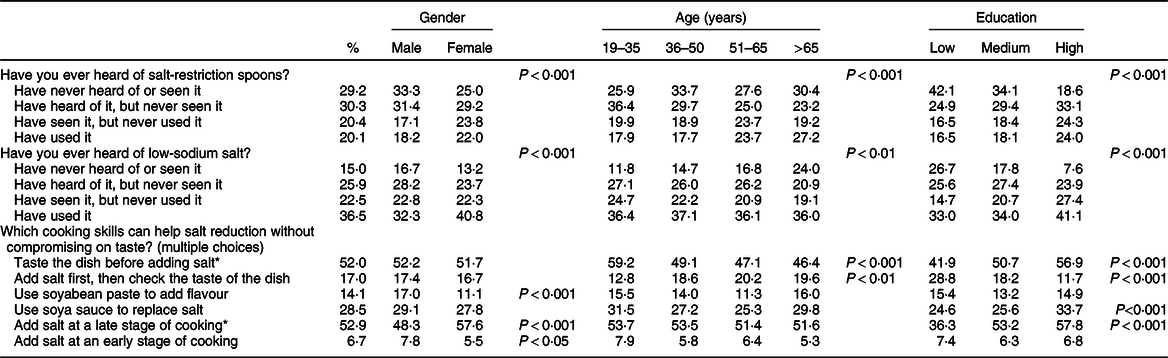
* Denotes the correct answers.
The last section in the survey related to perceptions of salt reduction responsibility and effectiveness of different national salt reduction strategies. Participants were asked to rate how responsible they thought different parties (themselves, food producers, restaurants/caterers, governments, family and friends) were for salt reduction, using a five-option scale (total responsibility, a lot of responsibility, unsure, a little responsibility, no responsibility). They were also asked about perceived effectiveness of different salt reduction strategies as listed in Table 6. Among these strategies, four strategies have already been implemented in China or some regions in China (i.e. salt-restriction spoons, low-sodium salt, indication of salt content and public education)(Reference Shao, Hua and Yang4,Reference Liu, Li and Hong20) . The rest were inspired by salt reduction initiatives undertaken in other countries. The questionnaire ended with standard demographic questions.
Table 6 Beliefs about responsibilities and strategies for reducing the population’s salt intake of Chinese consumers (n 2430) from six of seven major geographical regions in mainland China, September–November 2017
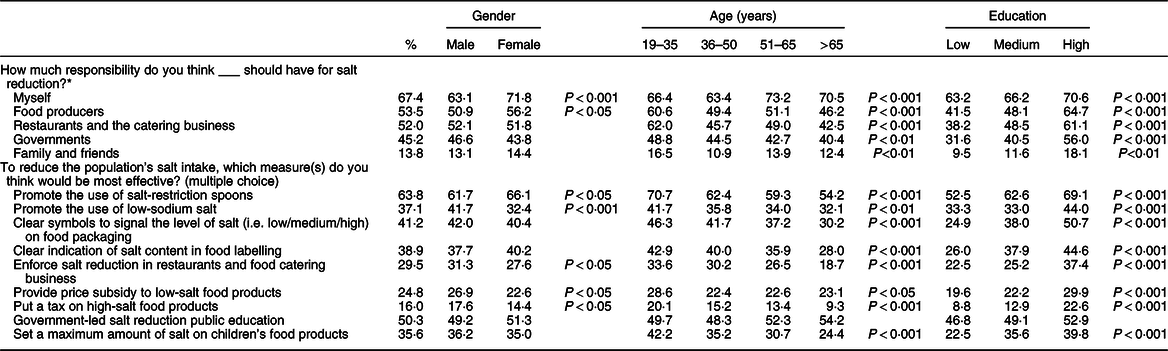
* For this question, the five answering options were ‘total responsibility’, ‘some responsibility’, ‘unsure’, ‘little responsibility’ and ‘no responsibility’. The percentages indicate the proportion of those who selected ‘total responsibility’ or ‘some responsibility’.
Statistical analysis
Prior to data analysis, data cleaning was carried out. Fourteen respondents did not answer at least two key questions and were excluded, resulting in a sample of 2430 participants. The data analyst found an error in the survey’s logic path. Participants who answered ‘never’ to the question, ‘Q13. Have you taken any measures to reduce your salt intake?’, were supposed to skip the next question, ‘Q14. What motivated you to reduce the salt intake?’ The data showed that three participants answered ‘never’ to Q13, but also left answers on Q14. This indicated the ‘skip’ function did not work properly for these three participants. The data analyst thus manually removed their answers to Q14. This procedure did not lead to deletion of any participants. Data analyses were conducted using the statistical software package IBM SPSS Statistics version 24. To minimise the bias caused by multistage hierarchical sampling, we applied post-stratification weights by age, gender and geographical area, based on statistics from the most recent national census data(Reference Regan, Potvin Kent and Raats19). We performed this procedure using SPSS Complex Sample module, which helps make more statistically valid inferences by incorporating the sample design into survey analysis. To enable cross-group comparison, age was recoded into four categories; and education status was merged into three categories: low (no education, primary school education); medium (junior or senior high school education, technical secondary school education); and high (college education, university degrees). A series of χ 2 tests was carried out to compare population groups across knowledge, beliefs and behavioural intentions regarding salt intake and salt reduction.
Results
Salt beliefs and knowledge
A majority of Chinese consumers (80·8 %) believed that the main source of their salt intake was from foods prepared at home (Table 2). Interestingly, 22·2 % of young consumers (aged 19–35 years) and 22·8 % well-educated consumers selected ‘restaurant foods’ as their main source of salt intake, which is significantly higher than the average percentage (14·8 %).
Knowledge gaps exist in the awareness of high/medium salt hidden in certain food items and flavouring products. For instance, over half of Chinese consumers were not aware of salt in dragon beard noodles, preserved plum and certain Western foods that have been introduced to China (i.e. toast bread and cheese). A large proportion of consumers did not know chicken powder (52·6 %) and salad sauce (65·4 %) contain salt. Consumers with higher education and younger age profiles were relatively more knowledgeable on ‘invisible’ salt in foods and flavourings.
Slightly over one-third of Chinese consumers correctly identified the recommended maximum salt intake level (Table 2). In relation to health risks associated with salt intake, consumers had high awareness of hypertension and moderate awareness of CVD. Of participants, 56·0 % were aware that ‘sodium’ was the element in salt which caused health risks. Better-educated participants demonstrated a much higher knowledge level on these questions.
Salt reduction beliefs and behaviour
A majority of Chinese consumers did not perceive they were consuming excessive salt (Table 3). Despite this, 65·6 % of consumers expressed interest in lowering their salt intake and 83·0 % believed that eating less salt would benefit their health. At the behavioural level, only a quarter of consumers claimed that they made an ongoing effort to reduce salt and 33·9 % indicated that they had tried in the past to reduce salt intake. Females and better-educated people were more interested in and more active on salt reduction.
For those who had been making/ever made salt reduction efforts, they were mainly triggered by health concerns and family influence (Table 4). For those who had not tried salt reduction, taste concern was the major barrier. A perception that change would require too much effort, and a lack of knowledge on which foods contain high salt and how to check salt content, also explained some participants’ lack of motivation on salt reduction. The answering patterns were similar across different sociodemographic groups.
Awareness and adoption of salt reduction tools
The results showed a general pattern of high awareness but low adoption of salt-restriction spoons and low-sodium salt (Table 5). Between these two tools, low-sodium salt was relatively more popular, with 85·0 % of consumers at least having heard of it and 36·5 % of consumers having (ever) used it. In comparison, 70·8 % of consumers had heard of salt-restriction spoons and only 20·1 % had (ever) adopted them. People with third-level education had a higher awareness and usage of these tools. Middle-aged and elderly people were more likely to have used salt-restriction spoons than other age groups, while females used low-sodium salt more than males. Availability of these tools in the market seems to be an issue: correspondingly 30·3 and 25·9 % of consumers had heard of salt-restriction spoons and low-sodium salt, but never saw them.
In relation to cooking skills that can help salt reduction, 52·0 and 52·9 % of consumers were aware of the correct practices (taste the dish before adding salt and add salt at a late stage of cooking, respectively). Better-educated people, females and young people were more knowledgeable about these salt reduction tips. It should be noted that 28·5 % of consumers incorrectly believed that replacement of salt with soya sauce can help salt reduction.
Consumer beliefs about national salt reduction strategies
In relation to salt reduction, Chinese consumers believed that they themselves should take the most responsibility (67·4 %), with stakeholders such as food producers (53·5 %), restaurants and caterers (52·0 %) and governments (45·2 %) also viewed as having an important role (Table 6). Young consumers (aged 19–35 years) and consumers with high education expressed more emphasis on other stakeholders’ responsibilities in salt reduction.
Among a list of measures that can be taken to help to reduce the population’s salt intake, Chinese consumers expressed strong beliefs in the effectiveness of salt-restriction spoons and public education. About 40 % of consumers also expressed confidence in strategies related to food labelling, such as clear symbols to signal the level of salt and clear indication of salt content. Salt tax was considered as least effective. Well-educated consumers and young people, in comparison to their counterparts, were more confident in the effectiveness of the strategies listed.
Discussion
The present study mapped Chinese consumers’ knowledge on salt intake and salt reduction, their beliefs and behaviour, and their support for different salt reduction strategies. Using a large sample of participants recruited across China, the study provided a comprehensive picture to inform this country’s ongoing nationwide salt reduction initiatives. According to our results, in general, participants’ belief about their main source of salt intake was in line with the estimation from published dietary studies(Reference Xi, Hao and Liu7,Reference Xu, Wang and Chen8) . The finding that young consumers and well-educated people were relatively more likely to consider restaurant foods as their main source of salt may reflect a social phenomenon: in China, young unmarried white-collar workers increasingly rely on restaurant foods and online delivery of their meals(Reference Cho, Bonn and Li10,27,28) . Regarding food items, Chinese consumers were well aware of salt in traditional salty foods, but less aware of salt in certain staple foods, snacks and flavourings that do not carry a typical ‘salty’ taste. Public health education should improve consumers’ knowledge on ‘hidden’ salt content in commonly consumed food products. Our findings also showed large room to improve consumers’ knowledge on the salt intake threshold and the relationship between sodium and salt. This is particularly pertinent given the emphasis placed on low-sodium salt as a strategy in current salt reduction campaigns in China.
Despite excessive salt intake as a common problem in China(Reference Hipgrave, Chang and Li3), our data showed that almost 80 % Chinese consumers perceived their salt intake was about right or too little. This resonates with an international study showing that consumers largely underestimate their salt intake across countries(Reference Newson, Elmadfa and Biro18). One explanation is many Chinese consumers may not be aware of the severity and prevalence of the salt intake problem in this country. Another possible explanation is the ‘optimism bias’ or ‘it won’t be me’ effect. Optimism bias is a cognitive bias that causes a person to believe him/herself is less likely to experience a negative event. Such bias has been observed in the public’s health risk perception(Reference Branstorm and Brandberg29). Underneath this phenomenon is a key question: how easy it is for consumers to evaluate their salt intake? Food diary-based salt intake measurement requires significant effort (e.g. inspection of nutrition labels, weighing/recording of all items containing salt), so do urine test-based methods. More practically, consumers can be empowered with digital tools. For instance, there has been an online/mobile phone-based ‘sodium calculator’ assisting consumers to quickly estimate their salt intake level(30,31) . The validity and reliability of this calculator are yet to be confirmed; however, it shows the potential of digital tools in self-evaluation of salt intake.
In relation to salt reduction intentions, according to our study, a majority of Chinese consumers expressed interest in and believed in the health benefits of eating less salt. They were aware of salt reduction tools that had been promoted in national or regional health campaigns. However, over 40 % of consumers had never tried salt reduction, and many consumers had never used salt reduction tools and maintained the efforts. A big challenge in public health intervention is to bridge the gap between motivation and behaviour. The Theory of Planned Behaviour and the Transtheoretical Model and Stages of Change suggest that behaviour change can be complex and is influenced by factors beyond personal interest, such as decisional balance (i.e. relative weighing of the pros and cons of changing), self-efficacy and environmental factors(Reference Ajzen32,Reference Prochaska and Velicer33) . Regarding salt reduction behaviour, as reflected from our data, lack of willingness to compromise on taste is a huge barrier. However, certain salt reduction strategies (e.g. salt substitutes and cooking skills) will not significantly influence the taste and positively phrased messages (e.g. ‘same great taste, less salt and more herbs’) will help to result in equal sensory satisfaction as for the regular product(Reference Zandstra, Lion and Newson6,Reference Willems, van Hout and Zijlstra34,Reference Li, Prescott and Wu35) . Public health initiatives should address this perception that salt reduction will necessarily lead to taste reduction. Apart from this, salt reduction tools should be made widely available to consumers, and market promotional activities can be introduced to gain people’s attention and to increase the accessibility to these tools.
Regarding different strategies for population-level salt reduction, Chinese consumers wished to be empowered to control their own salt intake: they viewed themselves as having the most responsibility and they mostly favoured strategies like salt-restriction spoons and public education. This is possibly because they already knew their major source of salt intake is from their own cooking. There have been explorations of the best educational strategies regarding hypertensive risk and salt intake in China. Evidence shows that interactive education workshops (e.g. using visual tools, cartoons/animations, demonstration of the use of salt spoons, etc.) are more effective than strategies based on lectures or self-reading(Reference Lu, Tang and Lei36); and the inclusion of salt reduction education in children’s curriculum can help to lower their families’ salt intake(Reference He, Wu and Feng37).
About 40 % of consumers expressed strong confidence in labelling strategies such as clear symbols to highlight salt levels on food packaging and clear indication of salt content. In China, under the current rules of food labelling (GB 28050-2011), salt content is indicated by sodium content and its percentage in relation to Nutrient Reference Value. Our study showed 42·5 % of consumers did not associate sodium with salt. Another study suggests that only 20 % of Chinese consumers have a good objective understanding of Nutrient Reference Values(Reference Liu, Hoefkens and Verbeke38). This line of evidence highlights the need for more user-friendly food labelling and effective public education. One possibility is the implementation of front-of-pack labelling, in order to enable quick and easier evaluations of nutrition profiles including salt content. Globally, colour-coded labelling (e.g. the government-endorsed UK traffic light labels), ‘high in…’ warning statements in South America and the Health Star Rating system in Australia and New Zealand are good examples(39). If China decides to implement front-of-pack labels, it should carry out rigorous consumer tests to inform the design and provide technical supports and robust guidance for food companies. Such efforts should be accompanied by public communication to encourage proper use of the labels among consumers.
Furthermore, the Chinese government can engage the food industry to reduce the population’s high salt intake. In April 2018, China, for the first time, officially launched salt reduction guidelines for the food industry(13). This is in line with the global trend of including industry engagement and food product reformulation as a pillar of national salt reduction strategies(Reference Regan, Potvin Kent and Raats19). Such efforts should be carefully balanced with those strategies focusing on consumers’ cooking behaviour, given that for a majority of Chinese consumers, salt from processed and restaurant foods is still a small contributor to their salt intake(Reference Xi, Hao and Liu7,Reference Xu, Wang and Chen8) . In addition, our survey showed relatively less public interest in setting salt limits for children’s foods and restaurant foods. Lastly, fiscal policies (i.e. salt subsidies and tax) were least favoured by Chinese consumers, which is similar to Regan et al.’s(Reference Regan, Shan and Wall26) finding with a Western cohort.
The current study examined individual differences across age, gender and education. Education demonstrated a substantial impact: knowledge regarding salt and salt reduction, salt reduction intention and efforts, and the support on salt reduction strategies strongly decreased along with educational attainment. In addition, older consumers were more interested in and active on salt reduction, but their declarative salt knowledge was lower than younger people’s. Previous research indicates that Chinese women are more likely than men to modify their salt reduction(Reference Zhang, Astell-Burt and Seo21); while from our research, overall, the gender differences were moderate. Due to restriction on survey length, the present study did not explore how other demographic variables (e.g. marital status, presence of children, social economic status, urban/rural divide), lifestyle factors (e.g. the frequencies of eating out/consuming ready-to-eat meals/self-cooking) and psychological factors (e.g. health concerns and beliefs, food choice motivations, attitudes) may have influenced participants’ knowledge, interest and behaviour in relation to salt reduction. Previous studies suggest that the residential place (i.e. urban/rural) is a determinant of the adoption of salt-restriction spoons in Beijing(Reference Chen, Liao and Li40), and individual attitudes and beliefs related to health and salt are strong predictors of support for government-led salt reduction policies(Reference Regan, Potvin Kent and Raats19). Future research can explore variations between individuals in detail, by including more demographic and socio-psychological factors and using more complicated statistical analysis. It will help to design targeted salt reduction initiatives for different subgroups of the Chinese population.
Conclusion
The present study provides an insight into Chinese consumers’ declarative knowledge, beliefs and behaviours in relation to salt intake and salt reduction. In the past number of years, at the national and regional level, China has made efforts to promote healthy eating and lower its population’s salt intake. Our study shows that there is still room for improvement. There are key knowledge gaps to fill, and the adoption levels of salt reduction tools, especially among less educated consumers, is still low. Our study also illustrates consumer confidence in different strategies regarding salt reduction, which can be of value to policy makers and decision makers when developing and implementing public health strategies.
Acknowledgements
Acknowledgements: The authors wish to thank all the participants, as well as the Centre for Support and Training in Analysis and Research (CSTAR) at University College Dublin for its assistance on statistical analysis. Financial support: The study was funded by China National Center for Food Safety Risk Assessment (CFSA). The funder had a role in the design, analysis or writing of this article. Conflict of interest: None. Authorship: S.C., W.T., H.H., L.G. and T.D. designed the study and completed data collection. T.L. cleaned the data. L.C.S., T.L. and S.C. analysed the data. L.C.S., A.R. and S.C. drafted the manuscript. P.W. made intellectual comments and revised the manuscript. All authors reviewed and approved the final manuscript. Ethics of human subject participation: This study was conducted according to the guidelines laid down in the Declaration of Helsinki and all procedures involving human subjects were approved by the Research Ethics Committee at China National Center for Food Safety Risk Assessment. Written informed consent was obtained from all participants.


