


Introduction
Methamphetamine (MA) is a highly addictive stimulant that has rapidly increased in usage among adolescents, emerging as one of the most significant public health concerns worldwide (Johnston et al., Reference Johnston, Miech, O'Malley, Bachman, Schulenberg and Patrick2020; Jones, Olsen, O'Donnell, & Mustaquim, Reference Jones, Olsen, O'Donnell and Mustaquim2020). Although the neurotoxic effects of MA use have been extensively studied in adults through several neuroimaging modalities (Ashok, Mizuno, Volkow, & Howes, Reference Ashok, Mizuno, Volkow and Howes2017; Beard et al., Reference Beard, Schmitz, Soder, Suchting, Yoon, Hasan and Lane2019; London, Kohno, Morales, & Ballard, Reference London, Kohno, Morales and Ballard2016), only a few studies have evaluated adolescent brain changes in relation to MA use (Kim et al., Reference Kim, Kim, Hwang, Kim, Renshaw, Yurgelun-Todd and Yoon2018; Lyoo et al., Reference Lyoo, Yoon, Kim, Lim, Choi, Kim and Renshaw2015). In our previous study, we found that the structural changes in relation to MA use were greater on gray matter (GM) and white matter (WM) of specific brain regions in adolescent MA users than their adult counterpart (Lyoo et al., Reference Lyoo, Yoon, Kim, Lim, Choi, Kim and Renshaw2015). Specifically, the extent of cortical thickness reductions was greater in the orbitofrontal, precuneus, and inferior parietal regions of adolescent MA users than adult MA users. Furthermore, fractional anisotropy values reflecting WM integrity were smaller in the corticostriatal tracts of adolescent MA users as compared with those of adult MA users. In addition, prefrontal metabolic dysfunction as reflected by reduced n-acetyl-aspartate levels was observed in adolescent MA users (Kim et al., Reference Kim, Kim, Hwang, Kim, Renshaw, Yurgelun-Todd and Yoon2018). Taken together, these previous studies suggested that the adolescent brain appears to be more susceptible to MA-induced neurotoxicity from a structural standpoint than the adult brain.
As the adolescent brain undergoes dynamic reorganization to become more integrated and adaptive during development (Spear, Reference Spear2018), adolescence is a period of both increased vulnerability as well as enhanced compensatory remodeling to harmful environmental stimuli such as illicit drug exposure (Crews, He, & Hodge, Reference Crews, He and Hodge2007; Spear, Reference Spear2000, Reference Spear2018). Specifically, several types of experiences, environmental stimuli, or developmental disorders can influence the maturation of neural circuits during adolescence through neuroplastic changes within neuronal connections (Dow-Edwards et al., Reference Dow-Edwards, MacMaster, Peterson, Niesink, Andersen and Braams2019). For instance, developmental disorders such as Tourette syndrome and attention-deficit/hyperactivity disorder as well as exposure to stimulant-type medications may evoke neuroplastic reorganization in the developing brain (Dow-Edwards et al., Reference Dow-Edwards, MacMaster, Peterson, Niesink, Andersen and Braams2019; Jackson et al., Reference Jackson, Parkinson, Jung, Ryan, Morgan, Hollis and Jackson2011; Peterson et al., Reference Peterson, Skudlarski, Anderson, Zhang, Gatenby, Lacadie and Gore1998, Reference Peterson, Staib, Scahill, Zhang, Anderson, Leckman and Webster2001; Plessen, Bansal, & Peterson, Reference Plessen, Bansal and Peterson2009). A variety of cellular mechanisms including long-term potentiation, synaptogenesis, axonal or dendritic remodeling, and neurogenesis may underlie this experience-dependent plasticity during adolescence, which can be reflected in macroscopic changes in GM volumes and WM connectivity (Dow-Edwards et al., Reference Dow-Edwards, MacMaster, Peterson, Niesink, Andersen and Braams2019).
As such, the effects of MA use on the adolescent brain should be explored under consideration of these developmental characteristics. For instance, the brain circuitry underlying addictive behaviors may undergo reorganization as an effort to compensate for detrimental effects of drug use during adolescence. This suggestion may be corroborated by some preclinical evidence reporting the relative resistance of adolescent rats to the neurotoxic effects of MA (Luikinga, Kim, & Perry, Reference Luikinga, Kim and Perry2018; Teixeira-Gomes et al., Reference Teixeira-Gomes, Costa, Feio-Azevedo, de Bastos, Carvalho and Capela2015).
Since prolonged MA exposure may exert neurotoxic effects particularly on dopamine neurons within the basal ganglia (BG) (Lin, Jan, Kydd, & Russell, Reference Lin, Jan, Kydd and Russell2015), a number of studies on adult MA users examined structural and metabolic changes in the BG (Alicata, Chang, Cloak, Abe, & Ernst, Reference Alicata, Chang, Cloak, Abe and Ernst2009; Chang, Alicata, Ernst, & Volkow, Reference Chang, Alicata, Ernst and Volkow2007; Chang et al., Reference Chang, Cloak, Patterson, Grob, Miller and Ernst2005; Ernst, Chang, Leonido-Yee, & Speck, Reference Ernst, Chang, Leonido-Yee and Speck2000; Jan, Lin, Miles, Kydd, & Russell, Reference Jan, Lin, Miles, Kydd and Russell2012; Jernigan et al., Reference Jernigan, Gamst, Archibald, Fennema-Notestine, Mindt, Marcotte and Grant2005; Sekine et al., Reference Sekine, Minabe, Kawai, Suzuki, Iyo, Isoda and Mori2002). As such, MA-induced structural changes in the BG may partly reflect the compensatory responses or glial-mediated neurotrophic effects in response to repeated MA-induced injury, which may occur particularly during the early phase of drug dependence (Chang et al., Reference Chang, Cloak, Patterson, Grob, Miller and Ernst2005). However, the effects of MA exposure on the BG have not been studied in adolescent MA users. Considering the proposed role of the BG as the important substrates for neuroadaptation to MA use (Belin, Jonkman, Dickinson, Robbins, & Everitt, Reference Belin, Jonkman, Dickinson, Robbins and Everitt2009; Luikinga et al., Reference Luikinga, Kim and Perry2018), it is important to investigate the influences of MA exposure on the adolescent brain.
In the present study, the structural alteration as well as reorganization of the brain networks following MA exposure were evaluated in a balanced sample of adolescent and adult MA users and their respective age- and sex-matched controls. Specifically, we defined the ‘morphometric networks’ based on the structural covariance of GM patterns using independent component analysis (ICA) on GM images (Beckmann, DeLuca, Devlin, & Smith, Reference Beckmann, DeLuca, Devlin and Smith2005; Beckmann & Smith, Reference Beckmann and Smith2004). Individual morphometric networks were further grouped into the ‘major network modules’ based on their similarity to the resting-state functional networks (Luo et al., Reference Luo, Sui, Abrol, Chen, Turner, Damaraju and Calhoun2020; Rodrigue et al., Reference Rodrigue, Alexander-Bloch, Knowles, Mathias, Mollon, Koenis and Glahn2020). In the current study, the major network modules included the default mode, cognitive control, salience, limbic, sensory, and visual network modules. Among these, we have specifically focused on the default mode network module encompassing the prefrontal, precuneus, inferior parietal, and temporal regions, known for its vulnerability to the effects of MA exposure particularly during adolescence (Kim et al., Reference Kim, Kim, Hwang, Kim, Renshaw, Yurgelun-Todd and Yoon2018; Lyoo et al., Reference Lyoo, Yoon, Kim, Lim, Choi, Kim and Renshaw2015). As the measures of MA effects on the brain, we examined GM volumes and structural connectivity of the major network modules as well as the structural connectivity between the BG and the abovementioned major network modules.
Methods
Participants and assessments
The current sample is from the previously published study (Lyoo et al., Reference Lyoo, Yoon, Kim, Lim, Choi, Kim and Renshaw2015), which included 111 adolescents (MA user, adolescent MA group, n = 51; age- and sex-matched controls, adolescent control group, n = 60) and 114 adults (MA user, adult MA group, n = 54; age- and sex-matched controls, adult control group, n = 60). The mean values of age were 18.1 years (s.d. 1.5; range, 15–20 years) for the adolescent MA group and 18.1 years (s.d. 1.2; range, 15–20 years) for the adolescent control group. For the adult groups, the mean values of age were 41.6 years (s.d. 5.6; range, 34–58 years) and 41.4 years (s.d. 5.9; range, 30–57 years) for the adult MA and adult control groups, respectively. All participants of the adolescent and adult MA groups met the diagnostic criteria for MA dependence. The exclusion criteria included the presence of current Axis 1 diagnosis other than MA or nicotine dependence, concurrent major neurological or medical diseases, history of head trauma with loss of consciousness lasting longer than 30 min, or any contraindication to magnetic resonance imaging (MRI). All participants were seronegative for human immunodeficiency virus infection.
A detailed history of medical conditions and substance use patterns was obtained by a board-certified psychiatrist (SY). The diagnosis of MA dependence for individuals assigned to the MA groups as well as the exclusion of individuals having any significant current Axis 1 diagnosis were performed based on the Structured Clinical Interview for the DSM-IV (First, Gibbon, Spitzer, & Williams, Reference First, Gibbon, Spitzer and Williams1996; Lyoo et al., Reference Lyoo, Yoon, Kim, Lim, Choi, Kim and Renshaw2015).
Clinical and demographic characteristics of study participants are described in online Supplementary Table S1.
Cognitive performance was assessed for seven domains including executive function, memory, learning, verbal fluency, working memory, information processing speed, and motor skill, using a series of neuropsychological tests, as described in detail elsewhere (Lyoo et al., Reference Lyoo, Yoon, Kim, Lim, Choi, Kim and Renshaw2015) and in Supplementary material. Composite Z scores of all seven cognitive domains adjusted for age, sex, and education level were used in subsequent analyses as a measure of global cognitive performance. Detailed methods for the assessment of cognitive performance are presented in online Supplementary methods and Supplementary Table S2.
This study was approved by the Institutional Review Boards of the Catholic University of Korea College of Medicine, Seoul National University Hospital, and Ewha W. University.
MRI data acquisition and preprocessing
High-resolution T1-weighted MRI images were obtained using a 1.5-Tesla whole-body imaging system (Signa HDx, GE Healthcare, Milwaukee, WI) and a 3-dimensional spoiled gradient-echo sequence with the following acquisition parameters: repetition time = 24 ms, echo time = 5 ms, a field of view = 240 mm, matrix = 256 × 256 mm2, flip angle = 45°, number of excitations = 2, slice thickness = 1.2 mm, no skip.
T1-weighted images were processed with Statistical Parametric Mapping 12 (Wellcome Centre for Human Neuroimaging, University College London, UK; https://www.fil.ion.ucl.ac.uk/spm/). In brief, all images were bias corrected and segmented into GM, WM, and cerebrospinal fluid. A study-specific GM template was created from the segmented images of all participants using high dimensional Diffeomorphic Anatomic Registration Through Exponentiated Lie Algebra warping algorithm (Ashburner, Reference Ashburner2007) and spatially registered to Montreal Neurological Institute standard space. The segmented GM tissue images of all subjects were then non-linearly warped to the template, resampled to an isotropic resolution of 2.0 mm, and modulated using Jacobean determinants from the spatial normalization step. The modulated GM images were finally smoothed with an 8 mm3 isotropic Gaussian kernel. Visual inspection for quality control was carried out at each stage.
Independent component analysis and construction of network matrix
A model-free and data-driven approach using ICA (Beckmann & Smith, Reference Beckmann and Smith2004; Beckmann et al., Reference Beckmann, DeLuca, Devlin and Smith2005) was applied to decompose the GM images into statistically independent and spatially distinct components based on the covariance of GM patterns (Pichet Binette et al., Reference Pichet Binette, Gonneaud, Vogel, La Joie, Rosa-Neto, Collins and Vachon-Presseau2020). Specifically, the modulated and smoothed GM images of all participants were concatenated to create a four-dimensional dataset. Spatially independent component (IC) maps were created by using the four-dimensional GM image dataset as an input for the Multivariate Exploratory Linear Optimized Decomposition into Independent Components (https://fsl.fmrib.ox.ac.uk/fsl/fslwiki/MELODIC) toolbox from the FSL analysis package (Coppen, van der Grond, Hafkemeijer, Rombouts, & Roos, Reference Coppen, van der Grond, Hafkemeijer, Rombouts and Roos2016; Pichet Binette et al., Reference Pichet Binette, Gonneaud, Vogel, La Joie, Rosa-Neto, Collins and Vachon-Presseau2020). A maximum probability GM mask excluding the cerebellum was applied to ensure the only GM voxels of the cerebrum to be retained for the ICA. The study applied the dimensionality of 30 as the optimal number of IC for the assessment of finely grained structural organization based on previous studies (Pichet Binette et al., Reference Pichet Binette, Gonneaud, Vogel, La Joie, Rosa-Neto, Collins and Vachon-Presseau2020; Zeighami et al., Reference Zeighami, Ulla, Iturria-Medina, Dadar, Zhang, Larcher and Dagher2015). Each IC was converted to z-statistics and thresholded at z = 3.0 to retain the voxels which significantly contributed to the IC. The brain regions of these thresholded ICs were defined as individual ‘morphometric networks’ in this study. GM volumes were extracted from the morphometric networks of each individual and used for further analyses.
These morphometric networks which represent anatomical networks with spatially distinct covariance, were further grouped into ‘network modules’ based on their similarity to the resting-state functional networks (Luo et al., Reference Luo, Sui, Abrol, Chen, Turner, Damaraju and Calhoun2020; Rodrigue et al., Reference Rodrigue, Alexander-Bloch, Knowles, Mathias, Mollon, Koenis and Glahn2020).
For estimating the network pattern of GM organization within each of the four groups, structural network connection matrices were created by calculating the correlation coefficients of GM volumes between each pair of the morphometric networks for all subjects within each group. A 30 × 30 correlation matrix representing the network pattern of GM organization was then generated for each of the four groups (adolescent MA group, adolescent control group, adult MA group, and adult control group). Correlation coefficients among the morphometric networks within the particular network modules were averaged within each group and the resulting correlation coefficient for the specific network module was used to represent the connectivity and coherence of GM organization in this network module.
Statistical analysis
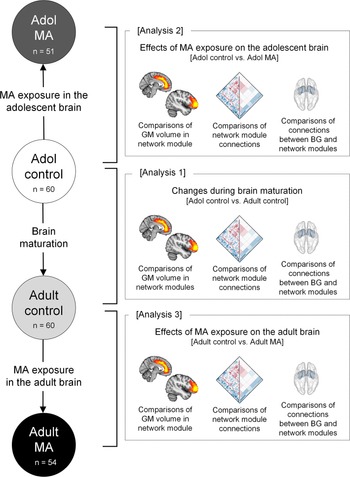
The current study performed the following three main analyses: (1) changes in structural network organization during brain maturation by comparing GM volumes and connectivity of the network modules between the adolescent control (n = 60) and adult control (n = 60) groups, (2) the effects of MA use on structural network organization of the adolescent brain by comparing GM volumes and connectivity of the network modules between the adolescent MA (n = 51) and adolescent control (n = 60) groups, and (3) the effects of MA use on structural network organization of the adult brain by comparing GM volumes and connectivity of the network modules between the adult MA (n = 54) and adult control (n = 60) groups (Fig. 1).

Fig. 1. Schematic overview of analyses to examine the effects of MA on the adolescent and adult brains (analysis 2 and analysis 3) and the effects of brain maturation (analysis 1) in the context of GM volumes and connectivity of network modules. Analysis 1 examined the differences in GM volumes and connections of network modules between the adolescent control group (n = 60) and adult control group (n = 60) to identify brain regions showing significant structural network reorganization during brain maturation. Analysis 2 examined the differences in GM volumes and connections of network modules between the adolescent control group (n = 60) and the adolescent MA group (n = 51) to identify the effects of MA use on structural network reorganization of the adolescent brains. Analysis 3 examined the differences in GM volumes and connections of network modules between the adult control group (n = 60) and adult MA group (n = 54) to identify the effects of MA use on structural network reorganization of the adult brains. Adol, adolescent; GM, gray matter; MA, methamphetamine; BG, basal ganglia.
For GM volumes of the network modules, linear regression analysis was used to examine between-group differences. For connectivity of the network modules, a permutation test was used to compare the group-level averaged correlation coefficients. The group label of all subjects was randomly permuted 5000 times and z-test statistics were used to examine whether the group-level averaged correlation coefficient in a group is greater than that of another group while considering the sample size of each group (Pichet Binette et al., Reference Pichet Binette, Gonneaud, Vogel, La Joie, Rosa-Neto, Collins and Vachon-Presseau2020). p values were calculated by the proportion of times that the z values for group comparisons under the simulated null distribution are greater than those obtained from the real labels. False discovery rate (FDR) was used to correct for multiple comparisons of GM volumes as well as connectivity of network modules.
To evaluate the clinical implication of GM volume alterations, Pearson correlation analysis was used to explore the relationships between GM volumes of the network modules and global cognitive performance in each group.
Results
Morphometric networks and network modules
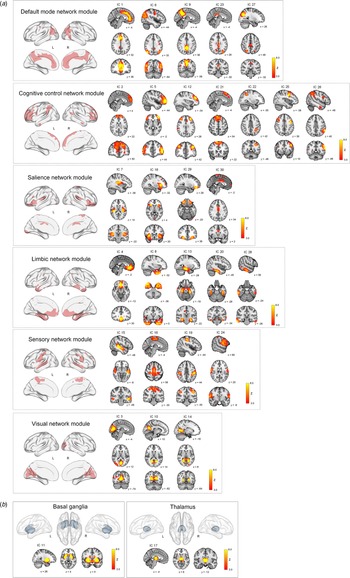
ICA on the GM maps of all participants extracted 28 cortical and two subcortical ICs (morphometric networks). Twenty-eight cortical morphometric networks were assigned to each of the six major network modules including the default mode network module (ICs 1, 6, 9, 23, and 27), cognitive control network module (ICs 2, 5, 12, 21, 22, 25, and 26), salience network module (ICs 7, 18, 29, and 30), limbic network module (ICs 4, 8, 13, 20 and 28), sensory network module (ICs 15, 16, 19, and 24), and visual network module (ICs 3, 10, and 14) (Fig. 2a). Two subcortical morphometric networks included the BG (IC 11) and thalamus (IC 17) regions, respectively (Fig. 2b).

Fig. 2. Spatial maps of z score images for 30 morphometric networks identified by independent component analysis of T1-weighted images of a total of 225 individuals. The number of IC (morphometric network) represents the amount of variance explained by the corresponding component in decreasing order. Spatial maps of morphometric networks were thresholded at z = 3.0. Each morphometric network was further assigned to one of six network modules including the default mode, cognitive control, salience, limbic, sensory, and visual network modules based on the similarity of anatomically derived morphometric networks to intrinsic functional networks from resting-state functional MRI (Luo et al., Reference Luo, Sui, Abrol, Chen, Turner, Damaraju and Calhoun2020). Brain regions of each network module are also overlaid on the brain surface using the BrainNet Viewer (http://www.nitrc.org/projects/bnv/) (Xia, Wang, & He, Reference Xia, Wang and He2013). In addition to the cortical network modules (a), ICs 11 and 17 were assigned to subcortical networks including the basal ganglia and thalamus, respectively (b). IC, independent component; L, left; R, right; MRI, magnetic resonance imaging.
Given the significant role of the BG, as the part of the reward circuit, in addictive behaviors (Belin et al., Reference Belin, Jonkman, Dickinson, Robbins and Everitt2009; Koob & Volkow, Reference Koob and Volkow2016; Luikinga et al., Reference Luikinga, Kim and Perry2018), we focused on the following network connections as main interests in the current study: (1) network module connectivity: connections among the morphometric networks assigned to each of the six network modules, respectively and (2) BG network connectivity: connections between the BG and each of the six network modules, respectively.
Comparisons between the adolescent control and adult control groups
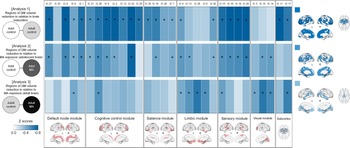
For the estimation of network GM volume alterations during brain maturation, we first compared GM volumes of the network modules between the adolescent (n = 60) and adult (n = 60) control groups (Fig. 1). As compared to the adolescent control group, the adult control group showed significant GM volume reductions in most network modules including the default mode (β = −0.295, FDR corrected p = 0.002), cognitive control (β = −0.350, FDR corrected p < 0.001), salience (β = −0.257, FDR corrected p = 0.007), and sensory (β = −0.409, FDR corrected p < 0.001) network modules. There were no significant between-group differences in GM volumes of the limbic (β = −0.177, FDR corrected p = 0.061) and visual (β = −0.117, FDR corrected p = 0.202) network modules. For the subcortical networks, GM volumes of the BG (β = −0.324, FDR corrected p < 0.001) and thalamus (β = −0.290, FDR corrected p = 0.002) networks were significantly reduced in the adult control group relative to the adolescent control group. Statistics values of group comparisons in GM volumes of individual morphometric networks are provided in Fig. 3 and online Supplementary Table S3.

Fig. 3. Between-group differences in GM volumes of each morphometric network for analysis 1 (adolescent control v. adult control groups), analysis 2 (adolescent control v. adolescent MA groups), and analysis 3 (adult control v. adult MA groups). Z score matrices for analyses 1 to 3 indicate z scores for between-group differences in GM volumes based on the means and standard deviations of the reference groups (adolescent control groups for analyses 1 and 2 and adult control group for analysis 3). Darker blue color indicates greater GM volume reductions in the adult control, adolescent MA, and adult MA groups relative to the reference groups of each analysis, respectively. Asterisks within the z score matrices represent ICs with significant between-group differences at FDR-corrected p < 0.05. Brain regions of significant between-group differences of analyses 1 to 3 are also shown on the brain surface as the color map. Adol, adolescent; GM, gray matter; MA, methamphetamine; L, left; R, right; FDR, false discovery rate.
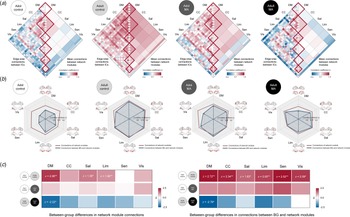
The structural connectivity of each network module was calculated for each group by averaging pairwise correlation coefficients between the morphometric networks assigned to the respective network module. We then compared the connectivity of each network module (diagonal elements of matrix in Fig. 4a and the red lines of radar charts in Fig. 4b) between the adolescent and adult control groups using z-test statistics. Group-averaged correlation coefficients of the default mode network (z = 2.058, FDR corrected p = 0.003), salience (z = 1.381, FDR corrected p = 0.031), and limbic (z = 1.904, FDR corrected p = 0.003) network modules were higher in the adult control group relative to the adolescent control group (Fig. 4c). There were no differences in connectivity of other network modules between the groups.

Fig. 4. Structural connections of network modules in each group and their between-group differences. (a) Correlation matrices of GM volumes between each morphometric network were constructed for the adolescent control, adult control, adolescent MA, and adult MA groups, respectively. (b) Structural connections of the network modules and connections between the BG and each of the network modules in study groups are presented in dark red and blue lines of radar graphs for each group, respectively. (c) Group-averaged correlation coefficients of network modules (left matrix in the panel c) and connections between the BG and network modules (right matrix) were compared between the groups (adolescent control v. adult control for analysis 1; adolescent control v. adolescent MA for analysis 2; adult control v. adult MA for analysis 3) using z-test statistics. Darker red color of the z score matrices indicates stronger connections in each group (the adult control and adolescent MA groups) relative to the corresponding reference group, while darker blue color indicates weaker connections. *FDR corrected p < 0.05 and **FDR corrected p < 0.01. Adol, adolescent; MA, methamphetamine; GM, gray matter; DM, default mode module; CC, cognitive control module; Sal, salience module; Lim, limbic module; Sen, sensory module; Vis, visual module; BG, basal ganglia; FDR, false discovery rate.
For structural connectivity between the BG and each of the network modules (the blue lines of radar charts in Fig. 4b), as compared to the adolescent control group, the adult control group showed significantly stronger connections of the BG with the all network modules (default mode, z = 2.721, FDR corrected p = 0.002; cognitive control, z = 2.338, FDR corrected p = 0.008; salience, z = 1.628, FDR corrected p = 0.031; limbic, z = 2.004, FDR corrected p = 0.007; sensory, z = 2.518, FDR corrected p = 0.002; visual, z = 2.092, p = 0.012) (Fig. 4c).
Z values for group comparisons of connectivity under the simulated null distributions as well as their respective real values are provided in online Supplementary Figs S1 and S2.
Comparisons between the adolescent control and adolescent MA groups
Effects of MA use on the adolescent brain were estimated by comparing GM volumes and connectivity of network modules between the adolescent MA (n = 51) and adolescent (n = 60) control groups (Fig. 1). The adolescent MA group showed significant GM volume reductions in all cortical network modules as compared to the adolescent control group (default mode, β = −0.275, FDR corrected p = 0.016; cognitive control, β = −0.242, FDR corrected p = 0.027; salience, β = −0.205, FDR corrected p = 0.041; limbic, β = −0.222, FDR corrected p = 0.034; sensory, β = −0.293, FDR corrected p = 0.016; visual, β = −0.219, FDR corrected p = 0.034) (Fig. 3). There were no between-group differences in GM volumes of subcortical networks (BG, β = −0.121, FDR corrected p = 0.204 thalamus, β = −0.158, FDR corrected p = 0.111). Individual statistical values for group comparisons in GM volumes of the morphometric networks are provided in online Supplementary Table S3. Results remain unchanged after adjusting for potential confounding factors such as tobacco use or alcohol drinking (Supplementary results).
For structural connectivity, although the extensive GM volume reductions were observed in adolescents in relation to MA use, group-averaged correlation coefficients did not differ according to MA use in all network modules (Fig. 4c). In addition, there were no significant differences in connectivity between the BG and each network module between the adolescent MA and adolescent control groups (Fig. 4c). Z values for group comparisons of connectivity under the simulated null distributions as well as their respective real values are provided in online Supplementary Figs S1 and S2.
Comparisons between the adult control and adult MA groups
To estimate the effects of MA use on the adult brain, we compared GM volumes and connectivity of network modules between the adult MA (n = 54) and adult control (n = 60) groups (Fig. 1). GM volumes in the limbic (β = −0.278, FDR corrected p = 0.008), and visual (β = −0.286, FDR corrected p = 0.008) network modules were reduced in the adult MA group as compared to the adult control group (Fig. 3). GM volumes of other network modules did not differ between the two groups (default mode, β = −0.179, FDR corrected p = 0.064; cognitive control, β = −0.202, FDR corrected p = 0.053; salience, β = −0.163, FDR corrected p = 0.083; sensory, β = −0.200, FDR corrected p = 0.053). Significant between-group differences in GM volumes were observed in the thalamus network (β = −0.329, FDR corrected p = 0.003), but not in the BG network (β = −0.182, FDR corrected p = 0.064). Statistical values for the between-group differences in GM volumes of individual morphometric networks are provided in online Supplementary Table S3. Similar results were produced after adjusting for tobacco use or alcohol drinking (Supplementary results).
For structural connectivity, the adult MA group had a lower group-averaged correlation coefficient of the default mode network module as compared to the adult control group (z = −2.223, FDR corrected p = 0.005) (Fig. 4c). Connection strength between the BG and the default mode module (z = −2.782, FDR corrected p = 0.016) was also reduced in the adult MA group relative to the adult control group (Fig. 4c). Z values for group comparisons of connectivity under the simulated null distributions as well as their respective real values are provided in online Supplementary Figs S1 and S2.
Correlations between network GM volumes and cognitive performance
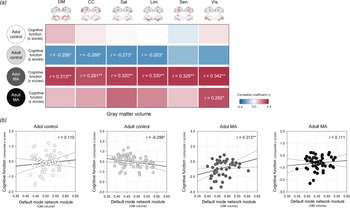
The relationships between network GM volumes and global cognitive performance were assessed in each study group to evaluate the clinical implication of network GM volume alterations (Fig. 5).

Fig. 5. Relationships between GM volumes of each network module and z composite score of global cognitive performance in the adolescent control, adult control, adolescent MA, and adult MA groups. (a) A correlation coefficient matrix represents the relationships between GM volumes of each network module and global cognitive performance in each group. (b) Red color indicates the positive correlations, while blue color indicates the negative correlations. Scatter plots and regression lines represent the relationships between GM volumes of the default mode module and global cognitive performance in each group. *Uncorrected p < 0.05 and **FDR-corrected p < 0.05. Adol, adolescent; MA, methamphetamine; GM, gray matter; DM, default mode module; CC, cognitive control module; Sal, salience module; Lim, limbic module; Sen, sensory module; Vis, visual module; BG, basal ganglia; FDR, false discovery rate.
There were no significant relationships between network GM volumes and cognitive performance in the adolescent control group (default mode, r = 0.110, p = 0.401; cognitive control r = 0.029, p = 0.829; salience, r = 0.010, p = 0.942; limbic, r = −0.004, p = 0.978; sensory, r = −0.059, p = 0.657; visual, r = 0.038, p = 0.772).
In the adult control group that showed significant GM volume reductions relative to the adolescent control group, network GM volume reductions were associated with greater cognitive performance. Specifically, GM volumes of the default mode (r = −0.256, p = 0.049), cognitive control (r = −0.268, p = 0.039), salience (r = −0.273, p = 0.035), and limbic (r = −0.263, p = 0.043) network modules had negative correlations with global cognitive performance in the adult control group. However, these associations did not survive after correcting for multiple comparisons by FDR.
In contrast, network GM volume reductions were related to diminished cognitive performance (default mode, r = 0.313, p = 0.025; cognitive control r = 0.291, p = 0.039; salience, r = 0.320, p = 0.022; limbic, r = 0.330, p = 0.018; sensory, r = 0.329, p = 0.018; visual, r = 0.342, p = 0.014) in the adolescent MA group. These relationships remained significant after adjustment for the multiple comparisons by FDR.
In the adult MA group, the GM volume in the visual network module was positively associated with the global cognitive performance in the adult MA group (r = 0.292, p = 0.032). Yet, this relationship no longer remained significant after FDR correction for multiple comparisons.
Discussion
This is the first human study, to our knowledge, to evaluate the effects of MA use during adolescence from a structural brain network perspective. Using a balanced sample of adolescent and adult MA users, the current study provides proof-of-concept evidence for widespread GM volumes loss in relation to MA use as well as complementing structural network reorganization in the adolescent brain.
The current study, extended from our earlier findings of adolescent-specific patterns of individual regional cortical thickness reductions related to MA use (Lyoo et al., Reference Lyoo, Yoon, Kim, Lim, Choi, Kim and Renshaw2015), further explored the structural alterations at a network level. Here, we show that GM volumes were more extensively reduced across all network modules in adolescent MA users. These profound GM volume reductions in adolescent MA users should be interpreted from a developmental perspective, considering the inverted U-shape of cortical development (Crews et al., Reference Crews, He and Hodge2007; Giedd et al., Reference Giedd, Blumenthal, Jeffries, Castellanos, Liu, Zijdenbos and Rapoport1999). For instance, GM volume reductions can occur during normal development of dynamic brain maturation and cortical reconstruction (Giedd et al., Reference Giedd, Blumenthal, Jeffries, Castellanos, Liu, Zijdenbos and Rapoport1999; Paus, Reference Paus2005; Pfefferbaum et al., Reference Pfefferbaum, Mathalon, Sullivan, Rawles, Zipursky and Lim1994), as shown in our findings of reduced GM volumes in the adult control group compared to the adolescent control group. However, GM volume reductions across all the network modules observed in the adolescent MA group may not reflect the beneficial process of neuronal pruning and cortical remodeling, but rather reflect a premature decline in GM volume as a part of MA-induced accelerated aging (Squeglia et al., Reference Squeglia, Tapert, Sullivan, Jacobus, Meloy, Rohlfing and Pfefferbaum2015). This interpretation is partly supported by the results from our correlation analyses. Specifically, reduced GM volumes in the default mode, cognitive control, salience, and limbic network modules were associated with diminished cognitive performance in adolescent MA users.
Our structural network analysis suggested that connectivity of the network modules may become more refined and strengthened during brain maturation, as the GM volume of these networks may decline with neuronal pruning. In the adult control group, connectivity of the default mode network module was enhanced, while its GM volumes were significantly reduced as compared to the adolescent control group. This direction of the brain structural alterations may reflect a beneficial pruning process for normal brain maturation (Schmithorst & Yuan, Reference Schmithorst and Yuan2010; Tau & Peterson, Reference Tau and Peterson2010).
For structural network analysis to examine the MA effects, adult MA users showed attenuated connectivity and reduced GM volumes of the default mode network module as compared with healthy adults. These results are broadly in alignment with previous findings that reported brain network dysfunctions in adult drug abusers (Zhang & Volkow, Reference Zhang and Volkow2019; Zilverstand, Huang, Alia-Klein, & Goldstein, Reference Zilverstand, Huang, Alia-Klein and Goldstein2018), as well as impaired networks interconnecting brain regions including the prefrontal, subcortical, and limbic areas in adult MA users (Chung et al., Reference Chung, Lyoo, Kim, Hwang, Bae, Sung and Renshaw2007; Oh et al., Reference Oh, Lyoo, Sung, Hwang, Kim, Chung and Song2005; Paulus, Tapert, & Schuckit, Reference Paulus, Tapert and Schuckit2005; Salo, Ursu, Buonocore, Leamon, & Carter, Reference Salo, Ursu, Buonocore, Leamon and Carter2009).
In contrast to findings from the adult MA group, adolescent MA users, despite having a far greater extent of GM volume reductions, did not show significantly reduced network connectivity as compared with healthy adolescents. This contrasting pattern in structural connectivity of the brain networks between adult and adolescent MA users may become more evident in the case of connectivity between the BG and major network modules.
The BG are known to form interconnected networks with several brain regions including the prefrontal and limbic regions, where these networks centered around the BG are involved in regulating the reward system underlying addictive behaviors (Koob & Volkow, Reference Koob and Volkow2016; Luikinga et al., Reference Luikinga, Kim and Perry2018). Furthermore, the BG are known to be the main neural substrates for adaptation to altered dopamine signaling induced by MA use (Koob & Volkow, Reference Koob and Volkow2016; Luikinga et al., Reference Luikinga, Kim and Perry2018). From the developmental perspective, synaptic remodeling of the BG, limbic, and prefrontal brain regions during adolescence plays an important role in adolescent-specific patterns of addictive behaviors (Crews et al., Reference Crews, He and Hodge2007).
The BG of the adolescent control group exhibited significantly reduced connectivity with major network nodules including the default mode, cognitive control, and limbic network modules, as compared to the adult control group. Consistent with previous preclinical and clinical studies (Casey, Jones, & Somerville, Reference Casey, Jones and Somerville2011; Darki & Klingberg, Reference Darki and Klingberg2015; van Kerkhof, Damsteegt, Trezza, Voorn, & Vanderschuren, Reference van Kerkhof, Damsteegt, Trezza, Voorn and Vanderschuren2013), this finding may reflect the immaturity of the brain circuitry centered on the BG during adolescence.
The effect of MA use on the BG connectivity was also assessed. The adult MA group exhibited connectivity deficits of the BG with the default mode as compared to the adult control group. This result is in line with previous laboratory studies that consistently reported prolonged neurotoxic effects of repeated exposures to MA on the brain circuitry involving the BG, prefrontal, and limbic brain regions (Cruickshank & Dyer, Reference Cruickshank and Dyer2009). However, contrary to the findings of attenuated connectivity of the BG in the adult MA group, there was no difference in connectivity of the BG between the adolescent MA and control groups. As also shown in the radar charts of Fig. 4, the network organization of the BG in the adolescent MA group may be integrated and similar to that of the adult control group. This pattern of BG connectivity in adolescent MA users may be interpreted as a neuroplastic adaptation to GM volume loss as induced by MA use. This type of compensatory reorganization for structural brain abnormalities has been frequently reported in several neurological as well as in addictive disorders during the developmental stages (Bava et al., Reference Bava, Frank, McQueeny, Schweinsburg, Schweinsburg and Tapert2009; Du et al., Reference Du, Yang, Gao, Qi, Du, Zhang and Zhang2017; Hardee et al., Reference Hardee, Weiland, Nichols, Welsh, Soules, Steinberg and Heitzeg2014; Orr et al., Reference Orr, Morioka, Behan, Datwani, Doucet, Ivanovic and Garavan2013; Silveri, Rogowska, McCaffrey, & Yurgelun-Todd, Reference Silveri, Rogowska, McCaffrey and Yurgelun-Todd2011; Squeglia et al., Reference Squeglia, Tapert, Sullivan, Jacobus, Meloy, Rohlfing and Pfefferbaum2015). Namely, extensive structural abnormalities in relation to insults from external stimuli may accelerate brain development as ontogenetic adaptation in response to harmful environments (Gee et al., Reference Gee, Gabard-Durnam, Flannery, Goff, Humphreys, Telzer and Tottenham2013; Gur et al., Reference Gur, Moore, Rosen, Barzilay, Roalf, Calkins and Gur2019; Pfefferbaum et al., Reference Pfefferbaum, Kwon, Brumback, Thompson, Cummins, Tapert and Sullivan2018). These developmental characteristics may also reflect the relative tolerance to MA-induced neurotoxicity during the adolescent period, which is frequently observed in the animal models (Luikinga et al., Reference Luikinga, Kim and Perry2018; Teixeira-Gomes et al., Reference Teixeira-Gomes, Costa, Feio-Azevedo, de Bastos, Carvalho and Capela2015).
However, other possible explanations may account for the current findings. Animal research suggests that age-dependent pharmacokinetic effects may partly explain the differences in the brain responses to MA exposure between adolescents and adults (Kokoshka, Fleckenstein, Wilkins, & Hanson, Reference Kokoshka, Fleckenstein, Wilkins and Hanson2000; Teixeira-Gomes et al., Reference Teixeira-Gomes, Costa, Feio-Azevedo, de Bastos, Carvalho and Capela2015). In addition, the patterns of network connectivity in the adolescent MA group may resemble those of healthy adults. These patterns present in the adolescent MA group may reflect pre-existing structural deficits, which might convey a specific vulnerability or sensitivity to the rewarding effects of MA.
Furthermore, the fact that adult MA users had a longer period and a greater amount of MA use as compared with adolescent MA users should be taken into account when interpreting the current findings. Specifically, altered structural connectivity in relation to MA use has been observed only in adult MA users, but not in adolescent users. These may be due to that a larger amount or a longer duration of MA use above the certain threshold may influence the brain more extensively resulting in alterations of the structural connectivity at a network level.
There are several limitations to be considered in interpreting the present results. The relationship between structural connectivity measures and cognitive functions may provide further insights into the compensatory role of network connectivity in adolescent-onset MA use. However, the covariance technique of GM volume employed in this study cannot provide measures for individual variability in network connectivity since the structural network matrices based on GM volume data were constructed by measuring inter-network correlation coefficient across a group of subjects (Coppen et al., Reference Coppen, van der Grond, Hafkemeijer, Rombouts and Roos2016; Pichet Binette et al., Reference Pichet Binette, Gonneaud, Vogel, La Joie, Rosa-Neto, Collins and Vachon-Presseau2020; Rodrigue et al., Reference Rodrigue, Alexander-Bloch, Knowles, Mathias, Mollon, Koenis and Glahn2020). Therefore, the correlation analysis between network connectivity and cognitive function could not be performed in this study. The current ICA method to find spatially distinct GM maps by implementing a multivariate approach has advantages of not confining analyses to a priori-defined specific brain regions and efficient filtering of the inter-subject variances (Gupta, Turner, & Calhoun, Reference Gupta, Turner and Calhoun2019). Yet, network analysis using diffusion tensor imaging may be warranted to provide additional evidence on individual-level structural connectivity, further supporting the current findings.
Tobacco smoking is well known for associations with GM structural alterations as well as the brain network disruption (Brody et al., Reference Brody, Mandelkern, Jarvik, Lee, Smith, Huang and London2004; Kharabian Masouleh et al., Reference Kharabian Masouleh, Beyer, Lampe, Loeffler, Luck, Riedel-Heller and Witte2018; Morales, Lee, Hellemann, O'Neill, & London, Reference Morales, Lee, Hellemann, O'Neill and London2012; Zhang et al., Reference Zhang, Li, Wang, Bi, Li, Yi and Yuan2018). Since most MA users in this study were current tobacco smokers, it would be difficult to exactly identify the independent effects of MA exposure apart from those of tobacco use in the present sample. Although repeated analyses including tobacco use history as an additional covariate yielded similar results, future studies with a larger sample may be warranted to examine the shared or independent influences of MA exposure and tobacco use on the adolescent brains.
Study subjects in the present study had neither current alcohol nor drug dependence other than MA. The estimated amount of weekly alcohol consumption was below the criteria for harmful drinking defined by the World Health Organization (, 2000). However, given the well-established relationship between harmful alcohol drinking and structural brain alterations (Pfefferbaum, Sullivan, Rosenbloom, Mathalon, & Lim, Reference Pfefferbaum, Sullivan, Rosenbloom, Mathalon and Lim1998; Sousa et al., Reference Sousa, Sampaio, Marques, López-Caneda, Gonçalves and Crego2019; Zhao, Constable, Hien, Chung, & Potenza, Reference Zhao, Constable, Hien, Chung and Potenza2021; Zou, Durazzo, & Meyerhoff, Reference Zou, Durazzo and Meyerhoff2018), the concurrent alcohol use of study participants should be considered in interpreting the current findings. Although the repeated analyses with alcohol use history as an additional covariate produced similar results, interactive influences between MA and heavy alcohol use should be investigated in future studies on adolescent MA users comorbid with alcohol use disorders.
Although MA users in this study were not diagnosed with substance dependence, other than MA or nicotine use disorders, and did not report the use of other stimulants, it is noteworthy that some drug users may underreport or may not remember light or occasional use of other illicit drugs (Chen, Fang, Shyu, & Lin, Reference Chen, Fang, Shyu and Lin2006; Tassiopoulos et al., Reference Tassiopoulos, Bernstein, Heeren, Levenson, Hingson and Bernstein2004). Furthermore, approximately 29% and 43% of the adolescent and adult MA users, respectively, reported ever having used cannabis, although none of them met the diagnostic criteria for a lifetime or current cannabis abuse or dependence. Therefore, the possibility that unreported or underreported occasional or recreational use of other stimulants may influence the brain (Cowan et al., Reference Cowan, Lyoo, Sung, Ahn, Kim, Hwang and Renshaw2003; Smith, Simon Jones, Bullmore, Robbins, & Ersche, Reference Smith, Simon Jones, Bullmore, Robbins and Ersche2014) should be taken into account in interpreting current findings.
To conclude, our study demonstrates the age-specific pattern of brain structural alterations at a network level in response to neurotoxic substance use. More importantly, the current findings suggest the potential capacity of adolescents to compensate for MA use-induced extensive brain damages through reorganization and enhancement of network connectivity. Treatment options targeting these unique developmental characteristics may be developed as effective therapeutic strategies for adolescent MA abuse.
Supplementary material
The supplementary material for this article can be found at https://doi.org/10.1017/S0033291722000423.
Financial support
This work was supported by the National Institute on Drug Abuse (R01DA024070 to IKL and PFR) and the National Research Foundation of Korea (2020R1A6A1A03043528 and 2020M3E5D9080555 to IKL; 2020R1A2C2005901 to SY). The funders had no role in study design, data collection, data analysis, data interpretation, manuscript preparation, manuscript review, manuscript approval, or decision to submit the manuscript for publication.
Conflict of interest
The authors declare no conflict of interest.


 Open access