


Introduction
Our understanding of the geology of the Groningen field has evolved very significantly from the time of its serendipitous discovery in 1959 until today. Some 75% of the gas originally in place has been produced by now, and the field is rapidly approaching a natural phase of declining production. Nevertheless, its role as an important producer of natural gas will continue for many years to come. A major challenge is provided by the issue of production-induced seismicity, the key subject of this issue of the NJG. Another challenge lies in the fact that, with increasing depletion, it is realised that the field is more complex than initially thought. This is expressed, for example, in the erratic rise of the gas–water contact in the north of the field. Such challenges can only be worked on the basis of an excellent understanding of the geology of the field.
The objective of this paper is to briefly describe the evolution of the current geological understanding of the Groningen field. This will set the scene for the papers presented in this special issue of the NJG dealing with induced seismicity and subsidence related to the gas production from the field.
There are many publications in open literature on the Groningen field, in particular on reservoir development and characteristics. (e.g. Stäuble & Milius, Reference Stäuble, Milius and Halbouty1970; Grötsch & Gaupp, Reference Grötsch and Gaupp2012).
The Nederlandse Aardolie Maatschappij B.V. (NAM) is the operator of the Groningen field. Its website (www.nam.nl) contains a wealth of information and documents on geological aspects, reservoir modelling and induced seismicity.
Discovery and a brief history
The importance of the discovery of the giant Groningen gas field cannot easily be overstated. It created an enormous boost (and change) for the Dutch economy and the development of its welfare state. It kicked off exploration activities not only to pursue the Rotliegend play further, but also other plays in the wider North Sea area. Although no fields of similar size to Groningen have been discovered, the Rotliegend Play did prove to be a prolific one, with a high density of gas fields along the east–west-trending reservoir fairway (Fig. 1).
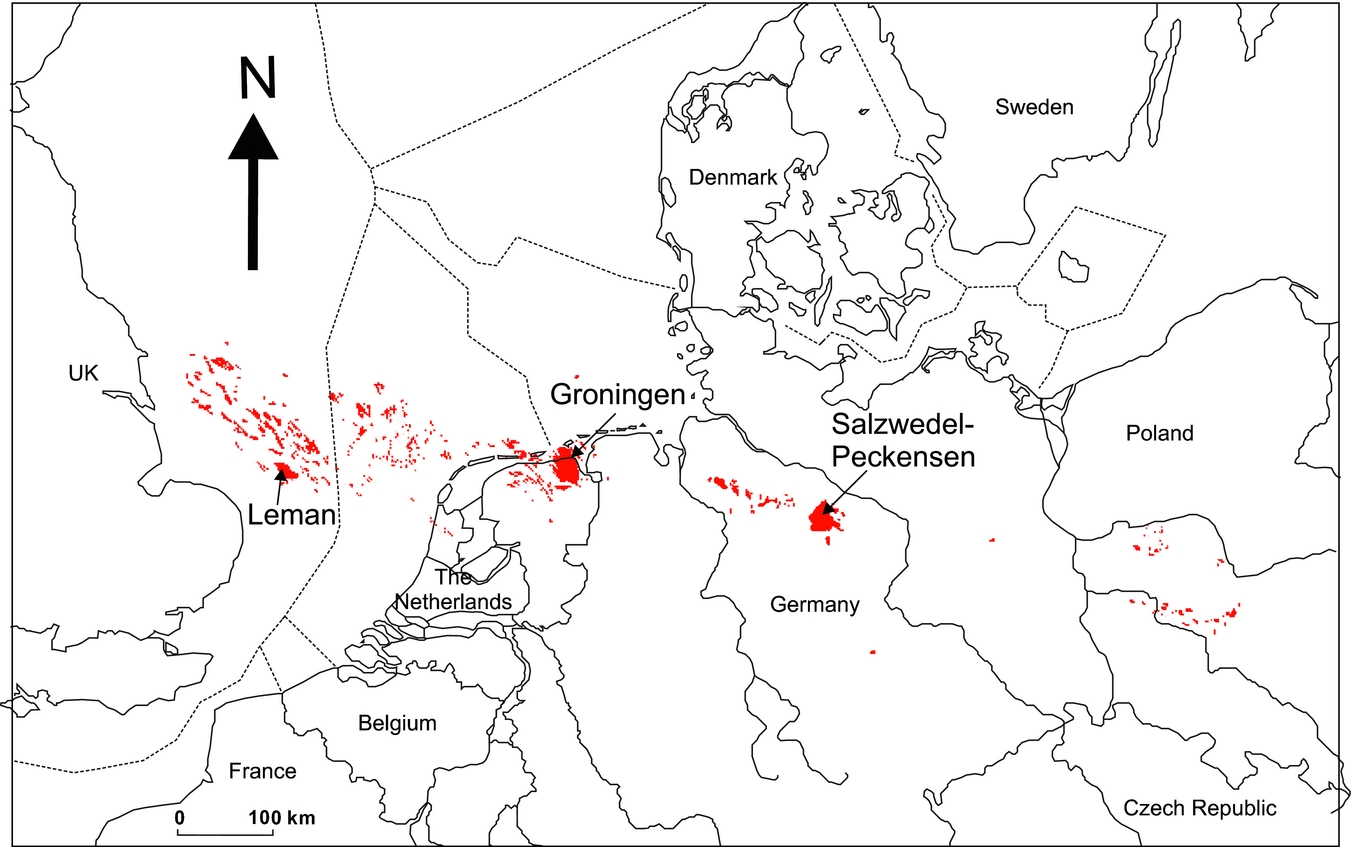
Fig. 1. Rotliegend gas fields in northwestern Europe.
The objective of discovery well Slochteren-1 in 1959 was not a heroic one. It was the third well (after Haren-1 and Ten Boer-1) in a campaign to test the Basal Zechstein carbonates, in which gas had been found before in southeast Drenthe. The well found the Zechstein carbonates to be of tight basinal facies, but the underlying sandstones of the Rotliegend unexpectedly contained a large volume of gas. This discovery did not attract much interest initially. In those days finding oil was the main objective of hydrocarbon exploration, mainly because of the absence of a gas infrastructure and market. In 1960, however, gas of similar composition and pressures was also discovered in Delfzijl-1, which is located some 20km to the northeast of Slochteren. It was then realised that both discoveries could be part of a single gas accumulation that was very large indeed (Correljé, Reference Correljé1998; Geluk & De Jager, Reference Geluk, De Jager and Floor2012). Estimates of recoverable gas volumes went up from an initial 60bcm (billion cubic metres) to 150bcm in early 1962, 470bcm by late 1962, 1100bcm in 1963, 1900bcm in 1967, 2409bcm in 1987 and 2750bcm in 1993 (Geluk & De Jager, Reference Geluk, De Jager and Floor2012). At the time, the Groningen gas field was the largest known gas field in the world. Initial recoverable gas reserves are now assessed at around 2900bcm (or c.100TCF (trillion cubic feet) of gas), and as such it still ranks amongst the largest gas fields in the world.
The speedy decision, already in 1963, to turn the Netherlands into a gas country and connect all households to a gas infrastructure had a major economic impact also because it accelerated the closure of Dutch coal mines in the south of the country. The production capacity of the giant Groningen field later allowed for the introduction of the small fields policy, which stimulated the development of the smaller gas fields in the Dutch onshore and offshore. Groningen gas could thus be saved ‘for our grandchildren’ as a strategic reserve and was used as swing producer to accommodate high demand in winter. Later, foreseeing that the pressure in the Groningen field would go down to such levels that it might not be able to supply 100% of peak demand, underground gas storage facilities were built for additional production capacity. Production from Groningen was always expected to decline around 2020, after some 80–85% of all recoverable gas would have been produced. The societal impact of induced earth tremors has brought this point forward in time by some five years. The combination of increasing damage to houses and structures leading to increasing public pressure, and the realisation that the frequency and magnitude of earth tremors seem to be linked to production levels, has forced the Minister of Economic Affairs to impose a ceiling on annual gas production from the Groningen field, to reduce its undesired effects.
Geological setting
The Upper Permian Rotliegend sediments are deposited in a very broad basin stretching from the UK in the west to Poland in the east (Fig. 1). The entire sequence above the Base Permian Unconformity and below the overlying Zechstein is formally referred to as the Upper Rotliegend Group. In the Dutch subsurface this sequence consists of red beds (van Adrichem Boogaert, Reference Van Adrichem Boogaert and Falke1976). In Germany, an older Lower Rotliegend Group sequence made up of volcaniclastic sediments is also present in fault-bounded grabens.
At the end of the Carboniferous, a compressional event created broad anticlinal swells and regional uplift. Strong erosion of Carboniferous sediments occurred and locally up to several kilometres of sediments were removed by erosion. In some wells on the Groningen High unusually high thermal maturity is measured in the Carboniferous rocks directly below the Base Permian Unconformity (Kettel, Reference Kettel, Kaaschieter and Reijers1983). These are tentatively attributed to local heat pulses from deep intrusive events associated with this latest Carboniferous to Early Permian phase of deformation (De Jager, Reference De Jager, Wong, Batjes and De Jager2007). These events have not been identified in seismic or gravimetric surveys. The cause of the present-day temperature difference of some 10°C between the south and north of the Groningen field area is not known (Fig. 2).

Fig. 2. Reservoir temperature (°C) map of the Groningen field at a depth of 2875m TVDNAP. Red polygon indicates the outline of the gas accumulation. (Courtesy NAM.)
After this phase of strong erosion and peneplanisation, a phase of rifting is documented in Germany where narrow rift basins were filled with Lower Rotliegend Group volcaniclastic sediments. Similar rift basins have not been encountered in the Dutch subsurface, although thin sequences with volcaniclastics have been found southeast of Groningen and in the Ems Low along the German border, and in the Outer Rough Basin in the northern Dutch offshore (Geluk, Reference Geluk, Wong, Batjes and De Jager2007). Subsequently, regional thermal subsidence created the Southern Permian Basin (SPB), in which first the Rotliegend sediments were deposited, followed by the Upper Permian Zechstein and Lower Triassic Buntsandstein sediments. All these sequences were deposited under tectonically very quiescent conditions. From Late Permian to Early Triassic times, the area of the Netherlands was located within the arid climate zone at c.20° north of the equator. The southern margin of the Southern Permian Basin was formed at the northern limit of the London–Brabant Massif and eroding Variscan Mountains: the primary source area for the clastics deposited in the basin.
Upper Rotliegend sediments were known from outcrops in eastern Germany, where its depositional environment had been linked to deserts. Still, the depositional setting of the Rotliegend sandstones in Groningen was a matter of debate initially. One of the options raised was that of a delta environment. Eppo Oomkens from the NAM was the first to realise that also below the Groningen field the sands must have been deposited in a desert environment (Glennie, Reference Glennie, Grötsch and Gaupp2012). Studies by Glennie and Oomkens on recent sediments in the Lybian desert confirmed this interpretation and stressed the importance of mixed fluvial–aeolian processes in a desert environment.
The reservoir sequence in Groningen, the Slochteren Formation, is named after its discovery well Slochteren-1. In the south of the field this is a massive sandstone succession with frequent conglomerate intervals. The succession thickens to the north with an increasing fraction of shaly intervals. Just north of the northern boundary of the Groningen field, the sands become very clay-rich and of poor reservoir quality, before shaling out rather abruptly into a thick claystone sequence with intercalated evaporitic salt intervals, which are grouped in the Silverpit Formation.
Stratigraphy of the Dutch Rotliegend
Van Adrichem Boogaert (Reference Van Adrichem Boogaert and Falke1976) laid the foundation for the formal stratigraphy of the Rotliegend Group. Updates and minor revisions followed with the Stratigraphic Nomenclature for the Netherlands (Van Adrichem Boogaert & Kouwe, Reference Van Adrichem Boogaert and Kouwe1997), and the work of Geluk (Reference Geluk2005). Recently, Van Ojik et al. (Reference Van Ojik, Böhm, Cremer, Geluk, De Jong, Mijnlief, Nio, Grötsch and Gaupp2012) published an integrated stratigraphic framework for the Upper Rotliegend, based on different stratigraphic concepts including sequence stratigraphy, lithostratigraphy, chemostratigraphy and cyclostratigraphy. The difficulty with establishing such a framework is that its continental deposits are virtually barren of fossils and that there is not much material suitable for K/Ar dating. Based on dating of the volcanics of the Lower Rotliegend and of the directly overlying Coppershale of the Zechstein Formation, it is concluded that the entire Upper Rotliegend was deposited in a period of maximum 6 million years (Van Ojik et al., Reference Van Ojik, Böhm, Cremer, Geluk, De Jong, Mijnlief, Nio, Grötsch and Gaupp2012).
The Upper Rotliegend Group is subdivided in the sandy and proximal Slochteren Formation, which passes laterally into the distal and clay-rich evaporitic Silverpit Formation (Figs 3, 4). In the northeast of the Netherlands this transition occurs just north of the Groningen field. In its most proximal setting south of the Groningen field, including the area of the Annerveen field, the Slochteren Formation is a massive conglomeratic sandstone sequence that is difficult to subdivide. Within the extent of the field, the Slochteren Formation is overlain by the claystone-dominated Ten Boer Claystone, which formally is a Member of the Silverpit Formation. The Ten Boer Claystone ranges in thickness from a few tens of metres in the south to 80m or more in the north. Another clay-rich interval developed in the north and is called the Ameland Claystone Member (of the Silverpit Formation) and separates the Lower Slochteren Member from the Upper Slochteren Member. Where the sandstones of the Upper Slochteren Member have also shaled out, the term Silverpit Formation becomes appropriate.
Fig. 3. Reservoir correlation from south to north through the Groningen gas field.
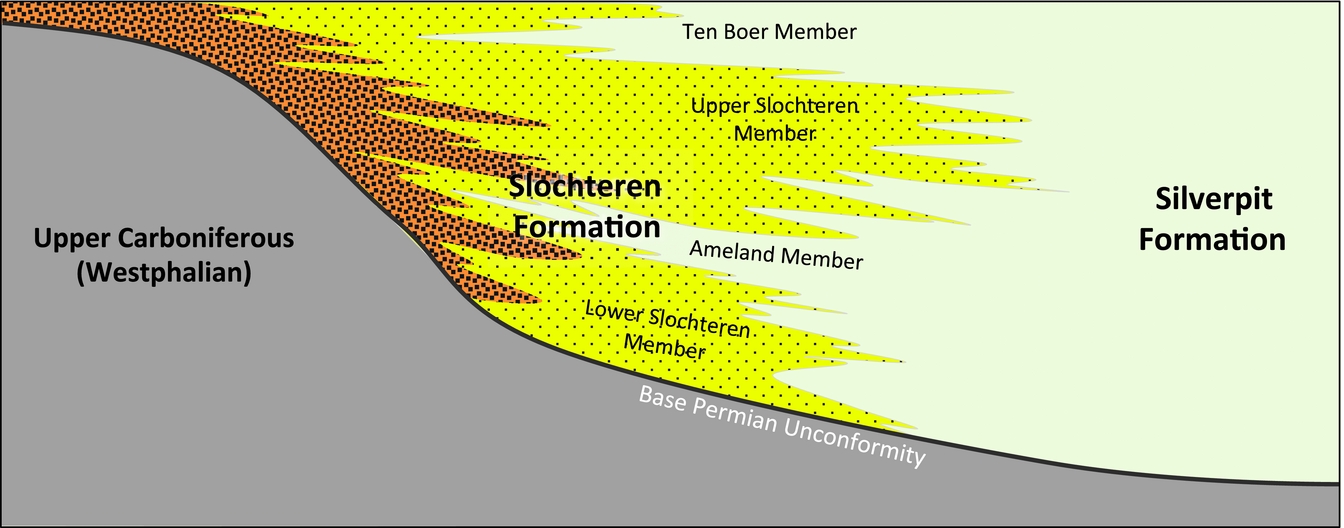
Fig. 4. Stratigraphy of the Rotliegend Group. After Van Ojik et al. (Reference Van Ojik, Böhm, Cremer, Geluk, De Jong, Mijnlief, Nio, Grötsch and Gaupp2012).
The thickness of the Upper Rotliegend in the area of the Groningen field varies between just over 50m in the south and almost 300m in the north of the field. Further north, the thickness increases further to more than 700m in the centre of the Southern Permian Basin. Until not too long ago it was a matter of debate whether the overall thinning to the south is due to a thinning of all stratigraphic intervals or to onlap. Based on sequence stratigraphic correlations and supported by improved 3D seismic data it is now clear that while there is thinning of stratigraphic intervals, the Rotliegend does onlap onto the Base Permian Unconformity (Van Ojik et al., Reference Van Ojik, Böhm, Cremer, Geluk, De Jong, Mijnlief, Nio, Grötsch and Gaupp2012; Visser, Reference Visser2012).
Depositional setting
Most publications on the Groningen field deal with the depositional setting and lateral variability within the reservoir sequence. In early reports, modern analogues from Oman and the UAE were used to interpret a desert dune origin for the main reservoir sands, with sediments derived from a source in the south and reworked by prevailing easterly winds (Stäuble and Milius, Reference Stäuble, Milius and Halbouty1970; Glennie, Reference Glennie1972; Glennie et al., Reference Glennie, Mudd and Nagtegaal1978). Van Adrichem Boogaert (Reference Van Adrichem Boogaert and Falke1976) published the first facies maps, showing fluvial channels flowing to the north through a sandy desert. In the years thereafter the detailed understanding of the depositional setting and facies distribution progressed only slowly, as this was not considered critical for the development of a field with such excellent reservoir quality. An internal Shell study by Chris Nicholls and co-workers in 1987 revisited core material from some 25 wells in the Groningen area. They described the cores following a lithofacies scheme based on combinations of dominant grain size and sedimentary structure. This lithofacies scheme with an associated interpretation in depositional sub-environments still forms the basis for describing the Rotliegend reservoir rocks, although terminology has changed slightly over time. Recently, a NAM study was carried out to review the core descriptions and depositional model with the objective of using facies information to constrain the reservoir rock property model (Visser et al., Reference Visser, Porter and Solano Viota2016).
The field-wide depositional setting with pebbly or conglomeratic lithofacies in the south and more clay-rich lithofacies in the north clearly represents a large-scale proximal-to-distal trend. This trend can be traced further to the south where conglomerates become more abundant in the area of the Annerveen field, and to the north where sandstone intervals become increasingly thinner or pinch out completely and only claystone and salts were deposited.
The Groningen field area is envisaged as a low-relief depositional plain connecting these two extremes. Sand was introduced to the plain both by fluvial streams coming from a source area in the south and by winds with a strong easterly component. The sedimentary characteristics point to a variety of depositional processes including transport by fluvial streams, suspension settling in ponded areas, desiccation and subsequent transport as clay clasts, wind ripple and dune sedimentation, adhesion of wind-blown sand onto damp surfaces, and repeated precipitation and dissolution of salt minerals.
No well-defined fluvial fairways or aeolian dune fields have been observed in the Groningen field area, but a broad pattern of east–west-trending facies belts is obvious (Van Adrichem Boogaert, Reference Van Adrichem Boogaert and Falke1976). From south to north, these belts grade from pebbly fluvial to sandy fluvial to mixed fluvial–aeolian to aeolian sand flat to lake margin. The transitions from one belt into the other are ill-defined and gradual. No clear indications have been found for basal scouring of river channels. This suggests that periods of high fluvial run-off had a sheetflood-like character over an extensive flat area. The almost complete absence of cross-bedded aeolian sands indicates that migrating dunes in the Groningen area had a very low preservation potential. Yet, the importance of wind transport is evidenced by the abundance of dry to damp sandflat deposits, where at best toe sets of dunes have been preserved. Any depositional relief that was created by migrating dunes during dry periods apparently levelled out rapidly. The result is a flat depositional plain where wind and running water continuously redistributed the available sediment. Individual beds preserved in the rock record display the characteristics of the last depositional process before burial, but may also have inherited characteristics from earlier processes (Visser et al., Reference Visser, Porter and Solano Viota2016).
Thin heterolithic intervals separating sand-dominated sequences consist of finer-grained deposits and represent periods of generally low hydrodynamic energy. Larger-scale climatic variations, i.e. alternating periods of dryer and wetter conditions, are represented in the rock record by alternating intervals of lithofacies representing dryer and wetter conditions.
The above observations and interpretations from the Groningen field are compatible with the larger-scale depositional context of the Rotliegend. The Southern Permian Basin is thought to have been an underfilled and slowly subsiding sedimentary basin. Sediment supply was low compared to the available accommodation space, and depositional processes were constantly redistributing the available sediment. The Groningen area must have been a subtle relative high that was frequently subjected to wind erosion. The Lauwerszee Trough area west of the Groningen field was lower-lying and acted as a catchment area by virtue of the prevailing easterly winds, with more aeolian intercalations. This suggests that local physiographic conditions exerted a primary control on the distribution of lithofacies throughout the extent of the Southern Permian Basin.
Reservoir quality and depositional setting
The reservoir quality of Rotliegend sediments from the Groningen field has been measured on thousands of core plugs. Porosity typically ranges from 10 to 24% and permeability from 1 to 1000mD, but lower and higher values have also been measured (Visser, Reference Visser2012). Attempts have been made to establish relationships between reservoir quality and sedimentary characteristics such as facies or grain size. Only very broad trends could be established: sandstones have the best reservoir quality, mudstones the poorest, and conglomerates intermediate.
Approximately 80% of the Slochteren Sandstone consists of sandstone facies. Within these sandstones it has been attempted to distinguish between purely aeolian (dry sandflat and dune) and undifferentiated (fluvial and mixed fluvial–aeolian) facies. The purely aeolian sands do have better average reservoir quality, but the overlap of porosity and permeability with other sandstones is significant. The purely aeolian sandstones only comprise 1.5% of the sandstone facies (Visser et al., Reference Visser, Porter and Solano Viota2016). This virtual absence of dune deposits can be explained by the general depositional setting described above. Repeated erosion and redeposition of sediment lead to a high degree of sorting. Lithofacies may differ in terms of sedimentary structures, but not so much in dominant grain size and sorting. In cases where small amounts of finer- and coarser-grained sediment are intermixed, this only has a limited effect on the average porosity of the interval.
Nevertheless, broad areal trends have been observed. The central part of the field clearly shows the highest porosity and permeability values. Reservoir quality decreases to the south because of increasing percentages of conglomeratic facies, and to the north because of increasing percentages of mudstone interbedded and intermixed with the sandstones. This reflects the general proximal-to-distal trend. A good illustration of the distribution of reservoir quality in the Groningen field is provided by the net hydrocarbon column height map of Figure 5 (provided by NAM). Maxima in this map exceed 30m in the central part. Given the gas expansion factor of c.230, this is equivalent to a gas column of 7km at surface conditions!

Fig. 5. Net hydrocarbon height map of the Groningen field. (Courtesy NAM.)
Diagenesis does not seem to have seriously impacted the Groningen reservoir rocks. Many other Rotliegend fields in the Southern Permian Basin are affected. In particular, fibrous illite can play a devastating role. Groningen has been protected from extensive illite formation, possibly because of its modest maximum burial depth, but also early gas fill may have prevented extensive diagenetic processes from taking place. Recent petrographic studies have shown that illitic and chloritic clay coatings did develop in the north of the field (Gaupp & Okkerman, Reference Gaupp, Okkerman, Grötsch and Gaupp2012; Visser, Reference Visser2016). These may well have an effect on reservoir quality because they can occlude pore throats and therefore reduce permeability. The impact of this effect has not been studied yet.
Structural history and faults
Early mapping of the field in the 1960s was based on a 2D grid of seismic, and was clearly hampered by the data quality achievable then. It is not straightforward to obtain good data quality below the salt of the Zechstein Formation (Fig. 6). Seismic imaging was challenged in particular below salt domes and salt walls above the eastern and western boundaries of the field. Nevertheless, the general shape and fault directions were recognised and could be mapped. Since the late 1980s the field has been fully covered by 3D data with several cycles of reprocessing that have improved the quality of the data considerably. Surprisingly sharp and crisp seismic imaging has been achieved, considering that the field is below the high-velocity Zechstein salt, and uncertainty in seismic depth is small. Seismic impedance contrast between the anhydrites and carbonates of the basal Zechstein and the underlying ‘softer’ Rotliegend appears as a sharp reflector that can readily be traced throughout the Southern Permian Basin.

Fig. 6. Comparison of an early and recent structural map of the Groningen gas field. The map on the left is from Stäuble & Milius (Reference Stäuble, Milius and Halbouty1970); the map on the right is a recent map, courtesy NAM.
The Groningen field is affected by many normal (extensional) faults that can well be mapped on seismic. The main fault trend affecting the field is NNW–SSE. Other fault trends run E–W and N–S. The highest density of faults is in the southern sector of the field. The faults must date from one or more of the several tectonic phases that affected the area. During all these tectonic phases older pre-existing faults were reactivated. As later stress directions were not parallel to previous ones, oblique movement along faults is common. With the thick Zechstein salt effectively decoupling sub-salt faults from supra-salt faults (see Fig. 7), unequivocal dating of the faults at Rotliegend level is not possible. Dating of the faulting can only be based on circumstantial evidence. Generally, though, it seems to be accepted that most of the faulting occurred during the main Mesozoic tectonic event affecting the Dutch subsurface, i.e. the Late Jurassic to Early Cretaceous rifting phase.

Fig. 7. North–south seismic line through the Groningen field. Most faults at the level of the Rotliegend (indicated in yellow) are extensional. The overlying Zechstein salt acts as a detachment level, and supra-salt structuration is notably different from sub-salt structuration. Blue dashed line indicates approximate position of gas–water contact.
The main phases of tectonic activity that affected the Groningen area are described below (see also Fig. 8):
-
• Late Carboniferous uplift and folding: Prior to deposition of the Rotliegend, faulting associated with a phase of uplift and folding resulted in offsets of the Westphalian sequences subcropping below the Base Permian unconformity.
-
• Permian rifting: Extension during deposition of the Lower Rotliegend created narrow syn-depositional grabens in Germany, and possibly also affected the Ems Graben just east of the Groningen field. In the Groningen field, though, similar syn-depositional faulting cannot easily be demonstrated for the Upper Rotliegend. Even with careful seismic interpretation it is not possible to detect variations in the thickness of the Rotliegend across faults. However, Grötsch et al. (Reference Grötsch, Sluijk, Van Ojik, De Keijzer, Graaf, Steenbrink, Grötsch and Gaupp2012) did observe that facies trends seem to subtly align to fault trends, suggesting that minor (sub-seismic) faulting may have occurred.
-
• Triassic extension: During the Triassic, the general east–west extension, which would eventually lead to the break-up of Pangaea, started to affect the southern North Sea (e.g. Horn Graben and probably also the Dutch central graben) and triggered major halokinesis of Zechstein salt. Further south, however, it is very difficult to document syn-depositional Triassic faulting. However, it can be seen that halokinesis of the Zechstein salt above the flanks of the Groningen field increased during the Middle to Late Triassic, with some of the salt swells becoming piercing salt walls. Active faulting probably triggered this.
-
• Late Jurassic to Early Cretaceous rifting: This was the strongest tectonic phase affecting the southern North Sea during the Mesozoic, and was related to the opening of the North Atlantic. It formed the main rift basins of the Southern North Sea area, including the Dutch Central Graben, Central and West Netherlands Basins and the Lower Saxony Basin, and also triggered another phase of strong halokinesis. Erosion due to strong uplift during this phase removed a thick sequence of Lower and Middle Jurassic and Upper Triassic units. All in all, it is most likely that, during this phase, faults at Rotliegend level were most active, and created the patchwork of fault blocks we now observe on seismic data.
-
• Late Cretaceous to Early Tertiary inversion: Several pulses of Alpine compression caused uplift of the Late Jurassic to Early Cretaceous rift basins, with reverse reactivation of older faults. Outside the rift basins, inversion had much less effect. Nevertheless, minor reverse fault reactivation can be observed on some faults and resulted in narrow pop-up blocks in NW–SE to more W–E striking faults (Fig. 9; Grötsch et al., Reference Grötsch, Sluijk, Van Ojik, De Keijzer, Graaf, Steenbrink, Grötsch and Gaupp2012). This reactivation must have occurred under mainly north–south compression during the Late Cretaceous to Early Tertiary Alpine inversion phases, which is the only compressional event that affected the area of the southern North Sea. Thinning of the upper part of the Palaeogene over the Groningen field indicates that inversion during the Tertiary also affected the Groningen field area.
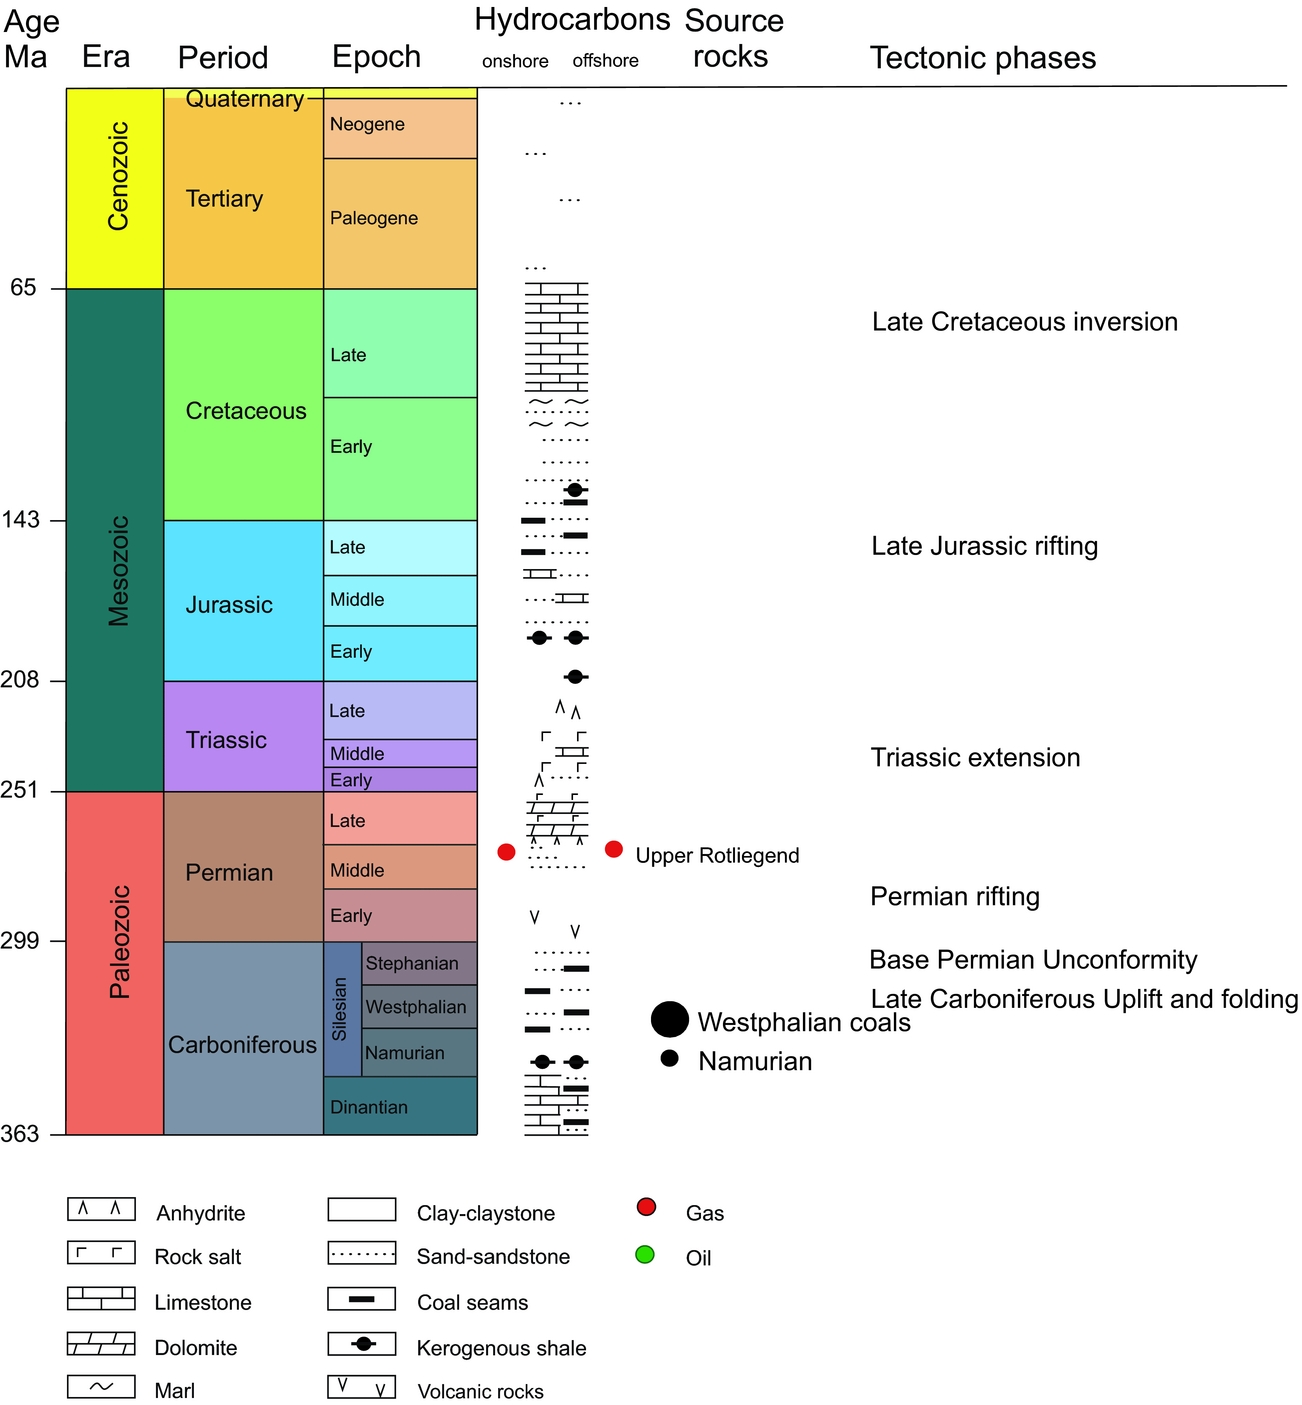
Fig. 8. Stratigraphic column illustrating the Westphalian petroleum system and indicating the nature and timing of the main tectonic phases.

Fig. 9. Two detail seismic sections showing minor reverse faults and narrow pop-up structures. Normal (extensional) faults have not been highlighted on these sections.
Because of the presence of the Zechstein salt, which changed in thickness over geological time due to movement of salt into the salt domes and salt walls above the eastern and western boundaries of the field, it is not easy to define when exactly the closure of the Groningen field first formed. As the salt walls seem to have started developing already during the Triassic, it seems reasonable to conclude that an initial closed structure may have started forming rather early: during the Late Triassic or the Jurassic. The Early Tertiary inversion will have resulted in a more pronounced closure.
Charge and gas composition
Gas in the Groningen field stands out for its composition with c.14% nitrogen. Most of the gas has been charged from the Westphalian Coal Measures that are widely present in the area below and around the field (De Jager & Geluk, Reference De Jager, Geluk, Wong, Batjes and De Jager2007; Grötsch et al., Reference Grötsch, Sluijk, Van Ojik, De Keijzer, Graaf, Steenbrink, Grötsch and Gaupp2012). Additional contributions may have been derived from basal Namurian organic-rich shales. The nitrogen is concluded to come from deeply buried strongly heated mainly Namurian-age shales (based on Scholten, Reference Scholten1991; De Jager & Geluk, Reference De Jager, Geluk, Wong, Batjes and De Jager2007; Verweij, Reference Verweij2008). The charge history is rather complex, owing to the complex structural history, with heating events at the end of the Carboniferous and during the Late Jurassic – Early Cretaceous rifting, and with a number of unconformities with varying, and often quite difficult-to-estimate, amounts of missing section. Nevertheless, from detailed basin modelling it has been concluded that a particularly strong phase of gas charge must have occurred during Late Jurassic – Early Cretaceous rifting associated with high heatflow (De Jager & Geluk, Reference De Jager, Geluk, Wong, Batjes and De Jager2007; Grötsch et al., Reference Grötsch, Sluijk, Van Ojik, De Keijzer, Graaf, Steenbrink, Grötsch and Gaupp2012). This phase was probably associated with nitrogen charge from deeper buried Namurian shales. Uplift and erosion followed by declining heatflow must have arrested gas generation and expulsion from these source rocks. Subsequent burial restarted generation under a lower geothermal gradient. This means that first the Uppermost Carboniferous sequences reached maturity levels greater than before, and these then generated low-nitrogen gas. The main kitchen areas for this late phase of gas charge were to the northwest and south of the field. Lateral migration of this low-nitrogen gas from there reached the Lauwerszee Trough area and the flanks of the Groningen field, thereby diluting the nitrogen content in the field to its current composition. Particularly in the Lauwerszee Trough clear trends of increasing nitrogen levels on migration routes away from the late kitchen areas can be seen.
Fault blocks surrounding the Groningen gas field show different compositions, with nitrogen content lower, but in cases also higher, than in Groningen. This suggests that the timing of phases of gas charge relative to phases of tectonic activity determines whether individual blocks are (partially) charged or bypassed. This complex interplay is not fully unravelled yet.
Sealing faults and compartmentalisation
Apart from the above-discussed peripheral fault blocks, gas compositions are constant over the entire Groningen field. Initial pressures are fairly constant across the field also, though small variations are observed as a result of the temperature trend described above. Dynamically, large parts are in good pressure communication, suggesting that most faults do not form barriers to gas flow (www.nam.nl). Some of the peripheral blocks in the southwest show more signs of compartmentalisation. Measurements have shown that with continued production and depletion of the Groningen field, pressure in the southwest was lagging behind some 60bar. This led to the installation of the Eemskanaal production cluster in that area, and later in a dedicated well to better drain the peripheral Harkstede block.
Factors contributing to the sealing capacity of faults include: fault throw, cataclasis and clay smearing, size of juxtaposition window and fault orientation relative to present-day maximum stress direction. Ketterman et al. (Reference Ketterman, Abe, Raith, De Jager and Urai2017) conclude from sandbox and numerical modelling that Zechstein salt may have flowed downward into opening fractures and faults, possibly contributing to local fault sealing. It has been attempted to assess the role of fault type (normal versus inverse, dip-slip versus strike-slip), and of timing and fault reactivation history, but no relation was found. An additional complexity may be that the detailed geometry and internal make-up of a fault is probably very complex and cannot be resolved on seismic. Fault slivers of centimetre-to-metre scale cannot be imaged, but may play an essential role in the sealing or non-sealing nature of the faults. What can be seen on seismic cross-sections is that quite regularly faults bifurcate close below the base of the Zechstein salt. When these faults are reversely reactivated they may give rise to narrow transpressional pop-up blocks or transtensional so-called ‘skinny grabens’. The latter have been observed in the Lauwerszee Trough, mainly on E–W-trending faults. Similar features do also occur in the Groningen field, but probably do not play a major role. Only a few pop-ups have a significant throw leading to Rotliegend-to-Zechstein juxtaposition. These are potential infill targets where less depletion may be expected. However, their size is very small on the scale of the Groningen field and currently there is no business driver for drilling these structures.
Pressure history
Initial reservoir pressures of 346bar (at reference depth of 2875m) were hydrostatic and virtually constant across the field. The Groningen field is produced primarily under gas expansion drive (Burkitov et al., Reference Burkitov, Van Oeveren and Valvatne2016), which has led to a very significant pressure reduction. Extensive aquifers are connected to the field, which could possibly provide some pressure support. In addition, volume reduction as a result of compaction also gives minor pressure support. In the first decade of production, most gas was produced from clusters in the southern half of the field, leading to an imbalance in pressures, with most pressure reduction in the south. After drilling of the northern clusters in the 1970s, production from the northern sectors of the field was preferred to reduce these imbalances. Since 2014, production caps have been imposed on some of the northern clusters, which have led again to an increase in the imbalance. Reservoir pressures in 2015 mainly range from some 65bar in the south to 85–90bar in the north. The highest pressures are currently measured in the southwestern periphery.
The GWC has been stationary for large parts of the field, but has gone up in areas with better connection to aquifers. The impact of water ingress from the aquifers on the depletion of the field is at present very modest (Burkitov et al., Reference Burkitov, Van Oeveren and Valvatne2016).
Conclusion and outlook
The Groningen field must rank amongst the best-studied gas fields in the world. After drilling of some 350 wells, coring of 50 wells and after 55 years of production, the geology of the field is understood well enough to allow for an efficient development strategy. However, despite the fact that more than c.75% of all gas initially in place has been produced, questions and uncertainties still remain.
The challenges for efficient and responsible exploitation of the field are immense. Managing the risks associated with induced seismicity requires an ever more detailed knowledge of the subsurface of Groningen. The same holds for the efficient recovery of the remaining gas when continued depletion is likely to reveal more and more complexity in reservoir architecture and dynamic behaviour. This forms a major challenge for the geosciences community within and outside NAM. Data acquisition campaigns, research programmes and state-of-the-art modelling approaches will lead to more answers to urgent questions.
Acknowledgements
The authors would like to thank generations of earth scientists, too numerous to mention individually, who have contributed to the current state of understanding of the geology of the Groningen field. The paper is published with permission of the Nederlandse Aardolie Maatschappij B.V. (NAM). We are grateful to Mark Geluk and an anonymous peer reviewer for their constructive comments, and again to Mark Geluk for also providing Figures 1 and 8 of this publication.


 Open access