


The food and drink we consume is now the biggest cause of death and ill health, owing to the excessive amounts of salt, saturated fat and sugars in our diet( Reference Lim, Vos and Flaxman 1 , Reference Forouzanfar, Alexander and Anderson 2 ). A diet high in salt has long been shown to increase blood pressure and consequently put one at increased risk of CVD( Reference He and MacGregor 3 , Reference He and MacGregor 4 ). Populations around the world are consuming salt in quantities that far exceed physiological requirements( Reference Webster, Dunford and Hawkes 5 ). As such, the WHO has recommended salt reduction as one of the top three priority actions to tackle the non-communicable disease crisis( Reference Beaglehole and Bonita 6 ), with a global aim to limit daily salt intake by at least 30 % towards a target of less than 5 g/d, by 2025( 7 ).
Obesity( 8 , 9 ), type 2 diabetes( 10 , 11 ) and dental caries( 12 – 15 ) are also major public health problems in the UK, with significant costs to the health service( 16 ). It is now recognised that excessive free sugars consumption is associated with these conditions( Reference Maki and Phillips 17 – 21 ). ‘Free sugars’ includes all monosaccharides and disaccharides added to foods by the manufacturer, cook or consumer, plus sugars naturally present in honey, syrups and unsweetened fruit juices. Under this definition, lactose (milk sugar) when naturally present in milk and milk products and sugars contained within the cellular structure of foods (particularly fruits and vegetables) are excluded.
In July 2015, the Scientific Advisory Committee on Nutrition recommended the average intake of free sugars across the UK population should not exceed 5 % of total energy intake (19 g/d for children aged 4–6 years, 24 g/d for children aged 7–10 years and 30 g/d for those aged 11 years or above, including adults). This is in line with the WHO’s new guidelines on free sugars intake( Reference Te Morenga, Mallard and Mann 19 , 22 ).
According to the latest figures from the National Diet and Nutrition Survey, current average intakes of free sugars exceed recommendations in all age groups( 23 ), with an average sugars intake of 59·0 g/d among 19–64-year-olds, equivalent to 987 kJ/d (236 kcal/d) and 12·1 % of total energy intake. Children have a higher sugars intake; the average intake was 60·3 and 74·2 g/d in 4–10- and 11–18-year-olds, respectively. These figures are likely to be an underestimate of how much free sugars is consumed( Reference Rennie, Jebb and Wright 24 ) due to a high prevalence of under-reporting in this survey( Reference Hebert, Ebbeling and Matthews 25 – Reference Archer, Hand and Blair 28 ).
The main sources of salt and free sugars in our diet are manufactured foods( 21 , 23 , Reference James, Ralph and Sanchezcastillo 29 – Reference He, Brinsden and MacGregor 31 ). With this in mind, the most cost-effective strategy to improve public health would be for manufacturers to gradually reduce levels of salt and free sugars in their foods through reformulation efforts. The UK was one of the first countries to develop a voluntary salt reduction strategy in 2003, with a primary focus on reformulation. To date, significant progress has been made by many food manufacturers and retailers in the UK, with salt content being reduced across the board, including by up to 25 % in pasta sauces( Reference Wyness, Butriss and Stanner 32 ) and 20 % in bread( Reference Brinsden, He and Jenner 33 ). The average salt intake in the UK population is decreasing steadily in parallel, with intake currently estimated at 8·1 g/d( 23 ), one of the lowest known accurate figures of any developed country( Reference Webster, Dunford and Hawkes 5 ). This represents a 15 % reduction from 2003( Reference Henderson, Irving and Gregory 34 ) and was accompanied by a fall in population blood pressure and mortality from stroke and IHD( Reference He, Pombo-Rodrigues and MacGregor 35 ). Nevertheless, average salt intake in the UK continues to exceed the maximum recommended limit of 6 g/d set by the UK Government, with greater efforts needed across the board. With increasing evidence now linking increased intake of free sugars to ill health, a similar strategy must be explored to reduce the amount of added free sugars in the diet.
Breakfast cereals were included within the approximately eighty categories of food targeted for reformulation. Breakfast is widely recommended as part of a healthy diet( Reference De La Hunty and Ashwell 36 , Reference Szajewska and Ruszczynski 37 ), with breakfast cereals in particular being a popular breakfast choice especially for children, due to its variety and ease( Reference Gibson and Gunn 38 ). A study looking at breakfast consumption in a UK population sample( Reference McKevith and Jarzebowska 39 ) showed those who ate breakfast cereals were associated with a significantly better macronutrient and micronutrient composition, suggesting that cereals should be encouraged as part of a healthy balanced diet( Reference Gibson and Gunn 38 ). However, with that said, the majority of breakfast cereals contribute to salt and sugars intakes in all groups of the population. Cereals and cereal products are the main contributor of salt in children’s diets, with breakfast cereals alone accounting for 4, 3 and 2 % of the salt intake in children (4–10 years), teenagers (11–18 years) and adults (18–64 years), respectively( 23 ). Cereals and cereal products are also the second main contributor of free sugars in children’s diets, with breakfast cereals accounting for 8, 7 and 6 % of the free sugars intake in children (4–10 years), teenagers (11–18 years) and adults (18–64 years), respectively( 23 ). In 2015, retail sales volume reached 520 500 tonnes, of which 104 100 tonnes were children’s breakfast cereals, a significant proportion of total sales( 40 ).
Despite this, very little has been documented on the salt or sugars content of breakfast cereals in the UK. Therefore the present research was conducted to: (i) evaluate the salt and sugars content listed on the labels of breakfast cereal products sold in the UK since 2004 (for salt) and 1992 (for sugars); (ii) compare the salt and sugar content of breakfast cereals over the years; (iii) report the variability of both salt and sugars within the different categories of breakfast cereal; and (iv) assess their levels in relation to the salt reduction targets and the UK’s new daily recommendation for free sugars intake.
Methods
Data collection
The salt and sugars content of breakfast cereals was assessed in five separate surveys carried out in 2004 (salt only), 2006, 2009, 2012 and 2015. The survey data were obtained from a number of different sources: Consensus Action on Salt and Health (CASH) carried out surveys in 2004( 41 ) and 2015; and the consumer group Which? carried out surveys in 2006( 42 ), 2009( 43 ) and 2012( 44 ). In all the surveys, data were collected from product packaging and the nutrition information panels. The surveys carried out in 2004 and 2015 were designed as a comprehensive survey of all breakfast cereals available in a snapshot in time, using one large outlet for each of the main UK retailers. The 2012 survey carried out by Which? consisted of top-selling branded breakfast cereals and their own-brand equivalents, while the 2009 survey by Which? was based on market share at the time. While not comprehensive (i.e. did not look at all available breakfast cereals in all major supermarkets at that moment in time), the data for 2009 and 2012 are based on popular products sold at the time, with a mixture of both branded and supermarket own-brand products, so the data are likely an accurate reflection of the situation at that point in time. The survey from 2006 was a more comprehensive survey from Which? looking at a larger number of popular breakfast cereals across all major retailers in the UK. The sugars content data from 1992 were obtained from a booklet published in 1992 by Octavo called A–Z of Shopping; Guide to Good Health. What’s in your shopping basket? ( 45 ). For each breakfast cereal, the data included the company name, product name, salt per 100 g and sugars per 100g. Data obtained from CASH surveys were double checked after entry, and a further 5 % of entries were checked against the original source in a random selection of products.
Under EU labelling legislation, nutritional information for products where a nutrient is negligible is allowed to be labelled as ‘trace’ or provided with ‘<’. In these circumstances, where the salt content of a breakfast cereal was displayed as ‘trace’, this was replaced with 0·0. Similarly where the salt content was <0·01, this was replaced with 0·01, <0·1 was replaced with 0·1, and <0·25 was replaced with 0·25( 46 ).
Inclusion/exclusion criteria
Nutritional information of breakfast cereals was collected from each of the major UK supermarkets operating at that time: Aldi (supermarket not operating prior to 2012), Asda, Iceland (data available only for 2004), Kwik Save (data available for only 2004), Lidl, Marks and Spencer, Morrisons, The Co-operative, Tesco, Safeway (data available only for 2004), Sainsbury’s, Somerfield (data available only for 2004) and Waitrose, to represent the levels of sugars and salt in breakfast cereals in the UK. Packaged breakfast cereals with labelled salt and/or sugars information were included. As the study focus is on product reformulation, plain oats and muesli with no added salt and/or sugar were excluded. Some products were also excluded because they did not fit into the proposed categories. Table 1 shows the details about the products excluded and the reasons for exclusion.
Table 1 Products excluded from the evaluation, with justification

Product categories
Products were categorised into the categories described in Table 2. The data were also categorised separately into supermarket own brand and branded.
Table 2 Description and examples of breakfast cereal categories
Statistical analysis
Data are reported as mean, standard deviation and range, as indicated. In all tests carried out, significance was deemed at P<0·05. All data were analysed using the statistical software package IBM SPSS Statistics Version 22.0.
Comparison among products within each year
The independent-samples t test was used to compare the levels of salt and sugars between supermarket own-brand and branded products.
Comparison of the same products over the years
For the purpose of this comparison, only the products with data available in all five surveys were included in the analysis. Because the sample size was small, we used a non-parametric test (i.e. Friedman’s test) to examine whether there was a significant change in the salt and the sugars content of breakfast cereals over the years.
Targets
The total number of products and percentage that met the Department of Health’s 2017 average salt target( 47 ) for breakfast cereals (≤0·59 g/100 g) were calculated. As targets for sugars have not yet been set, we have compared the sugars (2015) content with the UK’s new recommendation for free sugars intake for children aged 4–6 years (19 g/d), 7–10 years (24 g/d) and above 11 years and adults (30 g/d).
Results
Salt
A total of 295 (2004), 246 (2006), ninety-four (2009), forty-nine (2012) and 270 (2015) products met the inclusion criteria and were included in the analysis (Table 3). Table 3 shows the levels of salt in breakfast cereals for all five surveys. Across all years, the salt content varied between different types of breakfast cereals and within the same type of cereal. Differences in salt content were observed between branded cereals and supermarket own brands, but these differences were not statistically significant for all five years; 2004 (P=0·852), 2006 (P=0·587), 2009 (P=0·113), 2012 (P=0·346), 2015 (P=0·330). Flakes with additions were among those with the highest salt levels per 100 g across four surveys; in 2004 (1·31 (sd 0·41) g), 2006 (1·36 (sd 0·37) g), 2009 (0·80 (sd 0·47) g) and 2015 (0·81 (sd 0·17) g). Cornflakes were also among those with the highest salt levels per 100 g across all five surveys; in 2004 (2·28 (sd 0·24) g), 2006 (1·77 (sd 0·31) g), 2009 (1·21 (sd 0·51) g), 2012 (1·03 (sd 0·35) g) and 2015 (0·80 (sd 0·25) g). In 2015 the average salt level per 100 g for all breakfast cereals was 0·46 (sd 0·34) g.
Table 3 Average salt content in breakfast cereals in the UK in each year (g salt/100 g)

n/a, not applicable.
Figure 1 shows the salt content in each category of breakfast cereal per 100 g in 2015. There was a large variation in salt content between different categories and within the same type of category, ranging from 0·00 to 1·25 g/100 g. On average, flakes with additions (0·81 g) contained the most salt per 100 g, followed by cornflakes (0·80 g) and wheat, corn, rice and oat flakes, e.g. Special K style (0·74 g), with the lowest being granola and muesli (0·05 and 0·11 g/100 g, respectively). Overall, a gradual reduction in the salt content of breakfast cereals can be observed over time, with an average salt content of 0·96 g/100 g in 2004 down to 0·46 g/100 g in 2015. This represents an average reduction of 52 %.
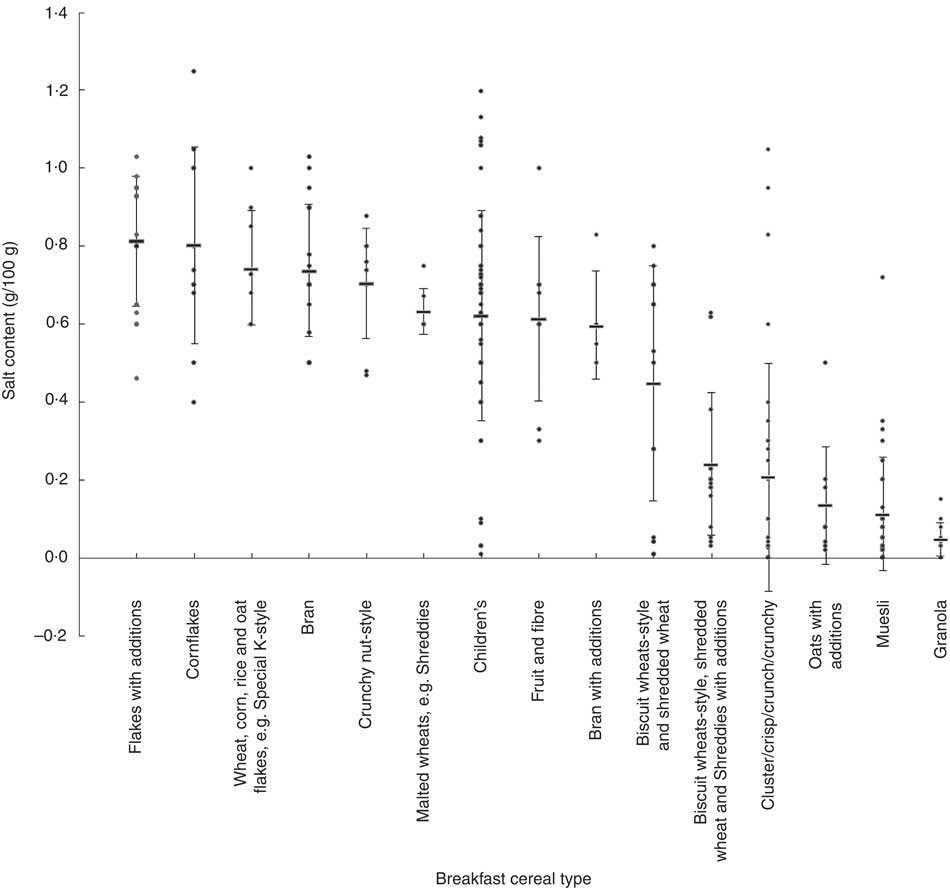
Fig. 1 Salt content in different types of breakfast cereal (g/100 g) in the UK, 2015. Values are individual products within each category (circle) with their mean (rectangle) and standard errors represented by vertical bars
Within the data, there were twenty-two products from seven different companies (four own brand and three branded) that were surveyed repeatedly over the five years (Fig. 2). Ten products were supermarket own-brand breakfast cereals and twelve were branded. The majority of the products were children’s cereals (n 6) and cornflakes (n 5). The average salt level for these twenty-two products was 1·57 (sd 0·59) g/100 g in 2004, 1·38 (sd 0·52) g/100 g in 2006, 1·03 (sd 0·41) g/100 g in 2009, 0·86 (sd 0·28) g/100 g in 2012 and 0·83 (sd 0·27) g/100 g in 2015. This represents a reduction of 47 % from 2004 to 2015 (P<0·001 for trend). Note that these averages are slightly different from those when all products were included in each year and this trend analysis reflects reductions made in the same products rather than the overall products available.
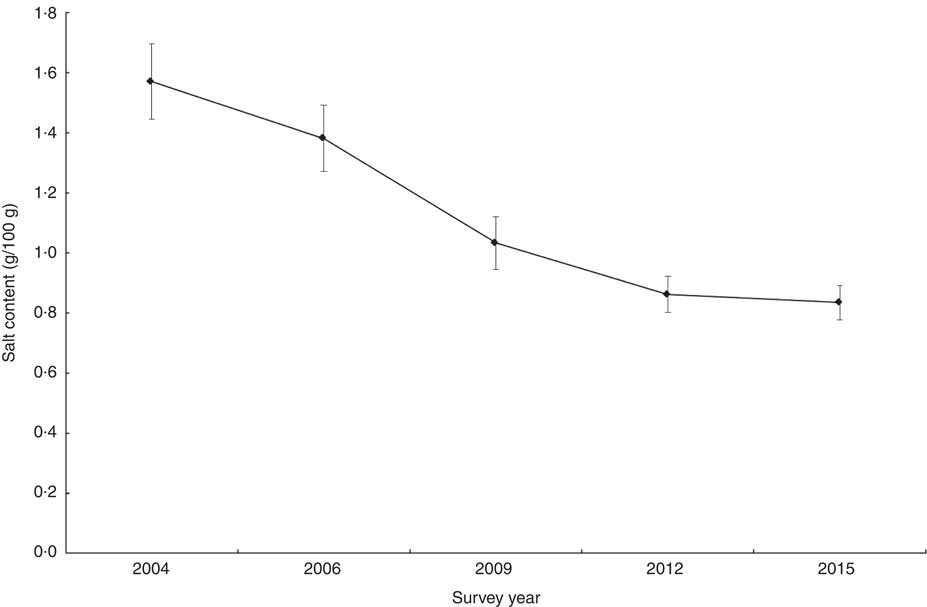
Fig. 2 Salt content in breakfast cereals (g/100 g) measured repeatedly over five surveys in the UK, 2004–2015. Values are means with their standard errors represented by vertical bars
2017 salt target
The Department of Health’s average salt target for breakfast cereals, as part of its Responsibility Deal’s 2017 Salt Pledge, is <0·59 g/100 g. Our analysis showed 53 % (143/270) of products surveyed in 2015 met this target.
Sugars
A total of ninety-three (1992), 246 (2006), ninety-four (2009), forty-nine (2012) and 270 (2015) products met the inclusion criteria and were included in the analysis (Table 4). Table 4 shows the levels of sugars in breakfast cereals for all five surveys. The sugars level was slightly higher in branded compared with supermarket own-brand products, but this difference was not statistically significant for all surveys; 1992 (P=0·062), 2006 (P=0·374), 2009 (P=0·113), 2012 (P=0·697) and 2015 (P=0·239).
Table 4 Average sugars content in breakfast cereals in the UK in each year (g sugars/100 g)

n/a, not applicable.
Crunchy nut-style were among those with highest sugars levels per 100 g for all five years in 1992 (32·22 (sd 2·55) g), 2006 (33·77 (sd 0·69) g), 2009 (33·73 (sd 0·67) g), 2012 (32·42 (sd 4·39) g) and 2015 (32·22 (sd 4·95) g), followed by bran with additions and children’s cereals (Table 4).
Overall, in 2015, the average sugars level per 100 g was 20·83 (sd 8·68) g with a range of 0·60–40·00 g/100 g for all cereals. Figure 3 shows the sugars content in each category of breakfast cereal per 100 g in 2015. There was a large variation in sugars content between different categories and within the same type of category. On average, biscuit wheats-style and shredded wheat were among those with the lowest amount of sugars (3·37 (sd 1·86) g/100 g).
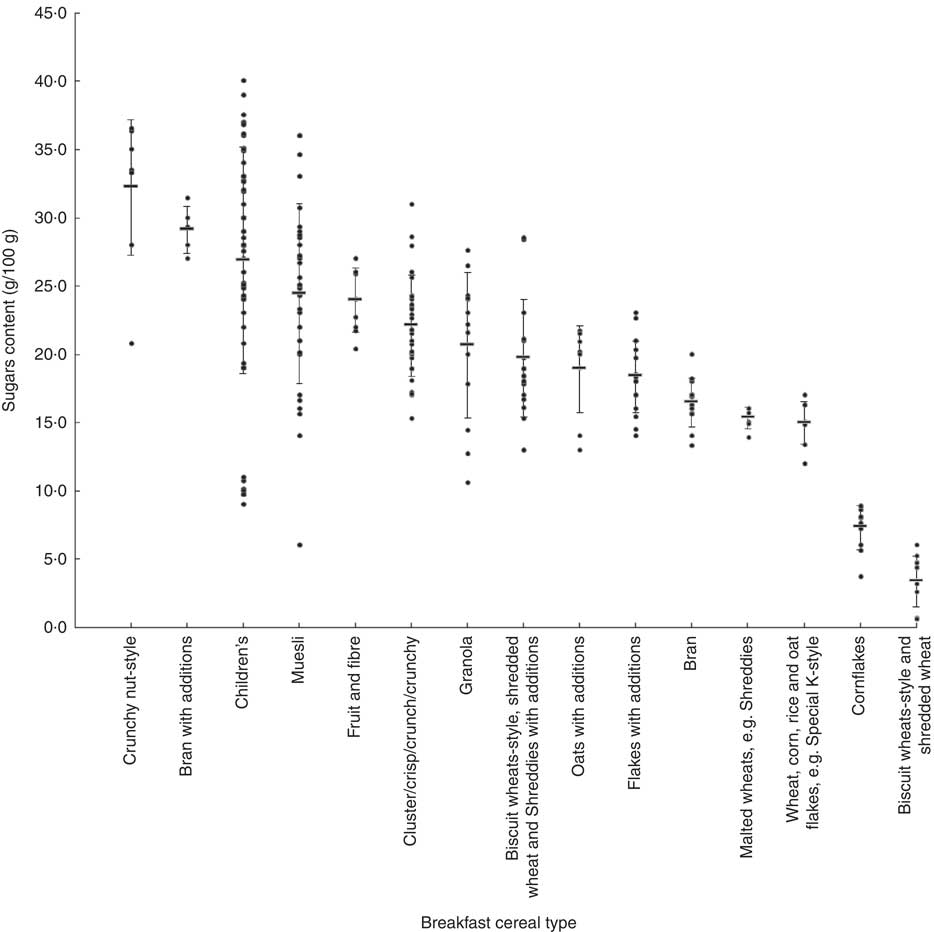
Fig. 3 Sugars content in different types of breakfast cereal (g/100 g) in the UK, 2015. Values are individual products within each category (circle) with their mean (rectangle) and standard errors represented by vertical bars
Figure 4 shows the average levels of sugars in breakfast cereals for all five years. However, within the data, there were fifteen products from five different companies (two own brand and three branded) that were surveyed repeatedly over the five years. Five products were supermarket own-brand breakfast cereals and ten were branded. The majority of the products were children’s cereals (n 7, 47 %). The average sugars level per 100 g for these fifteen products was 25·65 (sd 14·69) g in 1992, 23·81 (sd 13·14) g in 2006, 23·29 (sd 12·62) g in 2009, 23·35 (sd 12·70) g in 2012 and 22·45 (sd 12·58) g in 2015. This represents a reduction of 12 % from 1992 to 2015, but this difference was not statistically significant (P=0·170). Note that these averages are slightly different from those when all products were included in each year and this trend analysis reflects reductions made in the same products rather than the overall products available. This is not representative of the amount of reformulation done so far because the sample size is small.
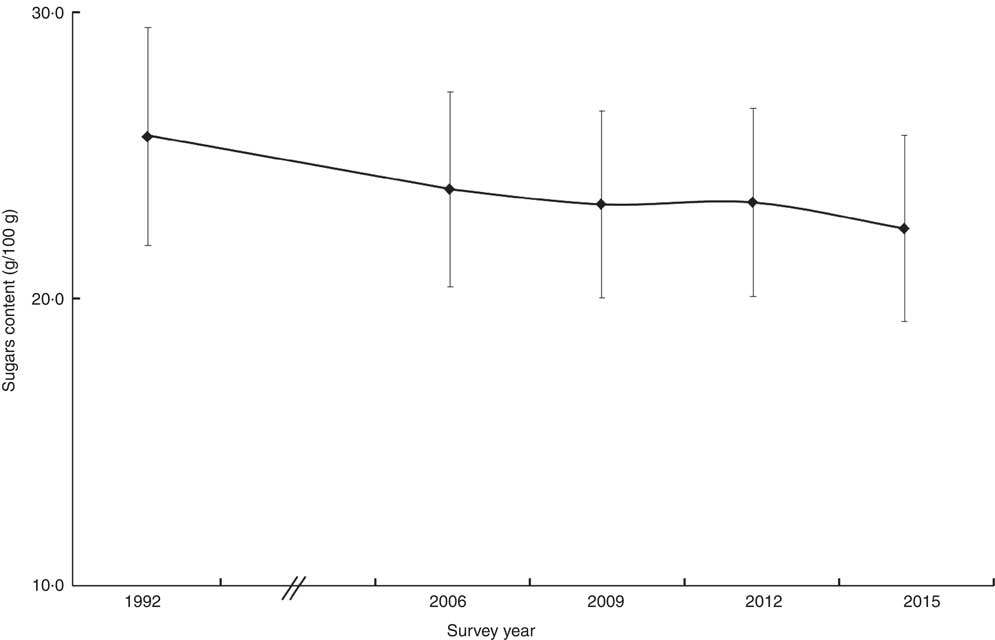
Fig. 4 Sugars content in breakfast cereals (g/100 g) measured repeatedly over five surveys in the UK, 1992–2015. Values are means with their standard errors represented by vertical bars
Comparing sugars content (2015) to the maximum daily recommendation for sugars intake
On average, a typical serving size (30 g) of breakfast cereal contained 6·25 (sd 2·60) g sugars, almost a quarter of an adult’s (30 g/d) and a third of a 4–6-year-old’s (19 g/d) maximum daily recommendation for free sugars intake in the UK.
Among the sixty-three children’s breakfast cereal products (sugars content 8·07 (sd 2·50) g/30 g), 79 % contained more than a third of a 4–6-year-old’s maximum daily recommendation for free sugars (19 g/d) per 30 g serving. Moreover, 58 % of the products contained more than a third of a 7–10-year-old’s maximum daily recommendation for free sugars intake (24 g/d).
Discussion
Salt; a success story
The UK has long been known as a world leader in salt reduction, using a well-thought-out and coherent plan developed by the Food Standards Agency and CASH. The salt reduction strategy, predominantly based on the setting of a robust set of targets for over eighty different food categories( 48 ), was brought about to promote the gradual reduction in the amount of salt added to processed foods so as to reduce UK population salt intakes to the recommended level of 6 g/d( 48 ). This work has now been incorporated as part of the Government’s Public Health Responsibility Salt Reduction Pledge, with the latest and more challenging targets set in 2014 with a deadline of 2017 to achieve them( Reference Webster, Dunford and Hawkes 5 , 47 , 49 ). As such, significant reductions in the salt content of foods have been made by many food manufacturers and retailers in the UK( Reference Wyness, Butriss and Stanner 32 , Reference Brinsden, He and Jenner 33 ), with corresponding decreases in population salt intakes( 23 ). The present paper adds to previous publications( Reference Wyness, Butriss and Stanner 32 , Reference Brinsden, He and Jenner 33 ) suggesting that a national target-based approach to reformulation can be a successful method for reducing the salt content in foods such as bread( Reference Brinsden, He and Jenner 33 ) and pasta sauces( Reference Wyness, Butriss and Stanner 32 ).
The repeated surveys of the same breakfast cereal products over time demonstrate that significant reductions have been made in the salt content of breakfast cereals. Further analysis of all the cereals surveyed in each survey shows that cereals contain on average 53 % less salt in 2015 than the cereals surveyed in 2004. The reductions that have been made since 2004 have gone unnoticed by the general public, with no impact on sales or consumer behaviour( 50 ). The supermarkets have historically been known to produce foods (supermarket own brand) with lower salt levels compared with their branded competitors( Reference Brinsden, He and Jenner 33 , Reference Hashem, He and Jenner 51 ); however, our survey highlights very little difference for breakfast cereals in 2015 (0·46 v. 0·49 g/100 g, P=0·330).
A large variation can be seen in the salt content of different breakfast cereals. The salt content of cornflakes, for example, ranges from 0·40 to 1·25 g/100 g, and in children’s cereals from 0·01 to 1·20 g/100 g (Table 3). The fact that cereals have been produced with lower levels of salt across all of the different cereal categories shows that such reductions can be achieved. Evidence suggests that where reductions in salt are made gradually over time, no reduction in consumer preference is reported( Reference Liem, Miremadi and Keast 52 ).
As such, the UK salt reduction programme has been hailed as one of ‘the most successful nutrition policies in the UK since the Second World War’ and is estimated to be saving approximately 9000 lives every year, resulting in major cost savings to the UK economy of over £1·5 billion per year( 53 ). Following its success, many other countries have developed similar programmes based on the UK’s model, with a reported thirty-eight countries now setting targets for salt in certain food categories, nine of which have introduced legislation( Reference Webster, Trieu and Dunford 54 , Reference Hashem, Pombo-Rodrigues and Capewell 55 ).
Can the same be said for sugar?
The repeated surveys of the same breakfast cereals over time demonstrate that minimal and insignificant reductions have been made in the sugars content. There continues to be a significant amount of sugars in breakfast cereals, particularly children’s breakfast cereals. The average sugars content in breakfast cereal products is 20·83 (sd 8·68) g/100 g in 2015. There is a large variation in sugars content between different types and within the same type of breakfast cereal. Among the sixty-three children’s breakfast cereal products (8·07 (sd 2·50) g/30 g), 79 % contain more than a third of a 4–6-year-old’s maximum daily recommendation for free sugars (19 g/d) per 30 g serving. Moreover, 58 % of the products contain more than a third of a 7–10-year-old’s maximum daily recommendation for free sugars intake (24 g/d).
Breakfast cereals also contribute to sugars intake in many other countries( Reference Grieger and Cobiac 56 – Reference Pestano, Yeshua and Houlihan 59 ), showing that high levels of sugars in breakfast cereals, particularly children’s breakfast cereals, is a global challenge. Many breakfast cereals are produced by multinational manufacturers, so gradually reducing the amount of sugars in their products sold internationally and across the board can have a significant impact on global health.
There is evidence that free sugars are an important contributor to obesity, type 2 diabetes and dental caries, contributing to huge health-care costs( 60 – Reference Diabetes 62 ). Since sweetened breakfast cereals can be highly palatable, it is plausible that overconsumption of palatable cereals may contribute to positive energy balance( Reference Shrapnel 63 ). Indeed, Harris et al. reported greater liking of the high-sugar cereals among children, who consumed almost twice the amount per eating occasion compared with those served the low-sugar cereals (61·3 v. 34·6 g)( Reference Harris, Schwartz and Ustjanauskas 64 ). However, children offered low-sugar cereals added more table sugar than those eating high-sugar cereals. This is likely to be due to children having a stronger sweet preference than adults and also being habituated to eating high-sugar cereals( Reference Mennella, Pepino and Reed 65 ). Nevertheless, gradual reduction in the amount of sugars will allow their taste preferences to adjust accordingly. Also, these poor practices can be discouraged by not giving children the option of adding sugar to their cereal. Instead, natural sweetness from fruit should be encouraged. Indeed the children in the low-sugar group were more likely to put fresh fruit on their breakfast cereal compared with the high-sugar cereal group (54 v. 8 %; P=0·01). Also, data suggest that exposure to foods during early development can effect food choices and preferences that persist throughout life( Reference Mennella 66 ). Therefore, reducing the sugars content of children’s cereals is of utmost importance in order to instil food preferences that are in line with dietary recommendations. There is therefore an urgent need to reduce the amount of free sugars in breakfast cereals, among other food and drink categories.
Breakfast cereals have the potential to improve health due to the whole grain and high fibre content that are associated with weight loss, reduced cardiovascular and diabetes risk( Reference Williams 67 , Reference Slavin 68 ). So reducing the free sugars content and increasing the fibre content can have huge health benefits.
Free sugars are claimed to be important in the flavour, texture, bulk and acceptability of breakfast cereals( 69 – Reference Sacchetti, Pittia and Biserni 72 ). However, with increasing attention around the sugars content, some studies have described possible ways of reducing the free sugars content of breakfast cereals( Reference Enwere 73 – Reference Green and Nowakowski 75 ) and increasing the fibre content( Reference Brennan 76 ), particularly in extruded products where the majority are now derived from flour components rather than being whole grain in nature( Reference Norfezah, Hardacre and Brennan 77 – Reference Dehghan-Shoar, Mandimika and Hardacre 79 ). Traditionally the majority of breakfast cereals were derived from whole-grain sources and were predominantly flaked from steamed grains (the steam making the grains pliable to be reformed by the flaking process)( Reference Brennan, Derbyshire and Tiwari 80 ). However, with the arrival of more flour separation techniques and refining processing, cereals have since been derived from mixtures of flour components rather than being whole grain in nature( Reference Brennan, Derbyshire and Tiwari 80 ). This has had an obvious impact on the composition of the raw material and hence the nutritional content of the product.
Reducing the free sugars content while increasing the fibre content allows the food industry to produce products from relatively inexpensive cereal-based ingredients that will be accepted by the consumer. There exists a great potential for the global food industry to manipulate the nutritional status of these products so as to offer the consumer potentially nutritious products, which can be appealing to children since use of extruders in the food industry allows blending of diverse ingredients into novel food structures( Reference Brennan, Derbyshire and Tiwari 80 ).
Reformulation is key
Given the progress made with the salt reduction programme in the UK, it has been proposed that free sugars can be reduced through a similar systematic, unobtrusive and gradual reformulation programme for manufacturers. This would be achieved by setting progressive targets for each food and drink category, which would allow for an incremental reduction of free sugars and provide a level playing field to industry, which is vital for a voluntary policy. Importantly, there would be no substitution with artificial sweeteners, so that the taste receptors would adjust, and, in solid foods, no addition of other calorific ingredients to make up for the reduction in free sugars content.
Limitations
The present study was based on salt and sugars content data provided on breakfast cereal packaging labels in store; hence we relied on the accuracy of the data provided on the label. It is assumed that manufacturers provided accurate and up-to-date information in line with EU regulations. Also some products contained added dried fruit. However, we could not identify from the label what percentage of total sugars came from the dried fruit in these products. Further studies should include salt and free sugars content determined through laboratory analysis to achieve a better understanding of the true salt, free sugars and breakdown of free sugars composition.
The different surveys across the different years generally include different products, meaning the like-with-like comparisons are very limited in size and scope. However, each of the surveys represented the breakfast cereals available in major supermarkets at that moment in time, and contained a variety of different categories, so can be comparable. Also, we were able to directly compare a number of the same products over the five different surveys which, albeit a small sample, provided a similar result to the overall picture.
When analysing data we did not capture the ingredients list; this means we are unable to ascertain if salt has been replaced with any other ingredients/additives in the breakfast cereals that came out lowest. Such data should be analysed in future surveys. Also we were unable to distinguish if sugars labelled on the packaging are all free sugars or if some are from milk, fruit and vegetables.
The surveys do not take into account sales, and so conclusions about public health impact are difficult to draw. However, the current study does look into the topic of product reformulation and suggests reformulation of products across a category is doable and has been successful, at least in terms of salt reduction.
Conclusion
Our study demonstrates that salt content in breakfast cereals has decreased by approximately 50 % over the past 10 years, owing to the successful salt reduction programme, particularly the target-based approach to gradually reduce salt added to food. Despite the significant progress, further reductions are possible as demonstrated in the large variations in the present study. The fact that 53 % of breakfast cereals already met the 2017 target by 2015 clearly indicates that lower salt targets are urgently needed to ensure continuing reductions of salt levels in breakfast cereals.
In contrast to salt, sugars content in breakfast cereals has been steadily high since 1992. This is not surprising as there has not yet been a national sugar reduction strategy. In view of the compelling evidence for a population-wide sugar reduction, it is imperative to adapt the successful salt reduction programme, in particular setting sugar targets for different categories of food and drink. This will reduce sugars intake across the whole population and will help prevent obesity and type 2 diabetes.
Acknowledgements
Financial support: This research received no specific grant from any funding agency in the public, commercial or not-for-profit sectors. Conflict of interest: All authors declare that there are no conflicts of interest. S.P.-R. and K.M.H. are employees of Consensus Action on Salt and Health (CASH). F.J.H. is a member of CASH and its international branch, World Action on Salt and Health (WASH), and does not receive any financial support from CASH or WASH. G.A.M. is Chairman of Blood Pressure UK, CASH, WASH and Action on Sugar (AoS). Blood Pressure UK, CASH, WASH and AoS are non-profit charitable organisations. G.A.M. does not receive any financial support from any of these organisations. Authorship: S.P.-R. and K.M.H. are joint first authors. S.P.-R. and K.M.H. identified the study topic and design; S.P.-R. and K.M.H. reviewed the data, conducted the statistical analysis and drafted the manuscript; F.J.H. provided statistical support. All authors contributed to and approved the final manuscript and take responsibility for the reliability and freedom from bias of the data presented and their interpretation. Ethics of human subject participation: Not applicable.


