


Stunting, or inadequate height-for-age, is formally defined by the WHO as ‘the impaired growth and development that children experience from poor nutrition, repeated infection, and inadequate psychosocial stimulation’( 1 ). Stunting has adverse effects on children, including increased infectious disease morbidity and mortality, impaired cognitive and mental development, poor school performance, and low adult wages and productivity( 1 , Reference Tiwari, Ausman and Agho 2 ). Overall, stunting negatively impacts the socio-economic development of a nation( Reference Tiwari, Ausman and Agho 2 ).
Globally, it is estimated that stunting among children <5 years old (under-5s) decreased from 39·7 to 26·7% between 1990 and 2010( Reference de Onis, Blössner and Borghi 3 ). During the same period, stunting in Africa stagnated around 40% and is expected to remain stable through 2020( Reference de Onis, Blössner and Borghi 3 ). In Uganda, however, stunting decreased slowly over the same period. The reported prevalence of stunting was 38·3, 39·1, 38·1 and 33·4% for the years 1995, 2001, 2006 and 2011, respectively( 4 ). In 2011, it was estimated that 2·1 million Ugandan children were stunted.
There is strong evidence that sociodemographic variables are associated with stunting( 4 – Reference Fotso 10 ), indicating that the prevalence at national level does not adequately represent stunting at regional level. The 2011 Uganda Demographic and Health Survey (UDHS) estimated that the Western region had the highest prevalence of stunting at 43·1%, followed by the Northern region with 32·2%. In Central and Eastern regions, stunting prevalence was 29·1 and 28·5%, respectively( 4 ). Apart from region, household factors such as wealth, source of drinking-water, toilet facility, number of household members( Reference Muhoozi, Atukunda and Mwadime 5 ) and number of under-5 children( Reference Masibo and Makoka 6 ); maternal characteristics such as education, age( Reference Muhoozi, Atukunda and Mwadime 5 ), height, marital status( Reference Masibo and Makoka 6 , Reference Habaasa 7 ), BMI( Reference Masibo and Makoka 6 ), work status( Reference Willey, Cameron and Norris 8 ) and occupation( Reference Habaasa 7 ); and child-related characteristics including sex( Reference Muhoozi, Atukunda and Mwadime 5 , Reference Willey, Cameron and Norris 8 ), age( Reference Kikafunda, Walker and Collett 9 ), birth order( Reference Muhoozi, Atukunda and Mwadime 5 , Reference Habaasa 7 ), size at birth and recent morbidity( Reference Kikafunda, Walker and Collett 9 , Reference Fotso 10 ) are also associated with stunting.
The prevalence of stunting has been decreasing in Uganda, partly attributed to betterment of the economy and maternal education( 11 ). As an indicator for the improving economy, Uganda’s gross domestic product per capita grew from $280 in 1995 to $575 in 2011 in current US dollars( 12 ). Extreme poverty, defined as earning less than $1 per day for one individual, reduced from 56·4 % in 1992 to 24·5% in 2010( 11 ). In 1997, Uganda launched universal primary education, allowing all children to receive the first seven years of education for free( 11 ). Consequently, the percentage of women who did not receive formal education decreased from 31·0% in 1995( 13 ) to 19·9% in 2011( 4 ). The Government of Uganda partners with multiple international organizations to address childhood malnutrition and stunting. The Nutrition and Early Child Development Project( 14 ), with funds from the World Bank, was a multipronged nutrition intervention started in the late 1990s in two-thirds of the districts of Uganda selected based on prevalence of pre-school child malnutrition. UNICEF strives to ensure health care, nutrition and sanitation for children and mothers, who are reached by health-care workers from Village Health Teams in local facilities( 15 ). UNICEF also leads an Integrated Management of Acute Malnutrition plan to spread the correct child feeding practices and provide treatments for stunted children( 16 ). The Water, Sanitation, and Hygiene Programme was launched to increase access to clean water and sanitation( 16 ). In 2011, Uganda launched its multisectoral Uganda Nutrition Action Plan that specifically focuses on reducing malnutrition and the burden of mothers to care for their malnourished children( 17 ). In the same year, Uganda joined the Scaling Up Nutrition movement, a global movement that unites governments, non-government organizations and scholars to improve childhood nutrition( 17 ). Specifically, Scaling Up Nutrition coordinates with the implementation of the Uganda Nutrition Action Plan( 17 ).
Despite multiple efforts, Uganda still failed to meet the Millennium Development Goals proposed by the health ministry in 2005, which aimed to reduce stunting to 28 % by 2009( 18 ). As of 2011, one child in every three was stunted( 4 ). Strong surveillance systems are needed to guide strategies to achieve stunting reduction goals. While UDHS provides national comparisons of under-5 stunting in survey-specific publications, these data are limited in two ways. First, they do not offer longer-term trend analysis of stunting and its persistent risk factors needed by decision makers to act on. Second, national data do not offer key insights about regional variability in stunting, yet this level of granularity would allow for adjustment of strategies to target specific geographic areas with greater stunting burden. The aims of the present study were to describe the trends of under-5 childhood stunting in Uganda over 16 years and to assess its association with region of residence, maternal education and household income.
Methods
Study design
The present study was a serial cross-sectional analysis of four consecutive UDHS conducted in 1995, 2001, 2006 and 2011. UDHS are conducted nationwide every five years by the Uganda Bureau of Statistics to collect data on a wide range of topics including maternal and child health, household and respondent characteristics, education, nutrition and wealth.
Study population
In 1995, 2001, 2006 and 2011, the number of households selected was 7550( 13 ), 7885( 19 ), 8870( 20 ) and 9033( 4 ), with response rates of 98·4, 95·8, 97·5 and 95·3%, respectively. The weighted sample size of under-5 children was 4738( 13 ), 5576( 19 ), 2378( 20 ) and 2055( 4 ) in survey years 1995, 2001, 2006 and 2011, respectively, resulting in an overall sample size of 14 747. Only about half (49·8%) of the sampled households had under-5 children, and the number of children per household decreased over surveys. UDHS studies are representative estimates for the country, region and rural–urban area. The samples were selected in two stages. In the first stage, enumeration areas were selected among all enumeration areas from the latest Uganda National Household Survey (UNHS) using the probability-proportional-to-size approach( 4 , Reference Murthy, Fox and Sivasubramaniam 21 , Reference Frankel, McNaghten and Shapiro 22 ). An enumeration area was a geographic area covering an average of 104 households for survey year 2011( 4 ), while the sizes of enumeration areas in previous surveys were not included in the UDHS reports. In the second stage, a fixed number of households from each enumeration area was randomly selected. The second stage compensated the first stage, so that each individual in the population had the same probability of being sampled. All women aged 15–49 years who were resident in the selected households were eligible for interview. Height and weight measurements were carried out on women aged 15–49 years and their under-5 children.
UDHS data were anonymous regarding participant identities such as name and address. The institutional review boards determined that the present study was not a human subjects study (see online supplementary material, Supplemental Fig. 1). UDHS data were accessible upon approval by the DHS office located in Washington, DC.
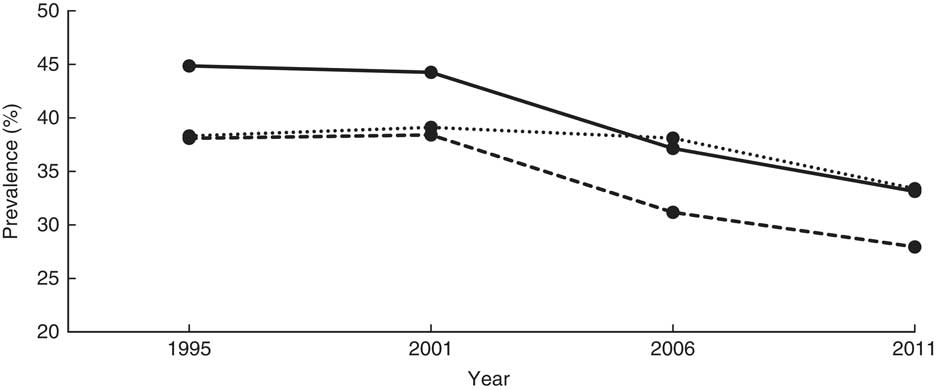
Fig. 1 Overall stunting trends among children aged <5 years according to standard (![]() , National Center for Health Statistics/Centers for Disease Control and Prevention International Reference Population(
24
);
, National Center for Health Statistics/Centers for Disease Control and Prevention International Reference Population(
24
); ![]() , WHO Child Growth Standards(
23
);
, WHO Child Growth Standards(
23
); ![]() , Uganda Demographic and Health Survey published data): Uganda Demographic and Health Survey 1995, 2001, 2006 and 2011(
4
,
13
,
19
,
20
)
, Uganda Demographic and Health Survey published data): Uganda Demographic and Health Survey 1995, 2001, 2006 and 2011(
4
,
13
,
19
,
20
)
Variables of interest
Outcome variables: stunting as a binary variable and height-for-age Z-score
In the present study, stunting was measured by height-for-age Z-score (HAZ) using the WHO Child Growth Standards. In our primary analysis, a child was moderately to severely stunted if his or her height-for-age was below −2 sd of the median of the WHO standard (i.e. HAZ<–2)( 23 ). To assess the robustness of our findings, severe stunting (height-for-age below −3 sd of the median of the WHO standard; i.e. HAZ<–3) was used in sensitivity analyses for comparison with the primary analysis. In addition to measuring stunting as a binary variable, HAZ was examined as a continuous outcome variable in sensitivity analyses. HAZ according to both the US National Center for Health Statistics/Centers for Disease Control and Prevention (NCHS/CDC) International Reference Population( 24 ) and the WHO Child Growth Standards were available in the DHS data. The UDHS reported stunting based on the NCHS/CDC reference in 1995 and 2001, and according to the WHO standards in 2006 and 2011. We plotted and compared the prevalence of stunting based on the NCHS/CDC reference and WHO standards for all surveys with the UDHS reported prevalence, to assess the effect of migration from the NCHS/CDC reference to WHO standards on the published trends of stunting. Additionally, we fitted a logistic regression model to the NCHS/CDC reference-based stunting data as part of sensitivity analyses to assess if the same risk factors held in both data sets.
Predictor variables: geographical region, household wealth index and maternal education
Regions were collapsed from the ten regions in recent surveys to the four regions in earlier surveys for comparison over survey years: Northern (West Nile, Mid Northern and North East), Central (Central 1, Central 2 and Kampala), Eastern (East Central and Mid Eastern) and Western (South Western and Mid Western). In a sub-analysis of 2006 and 2011 surveys, nine sub-regions were used to evaluate their association with stunting (see online supplementary material, Supplemental Fig. 2). The wealth index, calculated and provided by the UDHS, used assets to approximate wealth of households (Supplemental Table 1). The household wealth index was available from the data set in quintiles labelled as: poorest, poor, middle, rich and richest( 4 ). It was computed by the UDHS using factor analysis. Maternal education was categorized as none, primary (1–7 years), and secondary or higher (≥8 years). Discrete years of school were used for exploratory analysis.

Household, maternal and child-related covariates
Household characteristics included urban–rural residence, source of drinking-water (improved v. non-improved), toilet facility (improved v. non-improved), number of household members and number of under-5 children in the household. Maternal characteristics included maternal age, marital status, BMI/pregnancy status and work status. The child-related characteristics included sex, age, birth order, preceding birth interval less than 24 months, size at birth, fever in the last two weeks, cough in the last two weeks and diarrhoea in the last two weeks. Size at birth was subjectively reported by the respondent, and we categorized smaller than average and very small as low birth size as done in other studies( Reference Alemu and Umeta 25 , Reference Dahlui, Azahar and Oche 26 ).
Data analysis
The data were analysed using the statistical software package SAS version 9.4. The initial analysis involved univariable and bivariable analyses using χ 2 tests to assess associations between categorical variables and stunting for the primary analysis. All predictor variables were categorical, the moderate to severe stunting primary outcome variable and the severe stunting outcome variable were binary, while the HAZ outcome variable was continuous. Variables that were associated with stunting in the bivariable analysis at a P value of 0·1 were included in multivariable logistic and linear regression models to assess their independent associations with stunting and HAZ, respectively. For each survey, a model was fitted to the data, and thereafter the data were pooled across all surveys to fit an overall model. The survey indicator variable was included in the pooled models as a dummy variable to account for temporal variation and direction of the strength of the OR. Backward elimination of non-significant variables (at a P value of ≥0·05) was performed to obtain a preliminary model for each survey. Variables were retained in all final models if they were statistically associated with stunting at a P value of <0·05 in any of the survey-specific models. To account for the DHS complex sampling design, sampling weights, provided by UDHS, were applied in all analyses. Sensitivity analyses were performed in a similar way as the primary analysis except that we used ANOVA for the bivariable analysis of HAZ.
Results
Overall decreasing trends of stunting
The present study included under-5 children from four UDHS. The sample size was 4738, 5576, 2378 and 2055 for surveys conducted in 1995, 2001, 2006 and 2011, respectively. Overall, children from the Northern region constituted the smallest proportion of 19 %; children from each of the other three regions constituted more than one-quarter of the sample. Almost 90 % of the children were rural residents. About 59 % of the children were aged <24 months in the 1995 survey. This proportion dropped to 45% in 2001 and stayed about the same in subsequent surveys. In the first three surveys, about 19 % of the children were considered small at birth by their mothers, which proportion increased to 22·1 % in 2011. Morbidity within two weeks of data collection was high in all surveys: fever, 44–49 %; cough, 49–51 %; and diarrhoea, 21–27 % (Table 1).
The mean HAZ increased from −1·8 (se 0·027) in 1995 to −1·4 (se 0·039) in 2011 (Table 2). The prevalence of stunting decreased from 44·8 to 33·2% over the same period (χ 2 for trend=4·5, P < 0·0001). Figure 1 shows the prevalence of stunting computed according to the NCHS/CDC reference and the WHO standards, and that reported by the UDHS, which masks the sharp drop in stunting between 2001 and 2006. A 7-percentage-point reduction was masked in the UDHS reports due to migration from the NCHS/CDC reference to the WHO standards in 2006. The NCHS/CDC reference underestimated stunting at 38·3% instead of 44·8 % in 1995 and at 39·1% instead of 44·2% in 2001. If the NCHS/CDC reference were used in 2006 and 2011, stunting would have been reported, respectively, as 31·2% instead of 38·1% and 28·0% instead of 33·4%. Using year 1995 as a reference, the adjusted OR (AOR) of stunting in years 2001, 2006 and 2011 was 0·89 (95% CI 0·81, 0·99; P<0·05), 0·65 (95% CI 0·57, 0·73; P<0·001) and 0·58 (95% CI 0·51, 0·67; P<0·001), respectively (Table 3). This was a 42% reduction in in the odds of stunting over 16 years.
Table 2 Number and percentage of children aged<5 years with stunting, based on the WHO Child Growth Standards( 23 ), by household, maternal and child-related characteristics: Uganda Demographic and Health Survey 1995, 2001, 2006 and 2011( 4 , 13 , 19 , 20 )
HAZ, height-for-age Z-score.
*P≤0·05, **P≤0·01, ***P≤0·001.
Table 3 Relationship between childhood stunting, based on the WHO Child Growth Standards( 23 ), and household, maternal and child-related characteristics from the multivariable logistic regression models: Uganda Demographic and Health Survey 1995, 2001, 2006 and 2011( 4 , 13 , 19 , 20 )
ref., reference category.
*P≤0·05, **P≤0·01, ***P≤0·001.
OR are adjusted in multivariable models.
All variables in Table 3 are included in each model.
Household characteristics: region, residence, wealth index and source of drinking-water
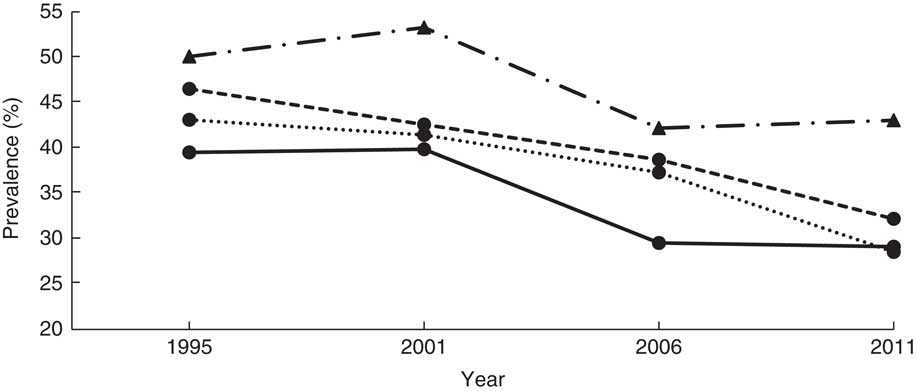
In Eastern and Northern Uganda, the prevalence of stunting declined steadily, consistent with the trend at the national level. Stunting in Central Uganda stagnated from 1995 to 2001, while the prevalence in Western Uganda increased by 3·2 percentage points. Between 2001 and 2006, Central and Western Uganda experienced a sharp drop, but stunting prevalence stagnated thereafter (39·5, 39·9, 29·5 and 29·1% in Central; 50·1, 53·3, 42·2 and 43·1% in Western for years 1995, 2001, 2006, 2011, respectively; Table 2 and Fig. 2). Compared with children from Eastern Uganda, the pooled AOR was 1·25 (95% CI 1·11, 1·42) in Central and 1·74 (95% CI 1·55, 1·95) in Western (P<0·001 for both regions; Table 3). Sub-analysis of 2006 and 2011 data revealed that children from the South Western sub-region had the highest odds of stunting among all nine sub-regions (AOR=2·23; 95% CI 1·63, 3·06; P<0·001), using Mid Eastern sub-region as the reference (see online supplementary material, Supplemental Table 2). Other sub-regions with significantly higher odds of stunting than the Mid Eastern sub-region were Kampala (AOR=1·69; 95% CI 1·14, 2·50; P<0·001), East Central (AOR=1·42; 95% CI 1·06, 1·90; P<0·01) and Western (AOR=1·65; 95% CI 1·22, 2·23; P<0·001). The proportion of stunting was higher in rural areas than in urban areas in all surveys (Table 2), but only in year 1995 did rural children have significantly higher relative odds (AOR=1·59; 95 % CI 1·25, 2·02; P<0·001) compared with urban children. Overall, rural children were 20 % more likely to be stunted when compared with urban children (Table 3).
When grouping households by wealth index quintiles, the richest quintile had the lowest proportion of stunting in every survey (Table 2). From 1995 to 2011, the proportion of stunting in the middle quintile of the wealth index stagnated at about 45 %, while the proportion of stunting in the other four quintiles declined steadily (Table 2). Using the richest quintile as a reference, children in the poorest and poorer quintiles had significantly higher odds of stunting (AOR=1·53; 95% CI 1·13, 2·06; P<0·01 and AOR=1·53; 95% CI 1·15, 2·03; P<0·01, respectively) in 1995. This phenomenon shifted as, in 2011, only the middle quintile had significantly higher odds of stunting (AOR=2·11; 95% CI 1·26, 3·53; P<0·01; Table 3). Availability of improved source of drinking-water was about 40 % in the first three surveys but increased to more than 60 % in 2011 (Table 1). In 2006 and 2011, children who used non-improved water sources were significantly more likely to be stunted that those who used improved water sources.
Maternal characteristics: education, age, BMI and employment
In each survey, women had greater access to education than the survey before. The prevalence of women with no education declined steadily from 31·0% in 1995 to 12·3% 2011 (χ 2 for trend=8·4, P<0·0001). Women with primary and secondary or higher education increased from 58·0 to 65·8 % and from 11·0 to 21·9 % over the same period. In all surveys, the proportion of stunting in children declined as mother’s educational level increased. Using mothers with secondary or higher education as the reference group, children of uneducated or primary educated mothers were significantly more likely to be stunted in the pooled model (AOR=1·34; 95% CI 1·14, 1·59; P<0·001 and AOR=1·20; 95% CI 1·04, 1·38; P<0·05, respectively). Similar associations were observed in the 2001 and 2006 surveys but not in the 1995 or 2011 surveys (Table 3). Finer analysis of years of school revealed stepladder reduction in child stunting if the mother stopped in senior one (eighth year of education) or senior five (twelfth year of education), coinciding with successful completion of primary and secondary education, respectively (see online supplementary material, Supplemental Table 3).
Throughout all four surveys, 20–30-year-old mothers were the dominant age group, and the proportion of teen mothers almost halved between 1995 and 2001 (Table 1). Childhood stunting decreased in all maternal age groups, but the decline was lowest for children with teenage mothers (Table 2). There was an increased likelihood of childhood stunting if the mother was younger (AOR=1·57; 95% CI 1·31, 1·87; P<0·001; Table 3). When categorizing women by maternal BMI/pregnancy status, stunting was most prevalent in children who had pregnant or postpartum mothers, defined as the first two months after delivery. The prevalence of stunting decreased most among children with thin mothers (Table 2). Overweight or obese mothers were significantly less likely to have stunted children in all four surveys compared with mothers of normal BMI (AOR=0·70; 95 % CI 0·61, 0·79; P<0·001; Table 3). Other than survey year 1995, there was no significant association between maternal employment status and child stunting after adjusting for other variables.
Child-related characteristics: sex, age, birth weight and diarrhoea
In each survey and the pooled model, male children were significantly more likely to be stunted than female children (AOR=1·42; 95% CI 1·31, 1·54; P<0·001; Table 3). Children aged 24–35 months were the most stunted, while those aged 0–12 months were least stunted (Table 2). Prevalence of stunting was significantly higher among children who were small at birth than among those with normal birth size. Over the period of study, stunting among children with normal birth size decreased by 13 percentage points compared with a 9-percentage-point decrease among children with small size (Table 2). A child with diarrhoea two weeks before the survey was 17% more likely to be stunted than one without (AOR=1·17; 95% CI 1·11, 1·23; P<0·001). Similar associations were observed in survey-specific estimates (Table 3). When severe stunting (HAZ<−3) or continuous HAZ was the outcome variable or the NCHS/CDC reference were used in sensitivity analyses, the findings were similar to those reported when moderate to severe stunting (HAZ<−2) was the outcome variable (see online supplementary material, Supplemental Table 4).
Discussion
The present study examined the long-term trends of stunting among under-5 Ugandan children between 1995 and 2011 by various characteristics. At the national level, childhood stunting decreased significantly from 44·8% in 1995 to 33·2% in 2011 using the WHO child growth standards. However, a 7-percentage-point reduction in stunting was masked in the UDHS reports due to migration from the NCHS/CDC reference to the WHO standards in 2006. Geographical region, household wealth, maternal education and child age, gender and birth size were associated with childhood stunting over the four surveys. These findings held when using the WHO standards or NCHS/CDC reference, or continuous HAZ.
Similar studies showed a slower decline of childhood stunting in Kenya and Côte d’Ivoire, where the prevalence of stunting decreased by 4·6 and 2·9 percentage points in the past two decades, respectively( Reference Masibo and Makoka 6 , Reference Barankanira, Molinari and Msellati 27 ). It is not clear whether transition from the NCHS/CDC reference to the WHO standards partially explains the minimal decreases in stunting in these countries. High proportions of stunting among children were also found in the Central African Republic, Democratic Republic of Congo and Ethiopia( Reference Vonaesch, Tondeur and Breurec 28 – Reference Hagos, Hailemariam and WoldeHanna 30 ). Compared with the whole of sub-Saharan Africa, where 40% of under-5 children were stunted( Reference de Onis, Blössner and Borghi 3 ), Uganda is performing better. However, Uganda failed to meet its goal of reducing stunting to 28% by 2009( 18 ). Regional differences in the prevalence of stunting were found in similar studies conducted in Tanzania, Nigeria, Kenya and Zambia( Reference Chirande, Charwe and Mbwana 31 – Reference Hoffman, Cacciola and Barrios 33 ). Western Uganda had the highest prevalence of stunting, which could be attributed to incorrect feeding practices, local dietary traditions and HIV/AIDS( Reference Wamani, Åstrøm and Peterson 34 – Reference Goode 36 ). UNICEF and WHO recommend exclusive breast-feeding for the first 6 months of life and introduction of complementary foods at 6 months in addition to continued breast milk( 4 ). However, a study in Western Uganda found that 21% of 2–3-month-old infants received complementary foods( Reference Wamani, Åstrøm and Peterson 34 ). Moreover, the frequency of complementary feeding for almost half of the children aged 12–23 months was less than optimal (less than twice per day)( Reference Wamani, Åstrøm and Peterson 34 ). Local diets may also contribute to stunting. Western Uganda has high agricultural potential as vegetables can be grown year-round, however they are not widely consumed( Reference Goode 36 ). Goode noted that popularizing the consumption of plants would improve nutrient intakes as vegetables provide micronutrients such as vitamin A, iron and zinc( Reference Goode 36 ). Furthermore, HIV/AIDS is associated with lower health status of parents, which is associated with increased childhood stunting( Reference Biondi, Kipp and Jhangri 35 ). In Western Uganda, the higher childhood malnutrition rate coincides with higher HIV infection rate( Reference Biondi, Kipp and Jhangri 35 ). A sub-analysis of the 2006 and 2011 surveys including nine smaller regions revealed small regional variation in stunting, warranting smaller area analysis to pinpoint pockets of stunting. Policies regarding improving children’s diets need to be made, targeting the Western region and other smaller regions with the highest prevalence of stunting.
While it is not logical to compare household wealth index quintiles across surveys because the cut-offs may be different, comparing yearly prevalence of stunting in different quintiles helps to visualize the disparity of nutritional status among children from different economic levels. Using the richest category as reference, children from the poorest and poorer categories were significantly more likely to be stunted in 1995. Similar results were found in Tanzania, Nigeria, Kenya and Zambia( Reference Chirande, Charwe and Mbwana 31 – Reference Hoffman, Cacciola and Barrios 33 ), where children from poorer families were more likely to be stunted. One explanation is that richer households would have greater purchasing power to ensure adequate nutritional intake for children compared with poorer households( Reference Tiwari, Ausman and Agho 2 ). A shift in the group most vulnerable to stunting regarding wealth index was observed in later survey years. In 2001, while all four groups had significantly higher odds of stunting when compared with the richest group, the poorest and middle categories had the highest OR. In 2011, only children from the middle category were significantly more likely to be stunted with a twofold increase. It is not clear why the children most vulnerable to stunting shifted from the poorest households to the middle-income households over time. This observation needs to be researched further. Rural–urban migration may partially explain this observation as household income may be spent on asset acquisition in preference to buying food; commercialization of food crops that came with economic diversification during our study period may have led to families selling food to acquire assets instead of eating it( Reference Whyte and Kyaddondo 37 ). It is also possible that household assets that correlate with household income changed over the study period and need re-evaluation( Reference Egede, Voronca and Walker 38 , Reference Steinert, Cluver and Melendez-Torres 39 ).
Consistent with the UDHS reports and previous research in Uganda( Reference Kikafunda, Walker and Collett 9 ), higher maternal education was associated with lower likelihood of childhood stunting( 4 ). A closer look at completed years of maternal education revealed that reaching senior one (or finishing the 7-year primary education) or senior five (or finishing the 4-year lower secondary education) was associated with the highest reduction in stunting of children, suggesting that successful graduation from primary or secondary school is more beneficial than simply accumulating years of education. This is consistent with a Kenyan study which found that attaining a secondary level of maternal education was associated with decreased odds of childhood stunting, since higher education is associated with employment and higher household income( Reference Masibo and Makoka 6 ). Education also serves as an important strategy to teach women correct child feeding practices( Reference Nkurunziza, Meessen and Van Geertruyden 40 ). Unfortunately, as of 2011, 12% of women in Uganda remained uneducated, while 66% received only some primary education. Only 22% received some secondary education or higher. Structural inequalities may keep women out of school, as many African cultures consider men’s education more important than the education of women( Reference Keino, Plasqui and Ettyang 41 ). According to the Uganda Bureau of Statistics, of all females aged 6–12 years who did not attend school, 53·8% did not attend because they were considered to be ‘too young’; another 6% did not go to school because they had to help at home, while only 2·6% of their male counterparts were hindered for the same reason( 42 ).
Of the other predictors of stunting, male children were significantly more likely to be stunted in all four surveys, matching the finding in ten sub-Saharan African countries where male children consistently had a higher frequency of stunting( Reference Wamani, Åstrøm and Peterson 43 ). Previous epidemiological studies in neonatology found morbidity and mortality to be higher in male infants and children than female counterparts, suggesting that boys are generally more vulnerable( Reference Pollak and Birnbacher 44 ). Similar to results from Congo, thin mothers were most likely to have stunted children, while overweight mothers were least likely( Reference Kismul, Acharya and Mapatano 29 ). When compared with children less than 12 months of age, older children were significantly more likely to be stunted, consistent with findings in Nepal and Burundi( Reference Tiwari, Ausman and Agho 2 , Reference Nkurunziza, Meessen and Van Geertruyden 40 ). The OR was highest for children between 24 and 35 months of age. It is not surprising that the stunting rate increases with age (at least up to 3 years) as the growth deficit is cumulative and there is limited catch-up growth( Reference Georgiadis and Penny 45 ). Other possible explanations are prolonged breast-feeding into the second year of life, early or late introduction of complementary foods, and insufficient frequency of feeding( Reference Wamani, Åstrøm and Peterson 34 ). However, children aged 36–59 months were less likely to be stunted than those 24–35 months old, and the reasons are unclear. It is possible some of them had recovered from stunting( Reference Prentice, Ward and Goldberg 46 , Reference Georgiadis, Benny and Galab 47 ) or the severely stunted ones had died, leaving the less stunted ones to survive beyond 2 years of age. Children with small birth size were more likely to be stunted than those with normal size since birth size is associated with birth height, which is a predictor of height at older ages( Reference Eide, Øyen and Skjœrven 48 ). Morbidity, including diarrhoea, was associated with increased chance of being stunted, although this may be reverse causality because stunted children are at a greater risk of diarrhoea. Both birth size and morbidity showed similar impact on childhood malnutrition in Kenya and Nigeria( Reference Masibo and Makoka 6 , Reference Akombi, Agho and Hall 32 ). Considering all these predictors, low-birth-size Ugandan boys in their third year of life are at the highest risk of stunting. This risk is even higher following bouts of diarrhoea. Infant girls with normal birth size are at the lowest risk of stunting. Teen mothers were more likely to have stunted children. Younger women tend to have less child-rearing knowledge or experience; in addition, they may have not finished secondary education.
According to Fig. 1, the trends of stunting from the NCHS/CDC reference and the WHO growth standards are parallel, with the WHO standards-based trend higher than the NCHS/CDC reference-based trend, suggesting that the NCHS/CDC reference underestimated stunting among Ugandan children. Whereas using any of the two standards would be sufficient for surveillance purposes, the NCHS/CDC reference would misclassify some stunted children as normal, hindering their opportunity to receive relevant interventions. Our study demonstrates that the process of transitioning from the NCHS/CDC reference to the WHO standards not only masked a 7% decrease in stunting during the study period according to UDHS reports, but also masked the precipitous drop in 2001 and erroneously showed a moderate drop starting in 2006. According to our study, it appears that interventions implemented in the 1990s rather than 2000s may be responsible for most of the observed decease in stunting. Whether the stunting reduction mask related to transitioning between the NCHS/CDC reference and WHO growth standards observed in our study explains the minimal change in prevalence in stunting reported in other studies needs further investigation( Reference Barankanira, Molinari and Msellati 27 , Reference Hoffman, Cacciola and Barrios 33 ).
There are strengths and limitations in the present study. Strengths include large sample size for all surveys, thereby allowing the use of a comprehensive set of variables, and four surveys to analyse trends. We believe that our findings are robust as there are no major differences whether we use continuous HAZ or the binary stunting variable, severe or moderate stunting, or the NCHS/CDC reference or WHO standards to evaluate predictors of stunting. Limitations are that cross-sectional analysis did not allow following individual children as they grew to enable us to establish causality between the predictor variables and stunting. Inconsistent breast-feeding information across the surveys did not allow meaningful analysis of this important factor. Change in the number of regions between surveys forced us to use the broadest regions used in earlier surveys. Availability of complete data varied from survey to survey, and the number of under-5 children per household dwindled with subsequent surveys; the latter for a good reason though, namely fewer children per household due to decreasing fertility rate that dropped from 7 to below 6 children per woman during the study period( Reference Blacker, Opiyo and Jasseh 49 ). The smaller numbers in the 2006 and 2011 surveys may have compromised the power to detect associations in those surveys compared with the 1995 and 2001 surveys, although we did not find many differences across surveys apart from the wealth index variable.
Conclusions
The aims of the present study were to describe the trend of under-5 childhood stunting over 16 years in Uganda and to analyse its association with region, wealth and maternal education. At the national level, the analysis showed that under-5 childhood stunting has been declining. But not all regions or groups of children benefited equally from the decline. As of 2011, children living in the Western region, living in middle-income households and with uneducated mothers were the most vulnerable to stunting. In addition, despite the general decrease, the prevalence of stunting remains high. Policies and practices need to be put in place to address this high level of stunting, guided by demographic details.
Acknowledgements
Acknowledgements: The authors are grateful to Dr Crystal Miller who critically read and provided constructive comments on the initial version of this manuscript. Financial support: This publication was made possible by the Clinical and Translational Science Collaborative of Cleveland (grant number KL2TR000440) from the National Center for Advancing Translational Sciences (NCATS) component of the National Institutes of Health (NIH) and NIH Roadmap for Medical Research. Its contents are solely the responsibility of the authors and do not necessarily represent the official views of the NIH. The funding body was not involved in the design of the study, in the collection, analysis and interpretation of data, or in the writing of the manuscript. Conflict of interest: None. Authorship: P.M.B. conceptualized and designed the study; acquired, processed, analysed and interpreted the data; drafted the initial manuscript; and revised the manuscript for intellectual content. Y.Y.Y. processed and interpreted the data; created the tables and figures; drafted the initial manuscript; and revised the manuscript for intellectual content. G.K. interpreted the data; created the tables and figures; and revised the manuscript for intellectual content. D.N., H.B., D.F., Y.A.M.L. and E.M. interpreted the data and revised the manuscript for intellectual content. All authors approved the final version of the manuscript as submitted for publication and agreed to be accountable for all aspects of the work. Ethics of human subject participation: This study was non-human subjects research as determined by the Case Western Reserve University and the Social, Behavorial and Educational Research (SBER) Institutional Review Boards.
Supplementary material
To view supplementary material for this article, please visit https://doi.org/10.1017/S1368980018001982


 Open access