


Introduction
Aptamers are short, single-stranded nucleic acids that are selected to bind molecular targets, including small molecules, proteins, and cells. They are produced via an in vitro evolutionary process coined systematic evolution of ligands by exponential enrichment (SELEX; DeRosa et al., Reference Derosa, Lin, Mallikaratchy, Mcconnell, Mckeague, Patel and Shigdar2023). Using SELEX, aptamers have been produced to bind their target, often with high specificity and affinity. Similar to their naturally occurring counterparts, riboswitches, some aptamers derived from SELEX can have an additional function: an ability to undergo a binding-induced conformational change (Nutiu and Li, Reference Nutiu and Li2005; Morse, Reference Morse2007; Oh et al., Reference Oh, Plakos, Lou, Xiao and Soh2010; Yang et al., Reference Yang, Pei and Stojanovic2016).
Structure-switching aptamers are advantageous for the development of biosensors. Their ability to undergo a binding-induced conformational rearrangement can be easily transduced into measurable optical or electrochemical signals (Lau and Li, Reference Lau, Li, Gu and Kim2014). Analogous to receptors found in nature, this class of aptamers can support signaling that is inherently independent of surface fouling, a process detrimental to the long-term stability of biosensors. Additionally, target binding kinetics (on and off rates) to these aptamers is relatively fast, especially in the case of small molecules. As a result, structure-switching aptamers help support continuous, real-time, and rapid (<5 min) measurements of clinically relevant targets (drugs, steroids, chemotherapeutics, antibiotics, etc.) directly in undiluted complex matrices, such as whole blood and even in the body for prolonged periods (Kwon et al., Reference Kwon, Lee, Lee and Ahn2020; Cánovas et al., Reference Cánovas, Daems, Campos, Schellinck, Madder, Martins, Sobott and De Wael2022; Xie et al., Reference Xie, Wu, Chen, Jiang and Sun2022; Alkhamis et al., Reference Alkhamis, Canoura, Wu, Emmons, Wang, Honeywell, Plaxco, Kippin and Xiao2024). These unprecedented capabilities are thus paving the way toward the development of point-of-care diagnostic tools to solve the paradigm of personalized medicine.
Considering the importance of structure-switching aptamers in such applications, we first look at aptamers that have been discovered to inherently undergo a conformational change upon ligand binding and review the secondary and tertiary structure motifs they adopt. Since many aptamers must be engineered post-SELEX to possess a structure-switching function, we look at biophysical methods, structural, binding, and fluorescent techniques, capable of determining that structural changes occur when aptamers bind their target.
Structure-switching aptamers
For the purpose of this review, we define structure-switching aptamers as nucleic acid sequences that undergo a structural change with target binding. This may be from a structured free state to a differently structured bound state or ones that undergo binding-induced folding. In the latter case, an aptamer goes from a free state to a bound state that is less dynamic or where more of the nucleotides are in a region of defined secondary structure. The structural changes incurred by aptamers can thus be of various scales. For instance, the MN4 cocaine-binding aptamer already adopts a structure in the free state and undergoes small conformational rearrangements with target binding that create 1–2 new base pair interactions. Ultimately, this does not alter the tertiary structure of the aptamer. The MN19 cocaine-binding aptamer, in contrast, transitions from an unstructured or dynamic free state and undergoes a large structural change in which a new stem (stem 1) forms (Cekan et al., Reference Cekan, Jonsson and Sigurdsson2009; Neves et al., Reference Neves, Reinstein and Johnson2010).
There are a variety of secondary structural changes that aptamers can undergo with ligand-induced folding. A first and well-studied case is of aptamers that form a three-way junction due to target binding (Figure 1a). Examples of this are the MN19 cocaine-binding aptamer and the related MS2 steroid-binding aptamers. These aptamers contain a loosely folded stem in the free state, which upon binding their target transition to three-way junction conformations (Reinstein et al., Reference Reinstein, Neves, Saad, Boodram, Lombardo, Beckham, Brouwer, Audette, Groves, Wilce and Johnson2011, Reference Reinstein, Yoo, Han, Palmo, Beckham, Wilce and Johnson2013; Neves et al., Reference Neves, Shoara, Reinstein, Abbasi Borhani, Martin and Johnson2017). A second well-studied case is where ligand-binding triggers folding of the aptamer into a G-quadruplex (Figure 1b). The 15-nucleotide thrombin-binding (Li et al., Reference Li, Fang and Tan2002; Lin et al., Reference Lin, Chen, Lee, Chang, Chen and Chen2011), serotonin-binding and ochratoxin A-binding aptamers (Yang et al., Reference Yang, Wang, Marty and Yang2011; Nakatsuka et al., Reference Nakatsuka, Yang, Abendroth, Cheung, Xu, Yang, Zhao, Zhu, Rim, Yang, Weiss, Stojanović and Andrews2018; Xu et al., Reference Xu, Zhao, Yu, Wang, Huang, Zhao, Zhou, Li and Liu2022) are examples of this where they transition from an unfolded free state to a G-quadruplex structure. A third common case is when an internal loop of the aptamer becomes more structured (Figure 1c). The 27-nucleotide ATP-binding, the caffeine-binding and glucose-binding DNA aptamers (Nakatsuka et al., Reference Nakatsuka, Yang, Abendroth, Cheung, Xu, Yang, Zhao, Zhu, Rim, Yang, Weiss, Stojanović and Andrews2018; Huang and Liu, Reference Huang and Liu2022; Lu et al., Reference Lu, Jimmy Huang, Zheng and Liu2022) are examples of a system in which a stem with a large asymmetrical internal loop is found in the free state. For the ATP-binding DNA aptamer, the internal loop becomes more ordered as additional base pairs form when the aptamer binds its ligand (Lin and Patel, Reference Lin and Patel1997).

Figure 1. Different types of aptamer conformational changes induced by ligand binding. (a) Three-way junction formation. (b) G-quadruplex formation. (c) Reduction in internal loop size. (d) Assembly of split aptamer strands.
While several aptamers have been discovered to inherently undergo a conformational change upon ligand binding, such as the ATP-binding DNA aptamer (Lin and Patel, Reference Lin and Patel1997), they more commonly must be engineered post-SELEX to possess this ability. This can be done by: (1) splitting sequences into two or more strand fragments, referred to as split-aptamers (Figure 1d), (2) hybridizing with a complementary strand, a molecular beacon approach, or (3) truncating using exonuclease digestion. Examples of developing split aptamers are numerous, and include the ATP, cocaine, codeine, and thrombin-binding aptamers. Each has been made as split aptamers in which fragments remain separate in the free state and then assemble or hybridize upon target binding to form the complete aptamer–ligand complex (Stojanovic et al., Reference Stojanovic, De Prada and Landry2000; Liao et al., Reference Liao, Jiao, Wang, Lin and Yu2012; Kent et al., Reference Kent, Spiropulos and Heemstra2013; Liu et al., Reference Liu, Shi, Hua, Huang, Su, Fan, Wang and Huang2014; Bing et al., Reference Bing, Zheng, Zhang, Shen, Liu, Wang, Cui, Cao and Shangguan2017; Debiais et al., Reference Debiais, Lelievre, Smietana and Müller2020). Exonuclease digestion has been developed by the Xiao group to introduce structure switching into selected aptamers by reacting the aptamer in the presence of its ligand with a DNA exonuclease to determine the structured core of the aptamer. Though useful, this technique has not yet been widely adopted (Canoura et al., Reference Canoura, Wang, Yu, Alkhamis, Fu and Xiao2018; Wang et al., Reference Wang, Yu, Canoura, Liu, Alkhamis, Fu and Xiao2018; Alkhamis et al., Reference Alkhamis, Canoura, Ly and Xiao2023).
Given that many aptamers are natively unable to undergo structural rearrangement, we review analytical tools that provide such information with the hopes that this will support researchers in engineering aptamers to become structure switching.
Structural and binding methods to assess structure-switching in aptamers
Nuclear magnetic resonance spectroscopy
Nuclear magnetic resonance (NMR) spectroscopy is a solution-based technique where a sample is placed in a strong external magnetic field enabling certain nuclei in the sample to be studied. For nucleic acid aptamers, these nuclei are 1H, 13C, 15N, and 31P. These spin ½ nuclei will resonate at a frequency that depends on their chemical identity and their specific local environment. 1H nuclei are particularly easy to examine due to their high natural abundance and are rich in information about their local environment. In contrast, nuclei such as 13C and 15N are more difficult to work with due to their low natural abundance, though isotopically enriched DNA and RNA aptamer samples can be prepared (Zimmer and Crothers, Reference Zimmer and Crothers1995; Le et al., Reference Le, Brown, Simon and Dayie2015; Dayie et al., Reference Dayie, Olenginski and Taiwo2022; Wang et al., Reference Wang, Yu, Sakurabayashi, Paz-Villatoro and Iwahara2024). Due to the analytical capabilities offered by NMR spectroscopy, it has been used to determine the three-dimensional structures of a number of DNA and RNA aptamers, both free and ligand-bound (Sakamoto, Reference Sakamoto2017; Xu et al., Reference Xu, Zhao, Yu, Wang, Huang, Zhao, Zhou, Li and Liu2022, Reference Xu, Wang, Yu, Li, Zhao, Zhou, Li and Liu2023). While determining the structure of free and bound forms of aptamers is a clear way to determine conformational change that occurs with binding, it is not necessary to determine a three-dimensional structure to discover if conformational change occurs with ligand binding.
One-dimensional (1D) 1H NMR can provide valuable information on the structural changes of aptamers with target binding through studying the peaks of imino protons. Imino proton signals of aptamers typically arise in 1H NMR spectra when protected from exchange with bulk water by being hydrogen bonded such as in base pairs (Sakamoto, Reference Sakamoto2017). Imino protons are located downfield between 10 and 15 ppm, which sets them apart from other proton signals in the spectra (Sakamoto, Reference Sakamoto2017). When performing a titration of an aptamer with its ligand, one obtains a series of 1D 1H NMR spectra ranging from the free to ligand-bound aptamer. Depending on the appearance and/or disappearance of certain signals, this can provide information on the ability of the aptamer to undergo a change in structure as hydrogen-bonded nucleotides get formed or broken.
Two-dimensional (2D) NMR experiments are useful in assigning signals to particular nuclei in aptamers through their ability to interact with other nuclei. This is typically achieved using 2D Nuclear Overhauser Effect Spectroscopy (NOESY) in which the imino proton signals from 1H NMR can be correlated to specific bases within the structure of the aptamer (Wüthrich, Reference Wüthrich1986; Lin and Patel, Reference Lin and Patel1997). A detailed comparison of the free and ligand-bound imino proton spectra often yields insights into structural changes incurred by the aptamer upon ligand binding. An increase in the number of imino proton signals with ligand addition suggests that the aptamer forms new base pairs with ligand binding (Churcher et al., Reference Churcher, Garaev, Hunter and Johnson2020). Conversely, a decrease in the number of imino proton signals indicates that the aptamer may lose base pairs during binding. A narrowing and sharpening of imino proton peaks during titration can demonstrate that the aptamer adopts a more well-defined structure upon ligand binding (Neves et al., Reference Neves, Shoara, Reinstein, Abbasi Borhani, Martin and Johnson2017). Overall, 1D 1H NMR in conjunction with imino proton assignments from 2D NOESY can be used to effectively probe target-induced conformational changes of aptamers.
Neves et al. (Reference Neves, Reinstein and Johnson2010) performed 1D 1H NMR to monitor a titration of the three-way junction MN19 and MN4 cocaine-binding aptamers with cocaine to show that MN19 undergoes structural switching while MN4 does not. In the 1H NMR spectra of the MN19 aptamer, the imino proton signals were broader and fewer in number in the free state compared to the cocaine-bound state (Figure 2a). With cocaine addition, the imino proton signals sharpened and new imino proton peaks corresponding to G29, G30, G31, and T32 became visible. These 1H NMR spectral changes demonstrated that the MN19 aptamer is loosely folded in the free state and forms stem 1 of its three-way junction structure and two GA mismatches upon cocaine binding. In contrast, there was little change in the sharpness and total number of imino proton peaks of the MN4 aptamer between its free and cocaine-bound states (Figure 2b). Although the imino protons of G31 and T32 were visible for both the free and cocaine-bound MN4 aptamer, they changed chemical shift in the presence of cocaine. These peaks likely shifted position with cocaine addition due to their proximity to the cocaine-binding site of the MN4 aptamer. This 1H NMR titration provided evidence that the MN4 aptamer is prefolded in the free state and retains its three-way junction structure when binding cocaine. Previous 1H NMR studies involving the titration of quinine have also shown the structure-switching binding mechanism of the MN19 aptamer and the prefolded nature of the MN4 aptamer is retained (Reinstein et al., Reference Reinstein, Yoo, Han, Palmo, Beckham, Wilce and Johnson2013).
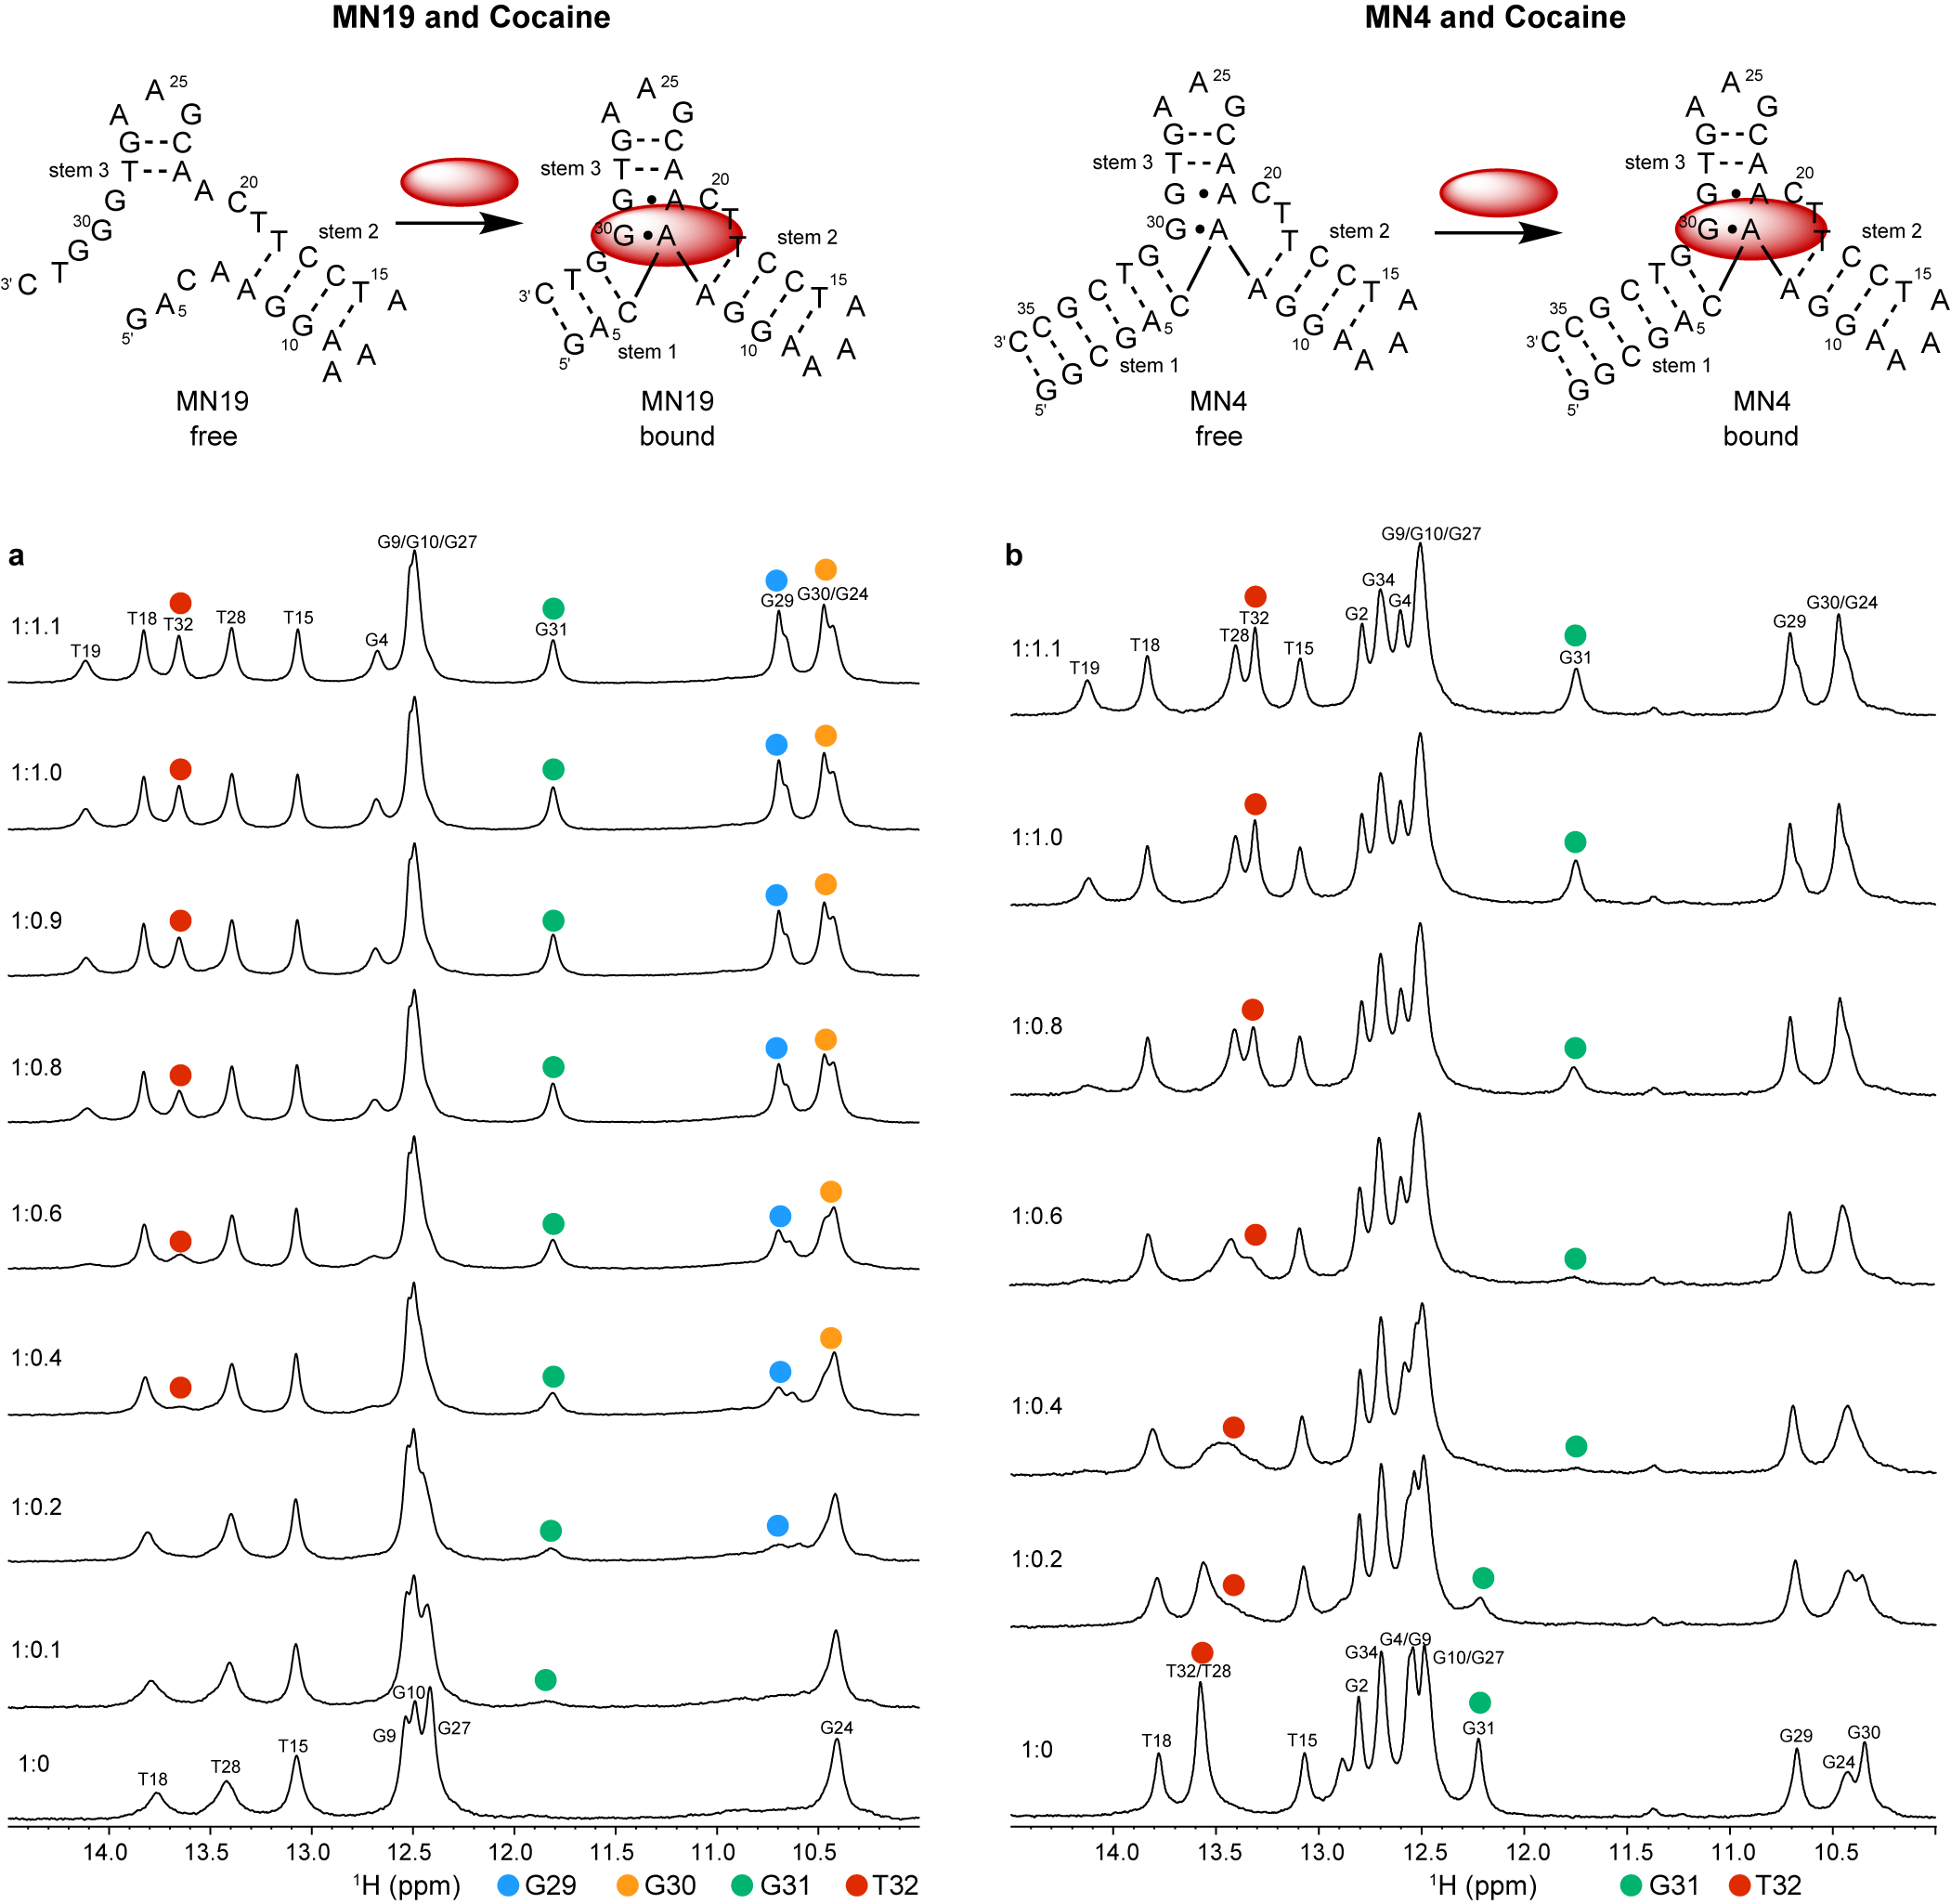
Figure 2. Cocaine binding by MN19 and MN4 cocaine-binding aptamers monitored by 1D 1H NMR. The region of the NMR spectra shown focuses on the imino resonances. (a) Spectra of the MN19 cocaine-binding aptamer titrated with cocaine. (b) Spectra of the MN4 cocaine-binding aptamer titrated with cocaine. The NMR spectra of the MN19 aptamer demonstrates structural change with ligand binding by the appearance of new imino peaks for G29 (blue dot), G30 (orange dot), G31 (green dot), and T32 (red dot) that are not observed in the free spectrum. The NMR spectra of the prefolded MN4 aptamer shows chemical shift changes in imino peaks for G31 (green dot) and T32 (red dot) but not the appearance of new peaks. Spectra were acquired at 1.6 mM for MN19 and 1.0 mM for MN4 at 5°C in 5 mM KHPO4, 245 mM KCl (pH 6.8) and 90% H2O/10% 2H2O. The molar ratios of aptamer to cocaine are indicated.
1D 1H NMR can be used to study the ligand-induced conformational changes of aptamers with internal loops and hairpin structures. Lin and Patel (Reference Lin and Patel1997) performed 1D 1H NMR to study a titration of the 27-nucleotide AMP-binding DNA aptamer with adenosine monophosphate (AMP). In the absence of AMP, broad imino proton signals were observed in the aptamer’s asymmetrical internal loop. When the aptamer bound two AMP molecules, the imino proton signals of the internal loop narrowed and new imino proton signals appeared. These 1H NMR spectral changes demonstrated that AMP binding induces the formation of six new mismatched base pairs, causing the aptamer’s internal loop to decrease in size. Additionally, Robertson et al. (Reference Robertson, Harada, Frankel and Wemmer2000) used 1D 1H NMR to monitor a titration of the argininamide-binding DNA aptamer with its target. When argininamide was added to the aptamer, new imino proton signals in the 1H NMR spectra became visible that corresponded to bases in the loop of the aptamer’s hairpin. Further analysis with NOESY data showed that argininamide binding causes three new base pairs to form in the loop and facilitates formation of the aptamer’s binding pocket.
Aside from demonstrating base pair formation, 1D 1H NMR can be used to show a decrease in the number of base pairs with ligand binding. Oguro et al. (Reference Oguro, Yanagida, Fujieda, Amano, Otsu, Sakamoto, Kawai and Matsufuji2017) performed 1D 1H NMR to study conformational changes of the SL_2 RNA spermine-binding aptamer in the presence of its target. The aptamer has a two stem-loop structure consisting of a terminal-side stem (T-Stem) and loop-side stem. With spermine addition, six imino proton signals disappeared from the 1H NMR spectrum of the aptamer and five of these signals corresponded to bases in the T-Stem. This indicated that spermine binding by the aptamer may induce a structural change in which base pairs or the loop of the T-Stem open. Further homonuclear Hartmann–Hahn spectroscopy experiments suggested that the loosely structured nature of the T-Stem is important for spermine binding.
1D 1H NMR can also be employed to study G-quadruplex forming aptamers in the presence of their ligand. Bing et al. (Reference Bing, Zheng, Zhang, Shen, Liu, Wang, Cui, Cao and Shangguan2017) conducted a 1D 1H NMR study to investigate the structural changes of the codeine-binding aptamer with its target. The 1H NMR spectra of the free aptamer had broad and small peaks between 10 and 12 ppm. This indicated that the unbound aptamer may adopt several different quadruplex species. The spectrum also had broad peaks between 8.6–8.8 ppm and 13–14 ppm that were consistent with a triplex. With the addition of codeine, the NMR spectral peaks narrowed and became well-resolved, showing a quadruplex and triplex. These NMR spectral changes suggested that codeine binding induces the aptamer to form a well-defined unique triplex-quadruplex structure. Similarly, Xu et al. (Reference Xu, Zhao, Yu, Wang, Huang, Zhao, Zhou, Li and Liu2022) performed 1D 1H NMR to examine the structural changes of a 36-nucleotide ochratoxin-binding aptamer with its target. The 1H NMR spectra of the free aptamer showed broad imino proton signals between 10 and 14 ppm, suggesting the existence of duplex and G-quadruplex forms without a defined structure. In the presence of ochratoxin, the imino proton signals sharpened and new peaks became visible between 10 and 14 ppm. This suggested that ochratoxin binding induces the aptamer to adopt a well-defined, stabilized duplex-quadruplex structure.
Isothermal titration calorimetry
Isothermal titration calorimetry (ITC) is a powerful label-free method to quantify the affinity and thermodynamic parameters of target binding by aptamers (Feig, Reference Feig2007; Slavkovic and Johnson, Reference Slavkovic and Johnson2018, Reference Slavkovic, Johnson, Mayer and Menger2023). ITC measures the heat change that occurs during an aptamer–ligand binding interaction by titration of ligand into a sample cell containing the aptamer. The resulting ITC thermogram gives the total heat change per injection and allows determination of the binding constant, stoichiometry, and enthalpy change. ITC can be used to demonstrate a ligand-induced folding mechanism of an aptamer–ligand pair by experimentally determining its isobaric heat capacity of binding (ΔCp). ITC is performed to measure the enthalpy change of ligand binding (ΔH) by the aptamer over a range of temperatures (Velázquez-Campoy et al., Reference Velázquez-Campoy, Ohtaka, Nezami, Muzammil and Freire2004). The enthalpy changes are plotted as a function of temperature and fit to a linear plot. The change in heat capacity (ΔCp = ΔH/ΔT) can be obtained from the slope of this line.
Burial of nonpolar surfaces away from an aqueous solvent is associated with a negative ΔCp value (Spolar and Record Jr., 1994). During ligand binding, both burial of the ligand and ligand-induced folding of the aptamer can result in a reduction in the solvent accessible nonpolar surface area (Lin et al., Reference Lin, Yen, Lin, Chang, Louis, Higuchi and Chen2008). The magnitude of the ITC-derived ΔCp of one aptamer can be compared with another aptamer when binding the same ligand. This comparison is especially relevant when considering two aptamers derived from the same parent aptamer, such as the MN4/MN19 cocaine-binding aptamer pair (Figure 2). The ligand would be expected to bury a similar apolar surface area when binding these related aptamers. Therefore, the aptamer with a greater negative ΔCp may undergo ligand-induced folding and conformational rearrangements that bury more of its nonpolar surface. This method has been applied to studying the cocaine, adenosine and runt domain-binding aptamers among others (Neves et al., Reference Neves, Reinstein and Johnson2010; Reinstein et al., Reference Reinstein, Neves, Saad, Boodram, Lombardo, Beckham, Brouwer, Audette, Groves, Wilce and Johnson2011, Reference Reinstein, Yoo, Han, Palmo, Beckham, Wilce and Johnson2013; Amano et al., Reference Amano, Takada, Tanaka, Nakamura, Kawai, Kozu and Sakamoto2016; Zhang et al., Reference Zhang, Oni and Liu2017).
Reinstein et al. (Reference Reinstein, Yoo, Han, Palmo, Beckham, Wilce and Johnson2013) investigated quinine binding by the MN19 and MN4 cocaine-binding aptamers through determining their changes in heat capacity from ITC experiments. The MN19 aptamer, with a three base-pair stem 1, was found to have a more negative ΔCp when binding quinine than the MN4 aptamer with a six base-pair stem 1 (Table 1). Quinine is thought to have comparable apolar surface area burial when binding both aptamers. Thus, the larger magnitude of ΔCp for MN19 was attributed to a ligand-induced folding mechanism that involves more nonpolar surface area of the aptamer being buried with aptamer folding, upon quinine binding. In contrast, the MN4 aptamer is prefolded prior to quinine binding. A similar trend was observed with a larger negative ΔCp obtained for the short stem 1 MN6 cocaine-binding aptamer binding cocaine and the short stem 1 MS2 aptamer binding deoxycholic acid (Table 1) (Neves et al., Reference Neves, Reinstein and Johnson2010; Reinstein et al., Reference Reinstein, Neves, Saad, Boodram, Lombardo, Beckham, Brouwer, Audette, Groves, Wilce and Johnson2011). For each of these cocaine-binding aptamers with a short stem 1, the more negative ΔCp provides evidence of aptamer folding with ligand binding.
Table 1. ITC-derived heat capacity changes (ΔCp) of aptamer–ligand binding interactions

Zhang et al. (Reference Zhang, Oni and Liu2017) studied the binding mechanism of a two-site adenosine triphosphate (ATP)-binding DNA aptamer named Apt2a and a single-site variant aptamer named Apt1a. The enthalpy changes of Apt2a and Apt1a binding adenosine were measured over a range of temperatures by ITC to obtain their heat capacity changes. Apt2a had a greater magnitude of negative ΔCp than Apt1a (Table 1), indicating a relatively larger conformational rearrangement of Apt2a with adenosine binding than Apt1a. Similarly, Amano et al. (Reference Amano, Takada, Tanaka, Nakamura, Kawai, Kozu and Sakamoto2016) examined binding of the AML1 transcription factor runt domain (RD) to the aptamers named S4-S and RDE. Both aptamers exhibited ligand-induced conformational changes with a large negative ΔCp. The greater magnitude of ΔCp for the S4-S aptamer relative to the RDE aptamer indicates that more apolar surface area burial and structural change took place upon S4-S binding RD.
Another way to investigate ligand-induced conformational changes is to compare ITC-derived ΔCp values for two different ligands binding the same aptamer. Sokoloski et al. (Reference Sokoloski, Dombrowski and Bevilacqua2012) performed ITC to obtain heat capacity changes for malachite green (MG) and tetramethylrosamine (TMR) binding to the malachite green RNA aptamer. The binding of MG was found to have a 2.5-fold larger magnitude for its negative heat capacity change than TMR (Table 1). This indicates that greater conformational changes occurred with the aptamer binding MG compared to TMR. This result was consistent with their finding that the MG-bound aptamer had a greater change in solvent accessible surface area than the TMR-bound aptamer by 250 Å2. This change in surface area represented 4.8% of the total accessible surface area.
The ITC-derived ΔCp values of various aptamer–ligand binding pairs are summarized in Table 1 along with whether structural change occurs during their binding interactions. There is no specific threshold or cut-off value for negative ΔCp that indicates whether an aptamer is structure-switching or not. Thus, it is best to compare the relative magnitude of negative ΔCp for pairs of aptamers binding the same ligand rather than evaluating the absolute ΔCp values of aptamers. When comparing two aptamers binding the same ligand, the aptamer with a significantly larger negative ΔCp indicates that it undergoes greater conformational change with ligand binding. This trend is observed between pairs of MN4 and MN19 aptamers binding quinine, the WC and MS2 aptamers binding deoxycholic acid and the Apt1a and Apt2a aptamers binding adenosine (Table 1).
Circular dichroism spectroscopy
Circular dichroism (CD) spectroscopy is a low-resolution structural technique that is used to study the secondary structure of macromolecules (Chang et al., Reference Chang, Chen and Hou2012). CD spectroscopy measures the difference in the absorption of right-handed and left-handed circularly polarized light by optically active biological molecules, such as proteins and nucleic acids. Distinct CD spectral patterns have been identified for various nucleic acid secondary structures, including A-form, B-form, and Z-form helices as well as for the different arrangements formed by DNA G-quadruplexes. These characteristic spectra have peaks in molar ellipticity at particular wavelengths (Kypr et al., Reference Kypr, Kejnovská, Renčiuk and Vorlíčková2009; Chang et al., Reference Chang, Chen and Hou2012). For example, parallel G-quadruplexes typically have CD spectra with a maximum at 260 nm (Kypr et al., Reference Kypr, Kejnovská, Renčiuk and Vorlíčková2009; Chang et al., Reference Chang, Chen and Hou2012). In contrast, antiparallel G-quadruplexes have CD spectra with a maximum at 295 nm and a minimum at 260 nm. Structure-switching DNA aptamers may undergo conformational changes between different secondary structures as a result of ligand binding. Therefore, CD spectroscopy can be used to effectively monitor these ligand-induced structural changes by comparing the CD spectra of free and ligand-bound aptamers.
One way that CD spectroscopy can indicate ligand-induced conformational changes of an aptamer is by a shift in the wavelength of peaks between the free and ligand-bound CD spectra (Lin et al., Reference Lin, Chen, Lee, Chang, Chen and Chen2011; Nakatsuka et al., Reference Nakatsuka, Yang, Abendroth, Cheung, Xu, Yang, Zhao, Zhu, Rim, Yang, Weiss, Stojanović and Andrews2018). Lin et al. (Reference Lin, Chen, Lee, Chang, Chen and Chen2011) used CD to study the secondary structural changes of a 15-nucleotide thrombin-binding aptamer upon binding thrombin. CD spectra of the aptamer alone showed a minimum at 245 nm and a maximum at 280 nm, indicating a B-form DNA conformation. When thrombin was added, shifts of these minimum and maximum peaks occurred to 260 nm and 295 nm, respectively. A new maximum in the CD spectra also became visible at 254 nm. This suggested that the aptamer undergoes a conformational change from B-form DNA to an antiparallel G-quadruplex when binding thrombin (Kypr et al., Reference Kypr, Kejnovská, Renčiuk and Vorlíčková2009; Lin et al., Reference Lin, Chen, Lee, Chang, Chen and Chen2011). Similarly, Nakatsuka et al. (Reference Nakatsuka, Yang, Abendroth, Cheung, Xu, Yang, Zhao, Zhu, Rim, Yang, Weiss, Stojanović and Andrews2018) used CD to investigate the secondary structural rearrangements of a dopamine-binding aptamer upon binding its target. CD spectral shifts showed that dopamine binding by the aptamer causes it to change from a duplex to a different secondary structure. A shift in wavelength indicating structural change with ligand binding by an aptamer was also seen for the vancomycin-binding aptamer vanco-4-trunc (Dauphin-Ducharme et al., Reference Dauphin-Ducharme, Yang, Arroyo-Currás, Ploense, Zhang, Gerson, Kurnik, Kippin, Stojanovic and Plaxco2019).
In addition to CD spectral shifts, changes in the intensity of CD peaks at a given wavelength can indicate conformational changes of aptamers (Chang et al., Reference Chang, Chen and Hou2012; Mehennaoui et al., Reference Mehennaoui, Poorahong, Jimenez and Siaj2019; Aljohani et al., Reference Aljohani, Chinnappan, Alsager, Alzabn, Alhoshani, Weber, Cialla-May, Popp and Zourob2020; Xie et al., Reference Xie, Wu, Chen, Jiang and Sun2022; Xu et al., Reference Xu, Zhao, Yu, Wang, Huang, Zhao, Zhou, Li and Liu2022; Wu et al., Reference Wu, Ranallo, Del Grosso, Chamoro-Garcia, Ennis, Milosavić, Yang, Kippin, Ricci, Stojanovic and Plaxco2023; Alkhamis et al., Reference Alkhamis, Canoura, Wu, Emmons, Wang, Honeywell, Plaxco, Kippin and Xiao2024). Xie et al. (Reference Xie, Wu, Chen, Jiang and Sun2022) used CD to demonstrate the target-induced structural changes of several truncated methamphetamine (MAMP)-binding aptamers. The researchers removed bases from both ends of the original MAMP-binding aptamer to generate destabilized 36 and 38 oligonucleotide versions. CD was performed on the aptamer variants in the free and target-bound states to characterize their conformational changes. Both truncated variants showed an increase in the intensity of a CD maximum at 290 nm with MAMP addition, suggesting structural changes with MAMP binding. The 38-oligonucleotide variant had the largest peak intensity increase, indicating that it undergoes the greatest conformational change of the variants studied. Furthermore, Xu et al. (Reference Xu, Zhao, Yu, Wang, Huang, Zhao, Zhou, Li and Liu2022) conducted CD experiments to monitor the structural changes of a 33-oligonucleotide ochratoxin A (OTA)-binding aptamer. CD spectra of the free OTA-binding aptamer showed the general pattern of an antiparallel G-quadruplex in the presence of Na+ and Mg2+ ions. A significant increase in the intensity of a CD minimum around 260 nm was observed upon OTA addition. This provided evidence in combination with NMR studies that OTA binding induces the aptamer to form a well-defined unique antiparallel G-quadruplex structure. Similarly, Yang et al. (Reference Yang, Wang, Marty and Yang2011) and Fadock and Manderville (Reference Fadock and Manderville2017) performed CD experiments that demonstrate antiparallel G-quadruplex formation of the OTA-binding aptamer with OTA addition. Finally, an example of an aptamer going from unstructured in the free state, with no discernable peaks in the CD spectrum, to a structured ligand-bound aptamer is the methotrexate-binding aptamer from the Plaxco group (Wu et al., Reference Wu, Ranallo, Del Grosso, Chamoro-Garcia, Ennis, Milosavić, Yang, Kippin, Ricci, Stojanovic and Plaxco2023).
Thermal melt analysis
Ultraviolet–visible (UV) absorption spectroscopy is a classic biophysical method that can be used to study the thermal stability of macromolecules by monitoring their unfolding when heated (Mergny and Lacroix, Reference Mergny and Lacroix2003). Duplex nucleic acids have a maximum UV absorption at 260 nm and exhibit hyperchromicity as their absorbance at 260 nm increases upon denaturation. During a thermal unfolding experiment monitored by UV, the absorbance of a nucleic acid sample at 260 nm is measured as a function of temperature as shown in Figure 3. A sigmoidal thermal melt curve indicates the transition of the nucleic acid from a folded duplex conformation to an unfolded single-stranded state (solid line; Figure 3). However, a straight line thermal melt suggests that the nucleic acid originally exists in a single-stranded state and little or no unfolding occurs during heating (dashed line; Figure 3). UV melting curves can be obtained individually for free and ligand-bound aptamers and compared. A change from a straight line UV melt curve for a free aptamer to a sigmoidal UV melt curve for a ligand-bound aptamer provides evidence of ligand-induced folding of the aptamer.
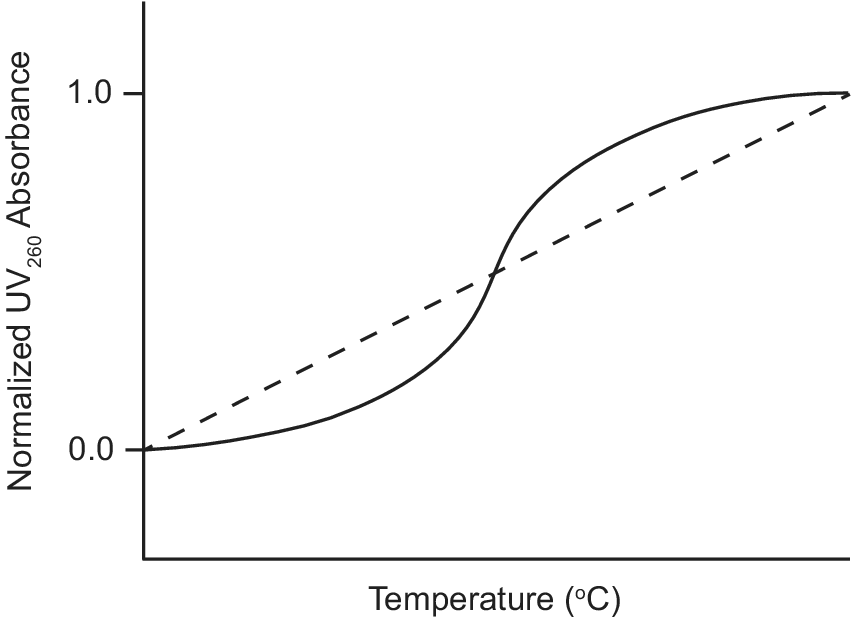
Figure 3. Example of UV thermal melt curves of an aptamer that undergoes ligand-induced folding. UV thermal melt curve of an unfolded free aptamer shown by the dashed line. UV thermal melt curve of a folded ligand-bound aptamer shown by the solid line.
Neves et al. (Reference Neves, Shoara, Reinstein, Abbasi Borhani, Martin and Johnson2017) used UV-spectroscopy to investigate how the length of stem 1 of the three-way junction cocaine-binding aptamer affects its ligand-induced conformational change. The authors performed UV thermal melts on cocaine-binding aptamers with different lengths of stem 1. For the OR8 aptamer with a stem 1 of two base pairs and the MN19 aptamer with a stem 1 of three base pairs, the free aptamers exhibited straight line UV thermal melts rather than sigmoidal curves. This suggested that OR8 and MN19 aptamers are not completely folded in their unbound state, but rather loosely or partially folded. Hence, there is no visible transition to an unfolded state when the temperature increases. In contrast, UV melts of these two aptamers bound to quinine exhibited sigmoidal denaturation curves with measurable melt temperatures (Neves et al., Reference Neves, Shoara, Reinstein, Abbasi Borhani, Martin and Johnson2017). This indicated that OR8 and MN19 aptamers are folded when bound to the ligand quinine and transition to an unfolded state during heating. Overall, these results provide support for the ligand-induced folding mechanism of OR8 and MN19 cocaine-binding aptamers and provide a guide when looking at other aptamers that may undergo ligand-induced folding.
Differential scanning calorimetry (DSC) is a technique that can be used in a complementary fashion to UV-based melts to measure the thermal stability of both free and ligand-bound aptamers. In addition to an unfolding temperature, DSC also provides a wealth of thermodynamic data for folding and unfolding. DSC methods have been applied to the cocaine-binding aptamer system of MN4 and MN19 to investigate the difference between an unfolded unbound aptamer (free MN19) and a folded bound aptamer (cocaine or quinine-bound MN19). There was a negligible unfolding signal for the free MN19 aptamer while an unfolding peak was observed, as expected, for the structured ligand-bound MN19 aptamer (Harkness et al., Reference Harkness, Slavkovic, Johnson and Mittermaier2016).
Small-angle X-ray scattering
Small-angle X-ray scattering (SAXS) is a method used to characterize the global structure of biological macromolecules by providing information on their molecular size, shape, and oligomeric state (Baird and Ferré-D’Amaré, Reference Baird, Ferré-D’Amaré, Lafontaine and Dubé2014). In a SAXS experiment, the intensities of scattered X-rays by a sample of the biological molecule are measured as a function of the scattering angle. From the SAXS data, parameters such as the radius of gyration (Rg) can be obtained as an indication of the overall size of the biological molecule (Kikhney and Svergun, Reference Kikhney and Svergun2015). The Rg represents the root mean square distance of the molecule in relation to its centre of mass. SAXS data can also be used to produce a pairwise distance distribution function (PDDF), which represents the distribution of distances between pairs of atoms within the macromolecule and provides its maximum diameter (D max). Additionally, SAXS data can be utilized to generate three-dimensional ab initio low-resolution reconstructions of the shape of the biomolecule. SAXS can effectively provide insight into ligand-induced folding and compaction of aptamers by comparing SAXS-derived Rg, PDDFs and ab initio models of free and ligand-bound aptamers.
SAXS has been widely used to investigate the conformational changes of riboswitches in response to metabolite binding (Lipfert et al., Reference Lipfert, Das, Chu, Kudaravalli, Boyd, Herschlag and Doniach2007; Baird and Ferré-D’Amaré, Reference Baird and Ferré-D’Amaré2010; Baird et al., Reference Baird, Kulshina and Ferré-D’Amaré2010; Chen et al., Reference Chen, Zuo, Wang and Dayie2011). Chen et al. (Reference Chen, Zuo, Wang and Dayie2011) used SAXS to follow the structural changes of the SAM-II riboswitch in response to binding its metabolite S-adenosyl methionine (SAM). Upon addition of SAM, the riboswitch undergoes compaction with a decreased Rg from 31.7 to 20.7 Å and reduced D max from 112 Å to 70 Å. Low resolution ab initio modeling revealed that the aptamer domain of the unbound riboswitch exists in an elongated conformation whereas the aptamer domain of the riboswitch bound to SAM exhibits a more compact structure. Complementary 1D NMR experiments demonstrated that the SAM-II riboswitch compaction induced by metabolite-binding is associated with secondary and tertiary structural changes.
Baird and Ferré-D’Amaré (Reference Baird and Ferré-D’Amaré2010) also performed SAXS to study the global structural changes of the E. coli thiM thiamine pyrophosphate (TPP)-responsive riboswitch aptamer domain with metabolite binding. At physiologic Mg2+ concentrations, the TPP-responsive riboswitch alone had an Rg of 27.5 Å and addition of its metabolite TPP resulted in a reduced Rg of 24.1 Å. Low-resolution ab initio reconstructions from SAXS data supported this ligand-induced compaction as it showed that the unbound TPP-responsive riboswitch had a more elongated form than the riboswitch bound to its metabolite. Thus, SAXS experiments suggested that the thiM TPP-responsive riboswitch aptamer domain acquires distinct free and metabolite-bound conformations. Baird and Ferré-D’Amaré (Reference Baird and Ferré-D’Amaré2010) and Baird et al. (Reference Baird, Kulshina and Ferré-D’Amaré2010) also used SAXS to show that the class I SAM-responsive riboswitch and cyclic diguanylate riboswitch aptamer domains undergo compaction and global conformational changes upon binding their metabolites.
In addition to its application in studying riboswitches, SAXS has been used to investigate the conformational changes of in vitro selected DNA aptamers in response to ligand binding. Reinstein et al. (Reference Reinstein, Yoo, Han, Palmo, Beckham, Wilce and Johnson2013) performed SAXS to study the ligand-induced folding of the MN19 cocaine-binding aptamer in comparison to the prefolded MN4 cocaine-binding aptamer. PDDFs for the MN19 aptamer showed notable differences between its free, quinine-bound and cocaine-bound forms. For example, a shoulder at approximately 35 Å was visible in the PDDF of the free MN19 aptamer but absent in the quinine-bound and cocaine-bound forms of the aptamer. Additionally, a larger amount of variation was found among SAXS-derived ab initio reconstructions for these three forms of the MN19 aptamer compared to the MN4 aptamer. Together, these SAXS findings provide support for the ligand-induced conformational changes of the MN19 aptamer when binding quinine and cocaine.
Schmidt et al. (Reference Schmidt, Perbandt, Klussmann and Betzel2020) also used SAXS to investigate the interaction of the L-RNA aptamer NOX-B11 with its target, active ghrelin. SAXS-derived ab initio reconstructions of the NOX-B11 aptamer alone showed an elongated structure with a length of about 7.7 nm and diameter of 4 nm. In contrast, ab initio models of the NOX-B11-ghrelin complex revealed a more compact structure with a shorter length of about 5.8 nm and diameter of 4.2 nm. PDDFs also demonstrated that the NOX-B11-ghrelin complex is more compact as it had a smaller D max of approximately 6.2 nm relative to NOX-B11 alone with a D max of 7.8 nm. Overall, these SAXS data reveal that the NOX-B11 aptamer undergoes a conformational change to a more compact form as a result of binding ghrelin.
Native ion mobility-mass spectrometry
Native mass spectrometry coupled to ion mobility (IM-MS) is a valuable biophysical method to study non-covalent assemblies in the gas-phase, including aptamer–ligand interactions (Konijnenberg et al., Reference Konijnenberg, Butterer and Sobott2013; Largy et al., Reference Largy, König, Ghosh, Ghosh, Benabou, Rosu and Gabelica2022). Electrospray ionization can take biomolecular complexes from solution into the gas-phase with their native conformation retained for passage through ion mobility and mass spectrometers. Native IM-MS provides insight into the binding stoichiometry as well as the size, shape, and mass of the non-covalent complex (Allison et al., Reference Allison, Barran, Cianférani, Degiacomi, Gabelica, Grandori, Marklund, Menneteau, Migas, Politis, Sharon, Sobott, Thalassinos and Benesch2020).
Daems et al. (Reference Daems, Dewaele, Barylyuk, De Wael and Sobott2021) used native IM-MS to study quinine-binding by a set of different cocaine-binding aptamers. Native IM-MS measurements were taken for free and quinine-bound aptamers in 5+ ionization modes and their arrival times were extracted as a measure of ion mobility. Significant arrival time increases were observed for the aptamer–quinine complexes relative to free aptamers. The addition of quinine to the total volume of the aptamer–quinine complex could not alone account for these arrival time differences. Daems et al. proposed that the increased arrival times were partly due to conformational changes of the aptamer with ligand binding that causes a slight elongation of its gas-phase structure. Specifically, the MN19 aptamer had an arrival time increase of 6.4% whereas the MN4 aptamer had a smaller arrival time increase of 4.2%. The larger arrival time difference for the MN19 aptamer suggested that its loosely folded-free structure undergoes greater structural change when binding quinine. In contrast, the MN4 aptamer with a more rigid, prefolded structure undergoes less conformational change with ligand binding as shown by its smaller arrival time difference. These results are consistent with NMR, ITC, and SAXS studies discussed earlier in this review that demonstrate the ligand-induced conformational changes of the MN19 aptamer (Neves et al., Reference Neves, Reinstein and Johnson2010; Reinstein et al., Reference Reinstein, Yoo, Han, Palmo, Beckham, Wilce and Johnson2013).
Fluorescence-based methods
Aptamers are frequently employed in fluorescent biosensors to detect and quantify specific ligand concentrations (Wang et al., Reference Wang, Zhang, Cai, Cai and Gao2011). These fluorescence-based methods are more often used as a detection method for an analyte rather than a method to demonstrate the occurrence of structural change with ligand binding. In these applications, the aptamer is often tagged, and structural change is assumed to occur based on the change in fluorescent output. These sensors can produce a measurable change in fluorescence that coincides with a fluorescently labeled aptamer’s conformational changes upon target binding. In this way, the fluorescence output indicates the extent of ligand binding and allows measurement of ligand concentrations. Fluorescent biosensors often use fluorescence quenching or de-quenching and fluorescence resonance energy transfer (FRET) as distance-dependent phenomena to report on an aptamer’s structural changes with ligand binding.
Fluorescence quenching occurs when an excited fluorophore in close proximity to a non-fluorescent quencher transfers its energy to the quencher without emission of light (Lyklema, Reference Lyklema2000). This phenomenon is measured as a decrease in fluorescence intensity of the fluorophore’s emission by fluorescence spectroscopy. Alternatively, when a fluorophore is moved away from a quencher, fluorescence de-quenching takes place, and the fluorescence intensity of the fluorophore increases. FRET, on the other hand, involves a transfer of energy from an excited donor fluorophore to a second nearby acceptor fluorophore that then emits fluorescence (Kaur et al., Reference Kaur, Kaur and Ahuja2020; Lyklema, Reference Lyklema2000). For FRET to happen, the emission spectrum of the donor must have sufficient overlap with the absorption spectrum of the acceptor and the two fluorophores must be about 1–10 nm apart. FRET is detected by a reduction in the excited donor’s fluorescence intensity and an increase in the acceptor’s emission fluorescence intensity by fluorescence spectroscopy. The ratio of fluorescence emission between the two fluorophores serves as a measure of the FRET signal. Fluorescence quenching and FRET can both be used to monitor structural changes of aptamers upon ligand binding in fluorescent sensors. Feagin et al. (Reference Feagin, Maganzini and Soh2018) classified the use of structure-switching aptamers in fluorescent biosensors into several types of applications, including aptamer beacons, strand-displacement methods, and split aptamers (Feagin et al., Reference Feagin, Maganzini and Soh2018). It is possible that measurement of fluorescent lifetime, as opposed to intensity, may be used as a way to probe changes in fluorescent properties.
Fluorescence quenching and FRET-based aptamer beacon sensors
Many structure-switching aptamers have been employed in fluorescent aptamer beacons. In an aptamer beacon, ligand binding to an aptamer causes conformational changes that alter the distance between the aptamer’s covalently attached fluorophore and quencher or second fluorophore, resulting in a measurable change in fluorescence (Figure 4) (Perez-Gonzalez et al., Reference Perez-Gonzalez, Lafontaine and Penedo2016). Hamaguchi et al. (Reference Hamaguchi, Ellington and Stanton2001) used the thrombin-binding aptamer to design a fluorescent turn-on aptamer beacon that detects thrombin (Figure 4). Complementary nucleotides were introduced to the 5′ end of the aptamer to hybridize with its 3′ end and form a closed hairpin. The fluorophore (fluorescein) and quencher (dabcyl) were attached to the 5′ and 3′ ends of the aptamer, respectively. It was hypothesized that the closed stem-loop would be stable in the absence of thrombin and thrombin-binding would shift the equilibrium toward a G-quadruplex structure in which the fluorophore and quencher become separated (Figure 4). Without thrombin, minimal fluorescence was detected due to fluorescence quenching in the closed hairpin. However, addition of thrombin to saturating concentrations resulted in a 2.5-fold enhancement in fluorescence intensity for the beacon construct that was extended by five nucleotides. This rise in fluorescence provided evidence of the thrombin-induced structural change of the aptamer from a closed hairpin to G-quadruplex conformation.

Figure 4. Fluorescent turn-on aptamer beacon. Structural change of aptamer with ligand binding results in an increase in fluorescent output (i.e., fluorescence de-quenching) by separating its fluorophore and quencher-labeled ends (complementary nucleotides added to the 5′ end of the thrombin-binding aptamer are shown in red) (Hamaguchi et al., Reference Hamaguchi, Ellington and Stanton2001).
Li et al. (Reference Li, Fang and Tan2002) also employed the thrombin-binding aptamer to construct their quenching-based turn-off aptamer beacon (Figure 5). Binding thrombin shifts the equilibrium of the aptamer from a random coil conformation to a G-quadruplex state. The two ends of the aptamer were labeled with carboxyfluorescein (FAM) as fluorophore and dabcyl as quencher such that they were far away in the random coil, but close together in the G-quadruplex conformation. Addition of thrombin was found to reduce the fluorescence intensity of the aptamer beacon by 60%. This indicated that the fluorophore and quencher came together by the thrombin-induced conformational change of the aptamer to a G-quadruplex. A similarly designed turn-off aptamer beacon that uses fluorescence quenching demonstrates the structure-switching binding mechanism of the dopamine-binding aptamer (Liu et al., Reference Liu, Hou, Chen and Liu2021).

Figure 5. Fluorescent turn-off aptamer beacon. Conformational change of aptamer with ligand binding results in a decrease in fluorescent output (i.e., fluorescence quenching) by bringing together its fluorophore and quencher-labeled ends (Li et al., Reference Li, Fang and Tan2002).
In addition, FRET-based aptamer beacons have been used to show ligand-induced conformational changes of a variety of aptamers (Li et al., Reference Li, Fang and Tan2002, Reference Li, Yang, Wang, Tan, Li and Ma2008; Ueyama et al., Reference Ueyama, Takagi and Takenaka2002; Liu et al., Reference Liu, Hou, Chen and Liu2021). Li et al. (Reference Li, Yang, Wang, Tan, Li and Ma2008) designed a FRET-based biosensor using the angiogenin-binding aptamer (Figure 6). Binding angiogenin shifts the equilibrium of the aptamer from an unfolded random coil to a folded structure that resembles a stem-loop. In the aptamer beacon, the 5′ and 3′ ends of the aptamer were modified with FAM as the donor and carboxytetramethylrhodamine (TAMRA) as the acceptor, respectively. The labeled 5′ and 3′ termini were far apart in the random coil, but close together in the stem-loop secondary structure. When angiogenin was added, there was an enhanced FRET signal detected. The fluorescence intensity of the acceptor TAMRA at 577 nm increased while that of the donor FAM at 520 nm decreased in the presence of angiogenin. This provided evidence that angiogenin binding induced a structural change in the aptamer to a stem-loop that brought together its FAM and TAMRA-labeled termini for energy transfer. FRET-based aptamer beacons have also been designed using thrombin, dopamine and K+-binding aptamers and demonstrate their ligand-induced conformational changes (Li et al., Reference Li, Fang and Tan2002; Ueyama et al., Reference Ueyama, Takagi and Takenaka2002; Liu et al., Reference Liu, Hou, Chen and Liu2021).

Figure 6. FRET-based aptamer beacon. Structural change of aptamer with ligand binding produces an increase in FRET signal by bringing together its donor and acceptor-labeled ends (Li et al., Reference Li, Yang, Wang, Tan, Li and Ma2008).
Fluorescent aptamer sensors using complementary displacement strand
Nutiu et al. developed a general method for creating fluorescent signaling aptamers in which a DNA/DNA duplex changes structure to a DNA/ligand complex upon ligand binding (Figure 7) (Nutiu and Li, Reference Nutiu and Li2003; Lau and Li, Reference Lau, Li, Gu and Kim2014). Their strategy makes use of a DNA aptamer labeled with fluorophore (FDNA) and a short oligonucleotide complementary to the aptamer labeled with quencher (QDNA). Without ligand, the aptamer hybridizes with QDNA to form a DNA/DNA duplex. In this conformation, the fluorophore and quencher are located near each other, resulting in fluorescence quenching. However, in the presence of ligand, QDNA is displaced from the aptamer by ligand binding and the aptamer–ligand complex forms. This ligand-induced structural change is shown by an increase in fluorescence intensity of the fluorophore upon ligand addition.
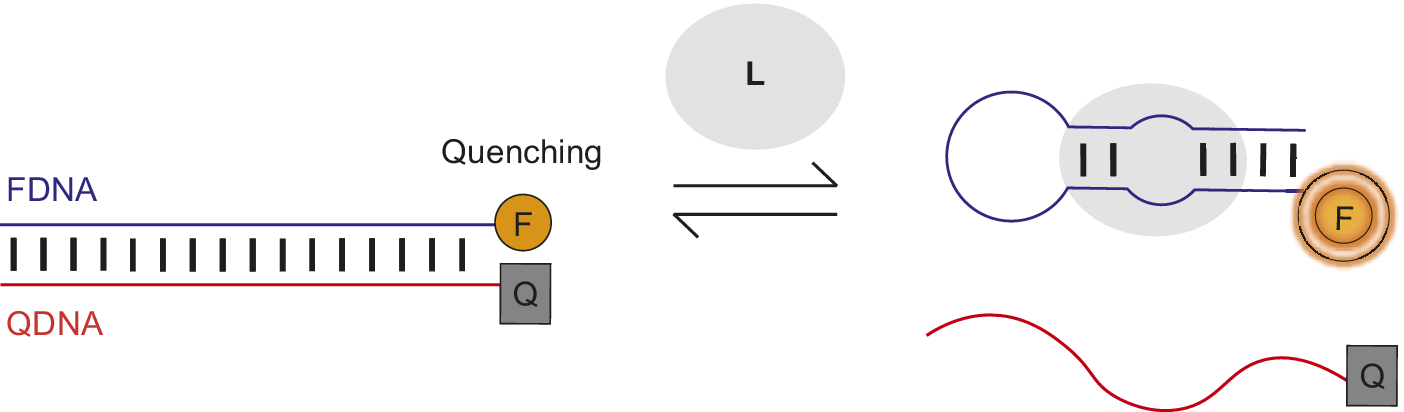
Figure 7. Fluorescent signaling aptamer using strand displacement. Ligand binding to aptamer labeled with fluorophore (FDNA) disrupts hybridization to a complementary strand labeled with quencher (QDNA) and results in an increase in fluorescence. A scheme similar to the one illustrated has been used with the ATP binding DNA aptamer (Nutiu and Li, Reference Nutiu and Li2003).
Qiao et al. (Reference Qiao, Guo, Wen, Chen, Xu, Zheng, Cheng, Xue and Wang2021) applied this strand displacement strategy when designing a structure-switching sensor to detect the mycotoxin aflatoxin M1 (AFM1) in milk. The AFM1-binding aptamer was labeled with the fluorophore FAM and a complementary DNA (cDNA) was modified with the quencher TAMRA. Without AFM1, the FAM-labeled aptamer and TAMRA-labeled cDNA hybridize together, resulting in fluorescence quenching (Figure 7). However, when AFM1 was added, there was an 11-fold rise in fluorescence intensity. This fluorescence de-quenching upon AFM1 addition provided evidence of the ligand-induced structural change of TAMRA-cDNA dissociation and formation of the AFM1/aptamer complex. Structure-switching sensors involving displacement of a complementary oligonucleotide from an aptamer by ligand to generate a fluorescent or FRET signal have been used to detect the antibiotic kanamycin and cytokine interferon-gamma (Tuleuova et al., Reference Tuleuova, Jones, Yan, Ramanculov, Yokobayashi and Revzin2010; Ma et al., Reference Ma, Qiao, Sun, Su, Sun and Zhang2019). Nutiu and Li (Reference Nutiu and Li2003) also successfully applied their complementary displacement strand strategy to ATP and thrombin-binding aptamers using a tripartite system.
Split aptamer fluorescent and FRET-based sensors
Aptamers can be divided into two or more fragments (split) that associate upon ligand binding. The structural change of two aptamer strands coming together can be signified by changes in fluorescence or FRET signal using fluorescent-labeling of the strands. Stojanovic et al. (Reference Stojanovic, De Prada and Landry2000) designed a fluorescent sensor to detect cocaine based on the self-assembly of a split cocaine-binding aptamer (Figure 8). The three-way junction aptamer was divided into two fragments at a loop. The 5′ end of one aptamer fragment was modified with the fluorophore FAM while the 3′ end of the other aptamer fragment was labeled with the quencher dabcyl. It was predicted that the aptamer would exist primarily as two individual strands in the absence of cocaine and that cocaine addition would shift the equilibrium toward an assembled aptamer in which the fluorophore and quencher on the two strands come together. Upon cocaine addition, fluorescent emission by the fluorophore was quenched to 65% of its original emission without cocaine. This fluorescence quenching demonstrated the cocaine-induced assembly of individual aptamer subunits to form the complete aptamer. A split-aptamer system was also successfully used in a fluorescence quenching sensor to detect 19-nortestosterone (Bai et al., Reference Bai, Zhu, Liu, Yan, Yang and Chen2016).

Figure 8. Split aptamer fluorescent sensor. Assembly of split aptamer fragments upon ligand binding results in a decrease in fluorescent output by bringing together their fluorophore and quencher-labeled ends. This scheme is adapted from one used for the cocaine-binding aptamer (Stojanovic et al., Reference Stojanovic, De Prada and Landry2000).
In addition, a FRET-based sensor was developed by Liu et al. (Reference Liu, Shi, Hua, Huang, Su, Fan, Wang and Huang2014) using a split version of the thrombin-binding aptamer. The aptamer was divided into two strands, one of which was covalently modified with FAM as the FRET acceptor. A water-soluble polycationic polymer (PFEP) that has high emission of fluorescence served as the FRET donor. Without thrombin, the positively charged PFEP formed complexes with fragments of the split thrombin-binding aptamer through electrostatic interactions. An efficient FRET signal occurred between the closely interacting PFEP and FAM-labeled aptamer strand. When thrombin was added, the two split aptamer strands assembled into a G-quadruplex induced by thrombin binding. The large size of the bound thrombin increased the distance between the PFEP and FAM-labeled aptamer strand as part of the G-quadruplex, leading to a weakened FRET signal. This decrease in FRET signal served as evidence of the thrombin-induced conformational change of the split aptamer strands assembling into a G-quadruplex.
Conclusions
Here, we have reviewed different biophysical tools readily available to monitor changes in the structure of aptamers when they bind their ligand. These tools provide distinct information (Table 2) on these molecules which can prove essential information into their designs and thus their translation in different applications, especially biosensors.
Table 2. Summary of biophysical methods to demonstrate structure-switching binding mechanism of aptamers
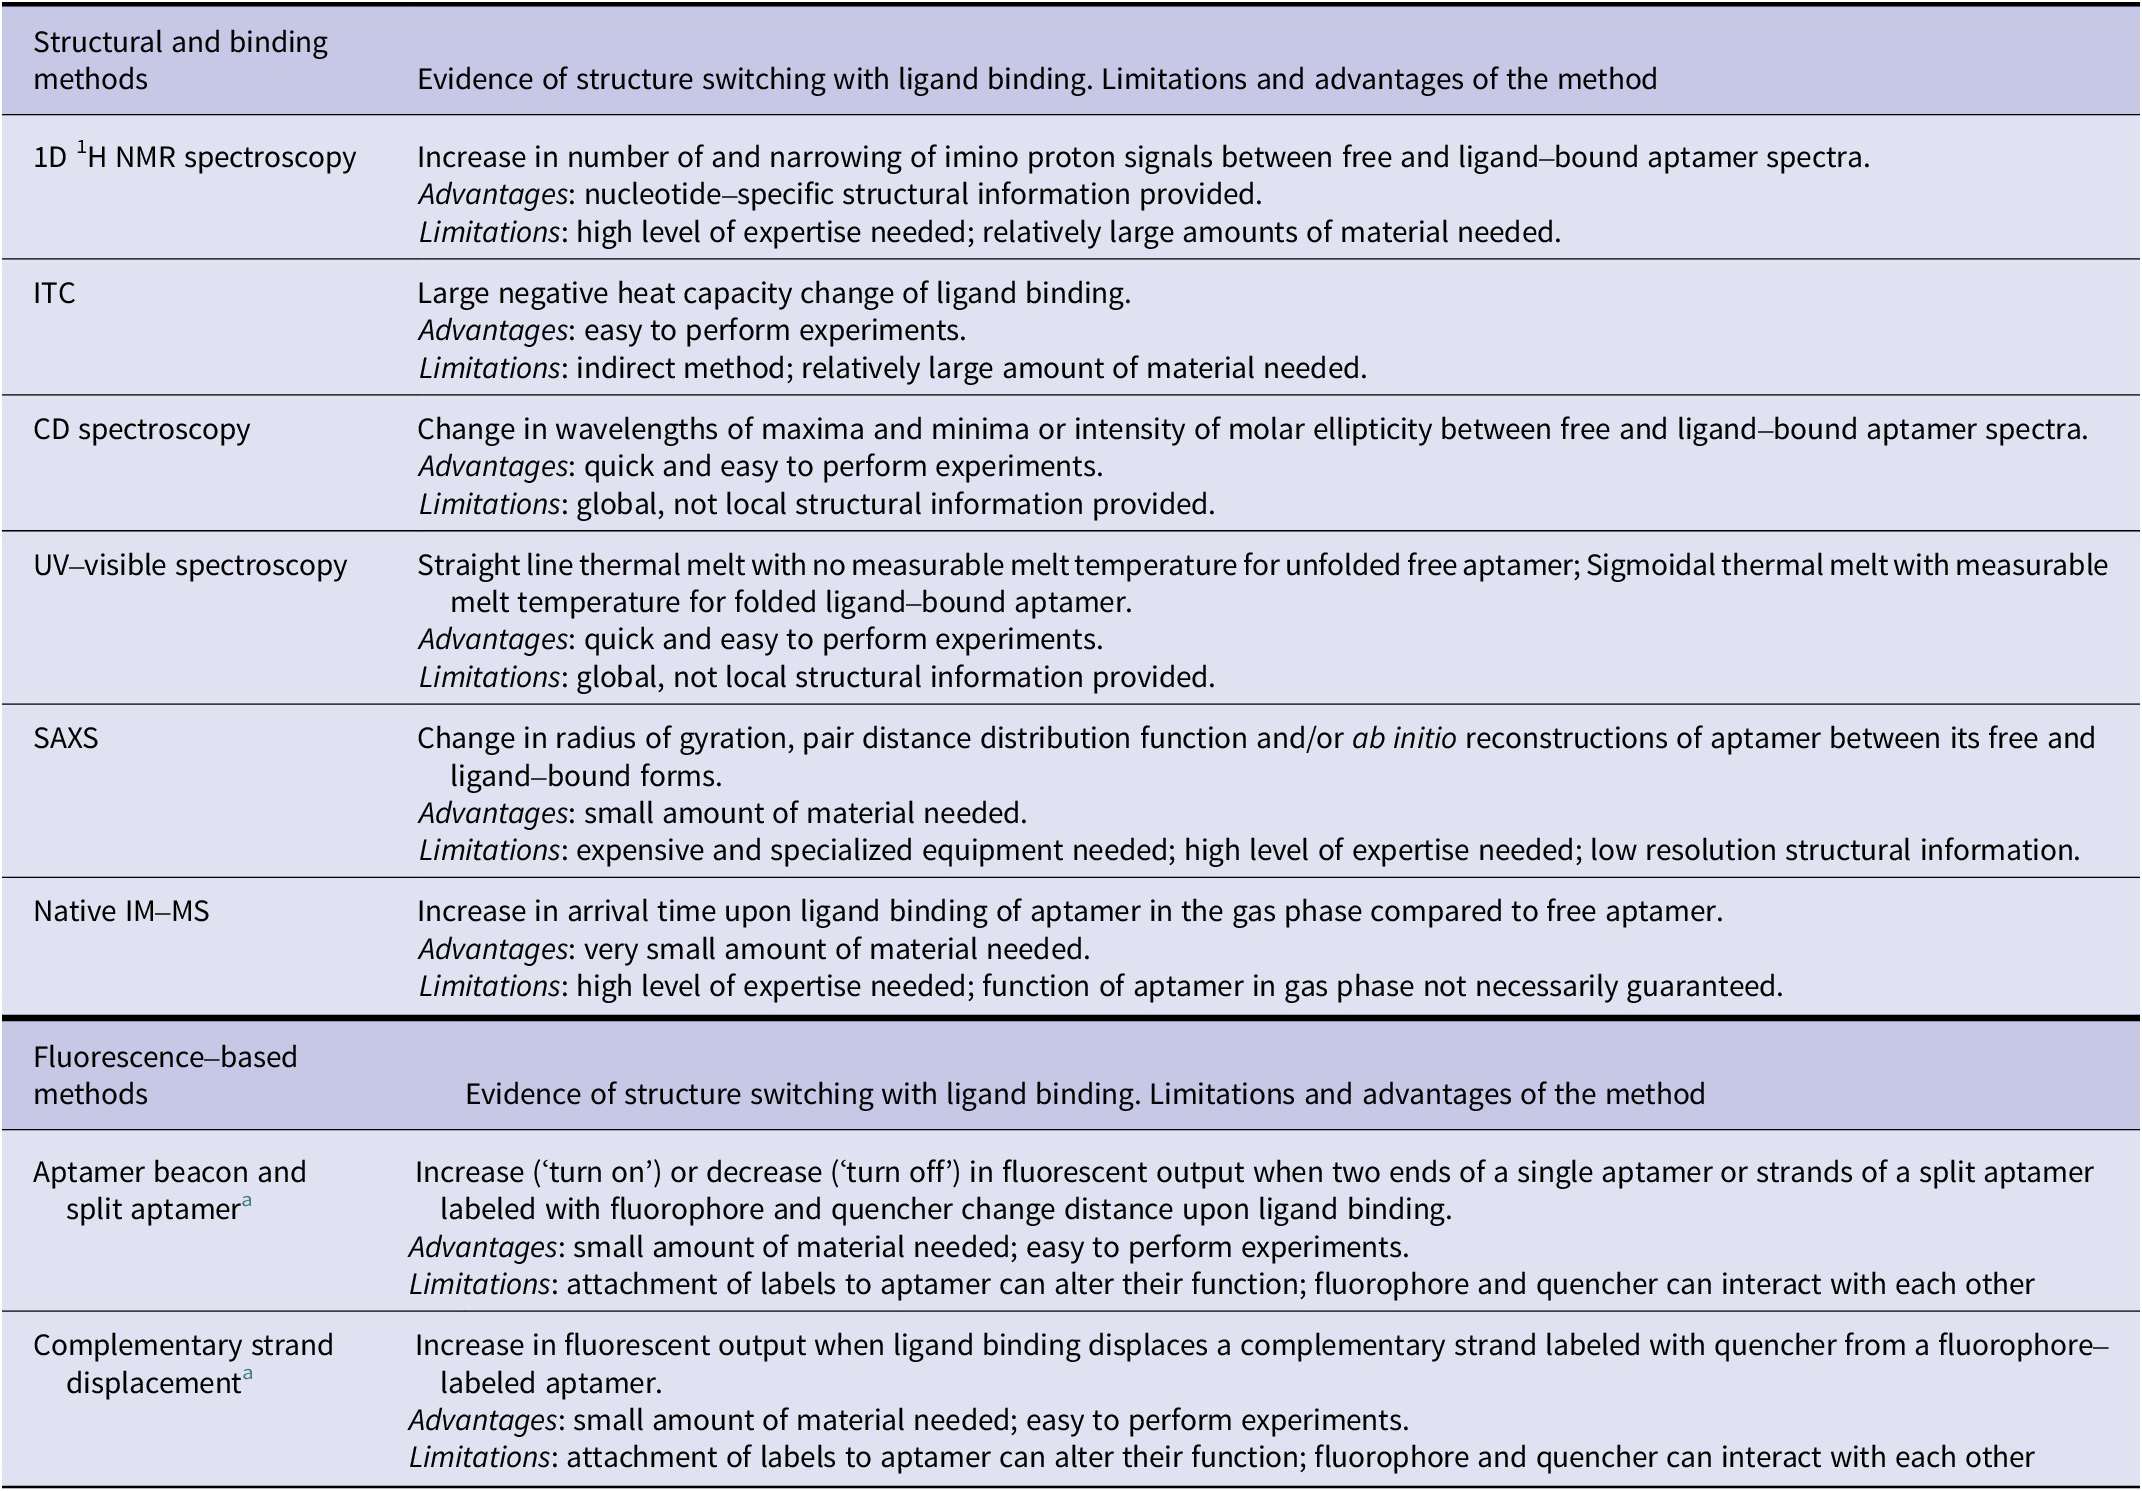
a Changes in fluorescence resonance energy transfer (FRET) signal can be measured using two fluorophores instead of fluorescence quenching/de-quenching to demonstrate the structure-switching binding mechanism.
The related field of riboswitches can provide insight into future directions for the field of biophysical analysis of structure-switching aptamers (Kavita and Breaker, Reference Kavita and Breaker2023). For riboswitches, many X-ray crystallography-based structures of free and bound molecules have been determined allowing for a detailed structural comparison between the free and bound structures. In contrast, there are relatively few structures of small molecule-binding aptamers, though this is not the case for protein-binding aptamers (Gelinas et al., Reference Gelinas, Davies and Janjic2016). More high-resolution structural information on aptamers, especially on DNA aptamer-small molecule interactions, is necessary to provide further insights into aptamer–ligand interactions. However, if the goal is to provide evidence of large-scale structure switching, then this is not strictly necessary. Additionally, single molecule methods have been commonly applied to riboswitches (Boudreault et al., Reference Boudreault, Perez-Gonzalez, Penedo and Lafontaine2015). While this type of analysis has been reported for aptamers (Morris et al., Reference Morris, Peterson, Heemstra and Harris2018), it has not been widely applied for studying SELEX-derived aptamers (Morris et al., Reference Morris, Peterson, Heemstra and Harris2018). Some classic biochemical methods such as chemical probing, for example, SHAPE analysis (Weeks, Reference Weeks2021), and electrophoresis-based techniques have not been widely employed and may provide complementary information with results provided by the techniques discussed in this review.
Each of the methods presented comes with its advantages and limitations (Table 2). While a single method can provide evidence of structural change, we advise the use of two or more methods for the most robust demonstration of ligand-induced structure switching. We anticipate that having a deeper understanding of the different capabilities of these methods can help researchers in rapidly acquiring insights into aptamer structure switching and further accelerate aptamer-based biosensor developments.
Acknowledgements
We thank past and present members of the Johnson Lab for critical reading of the manuscript.
Financial support
This work was supported by NSERC Discovery grants to P.D.D. and P.E.J.
Competing interest
The authors declare none.


 Open access