


Introduction
Phenology is the field of science concerned with cyclic and seasonal natural phenomena, especially in relation to plant and animal life and climate. The term phenology is also used in geoscience; thus, in glaciology, freshwater ice scientists refer to freeze-up/break-up and duration of ice on lakes and rivers as ice phenology. Changes in ice phenology can have significant consequences, as exemplified by the decrease in ice duration and its effects on the aquatic ecosystem at the Experimental Lakes in northern Ontario, Canada (Reference SchindlerSchindler and others, 1990).
Freeze-up is often defined as the day/date on which a lake or river reach attains a complete ice cover. Likewise, breakup is often defined as the day/date on which a lake or river reach is completely clear of ice. Thus, freeze-up and breakup can be regarded as events (Reference Jeffries, Morris, Duguay, Williams and FerrignoJeffries and others, in press). Freeze-up and break-up can also be regarded as processes or sequences of processes (Reference Jeffries, Morris, Duguay, Williams and FerrignoJeffries and others, in press). That is, freeze-up is the sequence of processes that occurs between initial ice formation and establishment of a complete ice cover. Similarly, break-up is the sequence of processes that occurs between the exposure of bare ice (once all snow has melted) and complete disappearance of the ice cover.
A substantial body of literature describes the dependence of freshwater ice phenology on air temperature (e.g. Reference WilliamsWilliams, 1965; Reference BilelloBilello, 1980; Reference Palecki and BarryPalecki and Barry, 1986) and the value of freshwater ice phenology as an indicator of climate variability and change (e.g. Reference SimojokiSimojoki, 1961; Reference Tanaka and YoshinoTanaka and Yoshino, 1982; Reference MagnusonMagnuson and others, 2000). Because freeze-up and break-up can be related closely to temperature indices, freshwater ice growth and decay has been described as a relatively simple seasonal system (Reference MichelMichel, 1971). With the exception of Reference BilelloBilello (1980), the relationship between freshwater ice phenology and air temperature in Alaska, USA, has not received the same level of attention as it has elsewhere despite the apparent simplicity of the freshwater ice–weather–climate system.
Weather and climate are not the only determinants of freshwater ice phenology. It is also affected by a number of other factors, including: (1) morphometry (e.g. area, depth and volume, which affect wind fetch, water circulation and temperature, and heat storage; e.g. Reference ScottScott, 1964; Reference Skorve and VincentSkorve and Vincent, 1987; Reference Stewart and HaugenStewart and Haugen, 1990); (2) rate and temperature of inflow by streams and rivers (e.g. Reference Skorve and VincentSkorve and Vincent, 1987; Reference Barry, Maslanik, Barry, Goodison and LeDrewBarry and Maslanik, 1993); and (3) ice thickness and composition, i.e. congelation ice and snow ice (e.g. Reference WilliamsWilliams, 1965; Reference BilelloBilello, 1980; Reference MichelMichel and others, 1986).
Ice thickness affects ice decay, with thick ice generally surviving longer than thin ice (e.g. Reference WilliamsWilliams, 1965). However, while some sites have consistent thickness-determined patterns of break-up each year, others have more erratic and unpredictable patterns due to the effects of wind and water currents (Reference BilelloBilello, 1980). Ice decay is affected by snow ice, and it delays break-up because it has a higher albedo than congelation ice (Reference MichelMichel and others, 1986). Intuitively it makes sense that snow ice must affect ice decay, but very little is actually known about the role of snow ice in freshwater ice break-up.
This paper describes the results of a 5 year (2001–06) study of ice phenology on 11 ponds in the boreal forest of central Alaska. The ponds, all small and shallow with negligible inflow and outflow, are spaced only a few kilometers apart in the same valley. With some complicating factors eliminated, or at least reduced in influence (e.g. shallow water reduces the effects of heat storage and circulation), the seasonal ice system should be relatively simple and offer the opportunity to gain some new insights into freshwater ice phenology, at least for small, shallow ponds in central Alaska.
We describe (1) how long it takes for the ponds to achieve a 100% ice cover (the freeze-up event; henceforth FU) in the autumn and 0% ice cover (the break-up event; henceforth BU) in the spring, (2) interannual variability in the sequence of FU and BU and the role of water depth and area, and (3) the dependence of FU and BU on air temperature. In addition, we examine the dependence of duration on maximum ice thickness, and examine the role of maximum ice thickness and snow ice amount on BU. On the few occasions that the terms freeze-up and break-up are used, they refer to the periods of freeze-up and break-up processes that occur prior to the final FU and BU events, respectively (see second paragraph).
Study Sites
The 11 ponds are located near the University of Alaska Fairbanks Poker Flat Research Range (PFRR, 65.12˚ N, 147.47˚ W), 50km northeast of Fairbanks, Alaska. They lie along an 11 km stretch of the Steese Highway in the Chatanika River valley. One of the ponds, MST pond, is a natural water body on the research range. The other ten ponds are gravel pits that filled with water once they were abandoned after highway construction. Some of the ponds have been named by the State of Alaska for their distance (in miles) along the highway, and with the exception of MST pond we use this convention for all pond names (Table 1). PFRR, located at 29.5 mile Steese Highway, operates an automatic weather station.
Table 1. Geographic coordinates, area and maximum depth of ponds

The ponds are small and shallow, with none exceeding 21 000 m2 in area or 4.3 m in depth (Table 1). Eight ponds are particularly sheltered from the wind and solar radiation, by dense forest which comes to within 5 m of the water’s edge. At just three ponds (30.3, 30.4 and MST) the forest is both thinner and set back >10m from the water’s edge, thereby allowing more exposure to wind and solar radiation. Water levels rise and fall seasonally, primarily in response to the changing groundwater table. There is some surface inflow in the spring as the snow cover melts and runs off the adjacent, frozen land surface. In only three cases (MST and 31.6 and 35.8 mile) does the spring runoff enter as streamflow, and then for only 3–4 days. Weak subsurface groundwater springs appear to enter 30.3 and 30.4 mile ponds. Three ponds (29.5, 30.3 and 30.4 mile) are popular with recreational snow-machiners who disturb the snow cover.
In the autumn, the ponds are visited every 1–2 days and the areal extent of ice is estimated until FU has occurred at each pond. Once the snow cover has melted completely off the ice in the spring, each pond is visited every 1–2 days and the areal extent of ice is estimated until BU has occurred at each pond. Two observers independently estimate the areal extent of ice during freeze-up and break-up, and the margin of error is ±5%. Since we might miss FU and BU by 1 day each, the uncertainty in ice duration is equal to or better than ±1day.
In late March or early April, the time of maximum ice thickness, the total ice thickness and its composition (snow ice, congelation ice) are measured at each pond. Henceforth, we refer to maximum total ice thickness as Z max, and the amounts of snow ice and congelation ice at that time as Z SI and Z C, respectively.
FU
FU occurs in October. Ignoring 33.5 mile pond in 2004, 1–10 days elapse between the time FU occurs at the first and last pond (Fig. 1). Near-simultaneous FU occurred in 2004 and 2005, when nine and ten ponds, respectively, froze over completely on the same day. Freeze-up was unusual in 2003: FU occurred at all ponds in the third week of September, when mean daily temperatures fell below 0˚C (Fig. 2a); then partial melting occurred at ten ponds when temperatures rose far above freezing; (Fig. 2a); and, while 33.5 mile pond remained completely frozen, it took a further 14–18 days for FU to reoccur in the second week of October at the other ten ponds (Fig. 2a). We have no explanation for the anomalous ice retention at 33.5 mile pond in 2003. The consequences of this unusual pattern of freeze-up in 2003 are addressed further at the end of this section.

Fig. 1. Interannual variability of FU at 11 ponds. Mean FU (solid line) excludes the anomalous value in 2004 at 33.5 mile pond. The number of days is the time that elapsed between the dates the first and last ponds achieved FU. For reference here and in Figures 1 and 7 we identify MST, 31.6 and 33.5 mile ponds; they are the main sites where ice growth, snow accumulation and conductive heat flow have been studied each winter since 1999 (Reference Jeffries and MorrisJeffries and Morris, 2006).
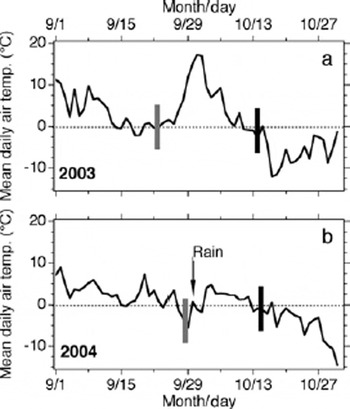
Fig. 2. Mean daily air temperature during September 2003 (a) and September 2004 (b). The vertical grey lines indicate the first appearance of ice. The vertical black lines indicate the day the final pond achieved 100% ice cover (FU).
Spearman’s rank correlation was used to compare the FU sequence each year, i.e. does FU occur in the same, predictable order among the 11 ponds? The results (Table 2) indicate some interannual variability in FU sequence, with moderately high correlation in some cases (e.g. 2002/03 and 2002/05) and high correlation in others (e.g. 2001/03 and 2001/04). Least-squares regression was used to assess the role of water depth and pond area on FU. The results (Table 3) are conclusive: neither water depth nor pond area has a significant effect on FU. It was most dependent on depth and area in 2005 (Table 2), but they still only explain 24% and 42%, respectively, of the variance in FU that year.
A mean FU date for each year was calculated from the 11 individual pond FU dates (Fig. 1), and linear regression was used to assess its dependence on mean monthly air temperature (Fig. 3a). FU is positively correlated with mean August and October air temperatures, i.e. the higher the air temperature the later FU occurs, but neither coefficient of determination (r2 ) is statistically significant (low p value). The highest r2 value in September is statistically significant (p > 95%), and indicates that the mean monthly temperature explains 91% of the variance in FU (Fig. 3a). However, FU and September mean air temperature are anticorrelated, i.e. the higher the air temperature the earlier FU occurs (Fig. 3a). The reason for the September FU/temperature anomaly in this dataset is evident in the pattern of cooling during September 2003 and 2004 (Fig. 2). That is, in both years the cooling trend and beginning of freeze-up was interrupted by a warm interval, which was particularly pronounced in 2003 (Fig. 2a). The late warm intervals increase the mean monthly air temperature each year, resulting in the anomalous inverse relationship between FU and temperature (Fig. 3a).

Fig. 3. Dependence of mean FU (a) and mean BU (b) on mean monthly air temperature. r2 is the coefficient of determination with p (significance level) for each regression line (dotted line).
BU
The shrinkage of the ice cover during the break-up period (Fig. 4) illustrates pond-to-pond variations in the rate at which the ice disappears, the number of days that elapse between the time the first and last ponds become ice-free (BU), and the interannual variability of BU since spring 2002. The areal extent of the ice is reduced to 80–95% once snowmelt is complete, and often remains that way for some time. Further shrinkage and ultimately BU follow two basic patterns. The first is fairly rapid shrinkage over just 3–4 days, as exemplified by MST pond during most years. The second is more gradual shrinkage over 8–10 days, as exemplified by 31.6 mile pond.

Fig. 4. Areal extent of ice on 11 ponds during the decay period each year from 2002 to 2006. The number of days is the time that elapsed between the dates the first and last ponds achieved BU.
The number of days between the times the first and last ponds achieve BU has varied between 6 and 10. This is longer than the number of days between the times the first and last ponds achieve FU. Spearman’s rank correlation was used to compare the BU sequence each year, i.e. does BU occur in the same, predictable order among the 11 ponds? The moderately high to very high ρ values (Table 2) indicate that the BU sequence is similar each spring. Least-squares regression was used to assess the role of water depth and pond area on BU. The results (Table 3) are conclusive: neither water depth nor pond area has a significant effect on BU. It was most dependent on depth and area in 2006 (Table 2), but each only explains 28% of the variance in BU that year.
Table 2. Spearman’s rank correlation coefficients (ρ) for interannual comparisons of FU and BU sequence of 11 ponds. Values in boldface are significant at ≥95% level (Reference Siegel and CastellanSiegel and Castellan, 1988)
Table 3. Coefficients of determination (r 2) for least-squares regression of FU and BU as a function of water depth and area. No p values are given, as the r2 values are so low
A mean BU date for each year was calculated from the 11 individual pond BU dates. The dependence of mean BU on mean monthly air temperature in March, April and May was assessed by least-squares regression (Fig. 3b). The March temperature–BU relationship is not statistically significant. The May temperature–BU relationship has the highest statistical significance (>99%). The April temperature–BU relationship is statistically significant at the >90% level and explains 67% of the variance in BU (Fig. 3b).
BU is strongly influenced by Z max, which explains 59% of the variance in BU when all the years’ data are plotted (Fig. 5a; Table 4). The coefficients of determination are the same and higher, respectively, for the dependence of BU on Z SI and Z C, when all data are considered (Table 4). The roles of snow ice and congelation ice in BU are, however, completely the opposite (Table 4): the larger the amount of snow ice, the earlier BU occurs, while the larger the amount of congelation ice the later BU occurs. The reason for the opposite effects of snow ice and congelation ice are evident in Figure 6. It shows that the greater the amount of snow ice, the lower Z max; hence the dependence of BU on Z max when all data are plotted (Fig. 5a).
Table 4. Least-squares regression equations, coefficients of determination (r 2) and significance levels (p) for BU (x) as a function of maximum total ice thickness (Z max), and amounts of snow ice (Z SI) and congelation ice (Z C)

Fig. 5. BU (first day of zero ice) as a function of Z max (maximum total ice thickness).for all years (a) and for individual years 2002 (b), 2003 (c), 2004 (d), 2005 (e) and 2006 (f), with regression equations, coefficients of determination (r 2) and mean Z SI (amount of snow ice).

Fig. 6. Pond-to-pond and interannual variability of Z max (maximum total ice thickness) and ice composition (snow ice, congelation ice) each year from 2002 to 2006. TI is the mean Z max and SI is the mean Z SI. Z max was measured at all ponds in spring 2002, but Z SI was recorded at only four ponds that spring.

Fig. 7. Interannual variability of ice duration at 11 ponds. The mean duration (bold line) excludes the anomalously early FU in 2004 at 33.5 mile pond (see Fig. 1).
The least snow ice occurred in 2002 (Fig. 6a), the highest Z max occurred in 2003 (Fig. 6b), and the lowest Z max and most snow ice occurred in 2005 (Fig. 6d). Only once has Z max exceeded 1 m, and then only at a single pond: the thick ice at 30.4 mile pond in 2003 (Fig. 6b) was due to ice skaters clearing snow to create a rink in the autumn and subsequent accumulation being compressed by snowmachiners in March and April.
While there is a strong relationship between Z max and BU when all years’ data are plotted, the results are much more variable when individual years’ data are plotted (Fig. 5b–f). Z max explains as much as 61% (p = 0.004, Fig. 5b) and as little as 0% (p = 0.97, Fig. 5d) of the total variance in BU during individual years. The BU variance is directly related to Z SI; the more snow ice, the weaker the dependence of BU on maximum total ice thickness. Linear regression of the dependence of BU each year on Z SI and Z C produces inconclusive results. Coefficients of determination for snow ice varied between <1% (p = 0.87) in 2004 and 48% (p = 0.31) in 2002, and for congelation ice varied between 0% (p = 0.98) in 2004 and 17% (p = 0.2) in 2003. The combination of low r 2 values and low statistical significance suggests that we currently have insufficent data to gain significant insight into the role of snow-ice and congelation-ice amounts on BU in any given year.
Ice Duration
With the exception of 33.5 mile pond (where there was very early FU in 2004; Fig. 1), ice duration decreased at all ponds between 2001/02 and 2004/05, and then increased significantly at all ponds in 2005/06 (Fig. 5). Between 2001/02 and 2004/05, mean duration decreased by 17 days due to later FU each autumn and earlier BU each spring. Mean duration increased by 20 days between the minimum of 205 days in 2004/05 and the maximum of 225 days in 2005/06. Winter 2005/06 had the longest duration of all due to earlier FU (Fig. 1) and later BU (Fig. 4) compared to any previous autumn and spring, respectively. When data for all ponds and years are pooled, ice duration (y) is strongly influenced by Z max (x), where y = 58.97x + 170.0 and 86% of the variance in ice duration is explained by Z max (statistical significance >95%). Since Z max occurs late in the ice season, it can only influence duration by affecting BU, and there is a strong correlation between Z max and BU when data from all years are pooled (Fig. 5a).
Discussion
Ice is present on ponds for a significant proportion of the year in the boreal forest of central Alaska. If we define that year as 1 July–30 June, then, during the period of this study (2001–06), ice is present for 56% (mean ice duration 205 days) to 62% (mean ice duration 225 days) of the year. Increases and decreases in duration are due to changes at both ends of the same ice season, i.e. later FU and earlier BU, or earlier FU and later BU, combine to cause shorter or longer duration, respectively.
Pond morphometry (area, depth) has a slightly stronger influence on FU than on BU, but in neither case is morphometry’s influence as strong as that of air temperature. The insignificant effect that morphometry has on FU and BU is probably because the ponds are small and shallow, with only minor differences among them. This morphometric similarity must be a strong contributor to the predictability of the FU and BU sequences. The annual coherence of FU sequence also suggests that weather conditions are fairly uniform throughout the valley, with some local variation due to the degree of exposure to solar radiation and wind as determined by tree density, height and distance from individual ponds. Any significant change in the sequence and thus predictability of FU or BU would suggest a local change in climate or other conditions (e.g. hydrology (inflowing meltwater streams, groundwater springs) or vegetation).
BU is more dependent on air temperature than FU, but both FU and BU air temperatures play a greater role than pond morphometry. September mean air temperature is the strongest determinant of FU, but they are anticorrelated and thus the opposite of what would be expected and needed to predict the consequences of air-temperature change on FU, or the temperature equivalence of a change in FU. The anticorrelation is due to post-FU warm intervals that increased the mean September air temperature in 2003 and 2004. This does not mean that September temperatures have no predictive capability at all. It means that we need to extend the length of the record. Longer FU records would also improve predictive capability related to August and October temperatures. The dependence of FU on August and October air temperatures is currently too weak to meaningfully predict the consequences of air temperature change in those months on FU, or the temperature equivalence of a change in FU.
BU is determined most strongly by April mean air temperature, and a ±1˚C change in April temperature is equivalent to a ±1.86 day change in BU (or a ±1day change in BU is equivalent to a ±0.5˚C change in April temperature). The predictive capability of the relationship between April temperature and BU is matched by the strong predictive capability of the correlation between Z max and ice duration. Thus, a ±10mm change in Z max will cause a ±0.6 day change in ice duration (or a ±1 day change in ice duration will result from a ±16.6mm change in Z max). As noted at the end of the section on ice duration, Z max occurs late in the ice season and it can therefore only influence duration by affecting BU, which is also strongly related to Z max (Fig. 5a). Why Z max explains 86% of the variance in ice duration but only 58% of the variance in BU is, however, unclear.
Z max, Z SI and Z C are strongly correlated with BU when data from all ponds and years are pooled. The correlation between BU and Z max and ice type is much more variable for individual years, and the strength of the correlation is a function of Z SI. This is possibly the first objective evidence for an effect by snow ice on break-up. Previously, a role for snow ice in freshwater ice decay and BU has been based on entirely reasonable, but nevertheless subjective, arguments related to the albedo contrast between snow ice and congelation ice (Reference MichelMichel and others, 1986). However, the role of snow ice in BU as revealed here remains somewhat ambiguous and inconclusive. For example, as BU occurred progressively earlier between 2002 and 2005 (Fig. 4) Z SI increased as Z max decreased (Fig. 6). Consequently, the snow ice might have slowed decay and delayed BU, but Z max had a stronger overall influence. The latest of the five BUs occurred in 2006, when there was minimal snow ice to slow decay and delay BU, but there was a combination of thick ice (second only to 2003 (Fig. 6)) and a cool spring (second only to 2002 (Fig. 4)).
Snow ice is sometimes referred to as white ice, with a relatively high albedo, because of light scattering off the large number of air bubbles in the ice. Congelation ice is sometimes referred to as black ice, with a relatively low albedo, because of its high optical depth. See Reference Jeffries, Morris, Kozlenko, Duguay and PietroniroJeffries and others (2005) for a summary of the wide variation in the limited number of albedo data that are available for snow ice and congelation ice.
Once any snow ice has melted completely and exposed the underlying congelation ice, the latter is often, in fact, far from black. The albedo of melting congelation ice varies according to its crystal fabric: congelation ice with vertical c axes has a relatively high albedo, and that with horizontal c axes has a relatively low albedo (Reference KnightKnight, 1962; Reference Heron and WooHeron and Woo, 1994). Each spring we have observed large congelation-ice fabric-related albedo variations within individual ponds and among all 11 ponds, with c-axis vertical congelation ice at times also having an albedo apparently as high as snow ice (a qualitative assessment, as no measurements were made). The congelation-ice albedo variability must also account for some of the observed BU variation.
Ideally, we would investigate the role of snow ice and the two types of congelation ice in BU by computer simulation, but this must wait. Currently, too few melting snow-ice and melting congelation-ice albedo data are available, and lake-ice models (e.g. Reference Duguay, Flato, Jeffries, Ménard, Rouse and MorrisDuguay and others 2003) parameterize albedo according to ice thickness not ice composition. Furthermore, since the cause or causes of variable congelation ice fabrics are poorly understood, at best, they cannot be simulated during the growth season, never mind simulated during the decay season that interests us here.
Conclusion
The morphometric similarity of 11 small, shallow ponds in the boreal forest of central Alaska contributes to a simplification of this particular freshwater ice–weather– climate system, and to the predictability of FU and BU sequences. In the absence of a significant morphometric influence, and notwithstanding the unanswered question of the precise role of snow-ice and congelation-ice albedo and melting during decay and BU, a number of factors suggest that these ponds would be good sites for continued long-term observation of phenology and the influence of variation and change in weather and climate, and for freeze-up and breakup process studies: (1) the dependence of BU on April air temperature; (2) the fact that decreases (increases) in duration are due to a combination of later (earlier) FU and earlier (later) BU in any given ice season; (3) the dependence of BU on maximum total ice thickness; (4) strong interannual variability in the occurrence of snow ice and both congelation ice types; (5) the predictability of FU and BU sequences; and (6) their accessibility. Indeed, the results suggest that one could focus on events and processes at a single pond over the course of a number of future years, although it would obviously be preferable to continue to study all 11 ponds. Continued study would increase the length of the FU and BU records and improve the predictive capability of the air-temperature–FU and –BU relationships. Both weather/climate–phenology and process studies would benefit from computer simulation to supplement observations and measurements, but current lake-ice models are inadequate to the task. A top priority for lake-ice model improvement should be detailed measurements of the albedo of melting snow ice and congelation ice coupled with the development of ice-composition-based albedo parameterizations.
Acknowledgements
This study was made possible by US National Science Foundation grants OPP 0117645 and OPP 0425884. We thank R. Block, C. Bosveld, C. Duguay, M. Gould, S. Graham, R. Reihl and L. Yocum for their assistance with phenology observations and ice thickness/composition measurements. Two anonymous reviewers offered numerous comments and suggestions that enabled us to improve the paper, and a vigilant S. Warren encouraged us to look more closely at the air-temperature–FU and –BU relationships.


