


Introduction
Many different authors have made a variety of tests on snow at various locations. The purpose of this study is to compare specific tests under identical conditions and to determine the significance of comparison of the various test results. For this purpose a group of tests was developed and applied at the Amundsen-Scott South Pole Station during the United States Antarctic Operation Deep Freeze 62.
It is hoped that continued testing at different locations, with the procedure discussed here, will reveal some empirical relationships that will lead to a better understanding of the snow structure. Thus, the engineer would be aided in planning and constructing sites in snow at varied locations in cold regions.
Preparing the Snow Specimens
All samples were collected in the snow mine at the Amundsen-Scott South Pole Station during the summer of 1961–62. In 1957 the snow mine was excavated to a depth of 27 m., with an inclination of 20 degrees (Reference GiovinettoGiovinetto, 1960). The snow mine was resurveyed during the summer of 1961–62 (Reference RamseierRamseier, unpublished) and the new depth figures are used for this report. The snow-mine temperature is constant at approximately the mean annual temperature, −50.6° C., which was measured by Giovinetto at a depth of 12 m. All experiments were made at a temperature of −49.4° C., with the exception of the permeability tests which were conducted at −10° C.
Both horizontal and vertical snow samples were taken from the snow mine. The horizontal samples (parallel to the surface) were taken from the west wall (Greenwich Meridian being north) with an auger coated with “Teflon” (polytetrafluorethylene). The cores were taken 0.60 m. apart starting at a depth of approximately 7.9 m. below the surface, and the first to to 15 cm. of the cores were disregarded. Each horizontal core was marked before it was drilled from the wall so that orientation would not be lost. VerticalFootnote * samples were cored out of blocks cut from the wall with an electric chain saw. Deep cores taken from the bottom of the snow mine to a depth of 50 m. were also used as vertical samples. Pieces with a minimum length of 20 cm. were used for all the tests.
Each core from the two groups was placed on a drill press stand and the basic specimens for the different tests were cut out. A specially designed auger tube, 5 cm. in diameter by 20 cm. in length, was used to get a cylindrical specimen for the density and air permeability measurements (A in Fig. 1). The sample weight for density determination was obtained by weighing the auger tube with the snow specimen and then deducting the weight of the auger tube. The air permeability measurements were taken while the sample was still in the auger tube. The sample was then removed using a wooden piston and cut on a band saw into three parts as shown in Figure 1.

Fig. 1. Diagram of sample preparation. Specimens used as follows: A for air permeability, B for visco-elastic properties. C for creep test, D for unconfined compressive strength
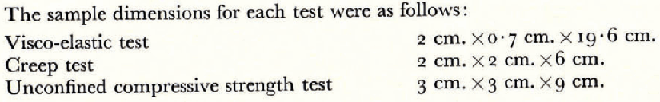
The sample dimensions for each test were as follows:
Air Permeability
Experimental procedure
Various investigators (Reference BaderBader and others, 1939; Reference BaderBader, 1962; Reference BenderBender, 1957[b]; Reference Ishida and ShimizuIshida and Shimizu, 1955; and Reference WaterhouseWaterhouse, 1962) have used air permeability of snow to learn more about the density variations. It has also been found to be a good method for studying the changes in the structure of the snow when the density is kept constant.
The coefficient of air permeability K (in cm.sec.−1) is defined by the equation
where Q is the volume of air (cm.3) flowing through snow samples for a given time t (sec.), A is the cross-section of the snow sample normal to the direction of air flow (cm.2), t is the time (sec.), L is the length of the snow sample in the direction of air flow (cm.), Δp is the air pressure head expressed as the height of a water column (cm.), V is the air velocity (cm.sec.−1) Q/At, and i is the air pressure gradient (cm. of water/cm. length of sample) Δp/L.
To interpret the equation for 0° C., a small correction has to be made to account for the drop of air viscosity with increasing temperature, which results in a higher permeability at lower temperatures. The correction can be put as
where T is the temperature at which the test is performed (°C.), λT is the air viscosity (micro-poise) at any temperature T, and λ 0. is the air viscosity at temperature T = 0° C. (170.8 micropoise).
Then the air permeability can be corrected to
or, substituting for λT and using the value for λ 0,
where K 0 is the air permeability (cm.sec.−1) at 0° C., and KT is the air permeability (cm.sec.−1) at temperature T The measurements must be made in the laminar flow range, i.e. the ratio of flow rate to pressure gradient should be constant.
Figure 2 gives results for the rate of flow versus the pressure gradient in snows of different densities. Velocities for laminar flow range from 5 to 15 cm.sec.−1. Reference BaderBader and others (1939) reported values of the same magnitude, whereas Reference BenderBender 1957[b]) and Ishida and Reference Ishida and ShimizuShimizu (1955), reported much lower values for different size ranges. Turbulent flow would show up as bending in the upper part of the curves. The lower part of the curves satisfies Darcy’s law for laminar flow.

Fig. 2. Rate of flow versus air pressure gradient for various densities
The absolute porosity, or ratio of volume of voids to snow volume, is
where ρ i is the density of ice (0.917 g.cm.−3) and ρ s is the density of snow.
Bader (Reference BaderBader and others, 1939; Reference BaderBader, 1962) has shown the relationship between air permeability K and absolute porosity n to be
where the constants a and N can be determined by plotting K/n against K, the result is a straight line with intercept a with the ordinate K/n and having N as the reciprocal of the slope.
Laboratory tests by Reference BenderBender (1957[b]) indicate that the value of a depends largely on the grain size. Using his approximate relationship
where d is the average grain size of the sample, we can write
The entire apparatus was set up in a cold room at a temperature of approximately −10° C. Cold-room air was compressed in a Bell and Gosset compressor with a compressor tank mounted on top to minimize the fluctuations of the air from the compressor. A pressure regulator was used to obtain the desired flow rate. From this the air passed through the snow sample and then through a “precision” wet test meter (liquid-sealed, rotating drum type meter) to measure the air volume which passed through the snow sample. The pressure difference Δp was measured with a “Trimount” micromanometer. All connections were air-sealed with Dow Corning silicone lubricant and soft paper gaskets. The inside of the air-permeability auger tube was also covered with a coat of silicone lubricant to minimize the air flow between wall and sample. Each sample was tested at different air velocities up to 15 cm.sec.−1.
Results and Discussion
Figures 3 and 4 show K/n versus K for vertical and horizontal specimens tested at the Pole. Each point represents one specimen on which six velocity determinations were made and the average K calculated. A Bendix G-15 computer was used for the least-square analysis to find the best fitting curve. Values are given in Table I.

Fig. 3. Air permeability K versus K/n for South Pole snow (vertical samples) at −10° C.

Fig. 4. Air permeability K versus K/n for South Pole snow (horizontal samples) at −10° C.
Table I Numerical Data from Air Permeability Measurements
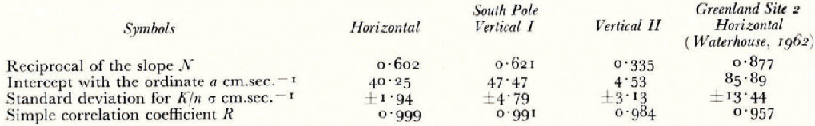
Figure 3 shows a clear change in the slope for high density snow which tends toward zero permeability. For the horizontal specimen this change does not occur because no samples of high density were tested. Comparing the two types of curves we can see that there is a small, not-too-pronounced anisotropy between the vertical and horizontal structures of snow.
It is, of course, of interest to be able to compare these results with other types of snow. Reference WaterhouseWaterhouse (1962) made an analysis of Bender’s data for Site 2. Figure 5 shows these data. These specimens also were from samples taken horizontally. Bender used the relationship of the permeability K and the porosity n for the same snow, i.e. after each new K and n determination, the same sample of snow was compacted and tested again. In the present case the K determinations were made on a snow profile with changing density, this also was done with the Site 2 snow.

Fig. 5. Air permeability K versus K/n for Site 2, Greenland (horizontal samples) at −10° C.
There are certain postdepositional changes in the snow structure which do not cause changes in the snow density. This is shown by the large standard deviations observed in the Site 2 data (Fig. 5). It is apparent that the large deviations also occur on the upper (low density) part of the curve, which is located near the surface (0–12 m. depth). Below this depth the changes between “summer” and “winter” snow become less pronounced, and disappear completely further down. The South Pole data do not show this as clearly as the data on the Site 2 snow. This can be accounted for by the considerably different meteorological conditions which prevail at the sites. Most of the accumulation at the South Pole occurs during the winter season and is rather small (7.6 cm. of water equivalent). The very low temperatures (Ramseier, unpublished) almost prohibit metamorphism. Snow at the surface is also reworked by the action of drifting. All these factors mean that we cannot distinguish “winter” and “summer” snow as precipitated at the Pole. The only feature we see is a crust on the surface caused by solar radiation during the summer months and underlain by depth hoar.
Site 2 snow has a lower K than South Pole snow for high densities and a higher K for low densities. If Figure 5 is superimposed on Figure 4, the Site 2 line crosses the South Pole line at a density of 0.48 g.cm.−3.
Equation (7a) was used to get an approximate average grain diameter. For a density of 0.480 g.cm.−3 the calculated diameter is ~1·7 mm. This value is slightly higher than that observed by Reference GiovinettoGiovinetto (1960). The visual determination as done in pit studies is adequate for field work but may not be accurate enough for this study. In the higher density snow the determination of the grain size becomes very difficult because the changes are very small and the snow is very hard. Thin-section studies would be a more appropriate method.
Visco-Elastic Properties
Principle
The sonic method of studying the visco-elastic properties of snow has been used by Reference Yamaji and KuroiwaYamaji and Kuroiwa (1954; Reference Kuroiwa and YamajiKuroiwa and Yamaji, 1956, Reference Kuroiwa and Yamaji1959), by Reference YosidaYosida and others (1956, p. 37–40) and by Reference NakayaNakaya (1959[a], Reference Nakaya[b]), who used a transverse vibration method. This method has been used very successfully in the laboratory and in Greenland and was there fore chosen for the present study. It also has the distinctive advantage of being a nondestructive method.
The principle is based on the resonance vibration of the sample, which is made in the form of a rectangular bar. The solution of the flexural vibration of a bar was obtained by Lord Rayleigh (Reference StruttStrutt, 1929, p. 273–78) for elastic vibration without internal viscosity. The frequency of the vibration is
where l is the length of the bar, b the velocity of the sound in the material (which is
Experimental method
The sample of snow is cut into a rectangular bar and supported on two strings stretched horizontally between two supports (Reference NakayaNakaya, 1959[b], fig. 1). The position of the strings should coincide with the nodal points of the vibration, 0.22 l from each end of the bar. Immediately below the iron plates at each end, I, and I2, and at a distance of about 5 mm., there are two electromagnets, c, and c2. When the frequency coincides with that of the resonance vibration of the bar, the induced current in coil c2 becomes a maximum due to the vibration of the iron plate I2. The number of oscillations are read from four counting tubes; D1 records the units, D2 the tens, D9 the hundreds, and D4 the thousands. This will give the number of oscillations for a given time. From this the frequency f is obtained. Only the fundamental vibration was measured.
In this series of experiments, N3 (the number of oscillations to decay to
Results and Discussion
Figure 6 shows the dynamic Young’s modulus E as a function of the density p. Each point represents a test for vertical, naturally compacted snow. These data suggest that the curve is divided into two parts. Reference NakayaNakaya (1959[a]) indicates only one part for a density range of 0.5 g.cm.−3 to 0.9 g.cm.−3. If the curve (Reference NakayaNakaya, 1959[a], fig. 25) is redrawn, it can be seen that there is a similar bend, though not as pronounced as that in the South Pole curve (Fig. 7). The bend corresponds to the one in Figure 13 for the horizontal unconfined compressive strength (Reference Gow and RamseierGow and Ramseier, 1963).

Fig. 6. Dynamic Young’s modulus versus density for South Pole snow (vertical samples) at —49.4° C.

Fig. 7. Dynamic Young’s modulus versus density for South Pole and Site 2 snow adjusted to −10° C. The upper and lower parts of the South Pole line, marked with shorter dashes, represent the suggested trend beyond the range of the present data
If the South Pole curve extrapolated to higher densities and the Site 2 curve are corrected for temperature, they cross at the density of 0.56 g.cm.−3 (Fig. 7) . Above the density of 0.56 g.cm.−3, the dynamic Young’s modulus is greater for the South Pole snow than for the Site 2 snow and below it, smaller.
The correction of Young’s modulus for temperature change is very small. It can be calculated from previous data (Reference NakayaNakaya, 1959[b], fig. 18) and amounts to 1.165×10⁴ g.cm. −2 °C.−1;
where E T is Young’s modulus at temperature T, and ΔT is the temperature difference.
The data taken for the horizontal specimens are so scattered that they cannot be used for direct comparison (Fig. 8). This scatter can be explained by the fact that it was very difficult to orient the horizontal E samples after the cores had been drilled from the wall. Cores would break up and had to be fitted together where possible to prevent rotation of samples. This orientation did not affect the other test results. The rotation of cores would cause a deviation in the horizontal orientation when the samples were cut.

Fig. 8. Dynamic Young’s modulus versus density for South Pole snow (horizontal samples) at −49.4° C.
For all curves the empirical relationship is
where m is the slope, p is the density, and a is the intercept with the ordinate. The different parameters are listed in Table II.
Table II Numerical Data from Young’s Modulus Measurements
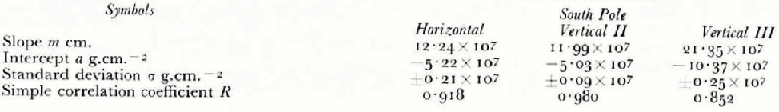
Reference NakayaNakaya (1959[a], Reference Nakaya[b]) found an anisotropy in snow disaggregated and redeposited by a Peter Snow Miller. The explanation he gave was based on the argument that Peter snow has a horizontal layer structure. The difference shown is not great, but there is a clear difference between horizontal and vertical specimens.
An anisotropy can also be seen in the data from the South Pole snows, which had not been disaggregated. In general, for comparison at the same density, the horizontal specimens have lower values for dynamic Young’s modulus than vertical specimens.
Creep Tests
Snow samples were tested at four low stresses (of 60, 90, 120, and 150 g.cm.−2) for a time period of three days. Readings were taken at short intervals during this time. In the graphical analysis, no indication was found for a relationship between density and creep. Reference LandauerLandauer (1955) reports a correlation between creep and stress for similar densities, therefore further investigations are necessary.
Unconfined Compressive Strength
Experimental Procedure
Some tests on the crushing strength of snow were made in the summer season of Operation Deep-Freeze 61 (Reference Gow and RamseierGow and Ramseier, 1963). At that time cores were used (6.3 cm. in diameter) which had been drilled in 1958 and left in the drill holes. This year, during Operation Deep-Freeze 62, the tests were repeated on smaller specimens, 3 cm. × 3 cm. × 9 cm. (D in Fig. 1).
The ratio of length to width was made 3 : 1 to insure against end constraint which appears when the ratio is less (Reference ButkovichButkovich, 1954.). The ends were cut very carefully so that they would be as close to parallel as possible. A “Soil-Test” hand press with a capacity of 908 kg. was used. A proving ring (227 kg. capacity) was mounted on the head of the press and a dial indicator showed the amount of deflection of the proving ring. This deflection could be converted into kilograms on a calibration chart. The rate of application of the load was controlled manually and timed with a stop watch. The average rate was 10.5 kg.cm.−2 sec.−1.
Results and Discussion
All data were plotted separately for vertical and horizontal specimens (Figs. 9, 10). For both curves the empirical relationship for the unconfined compression tests is
where m is the slope of the straight line, a is the intercept with the ordinate, and ρ is the density of the snow. The values and units for the different parameters are given in Table III.

Fig. 9. Unconfined compressive strength versus density of South Pole snow (vertical samples) at −49.4 ° C.

Fig. 10. Unconfined compressive strength versus density of South Pole snow (horizontal samples) at−49.4° C.
Table III Numerical Data from Unconfined Compressive Strength Measurements
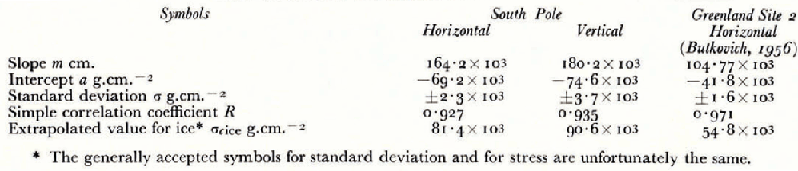
From the graphs it can be seen that the vertical specimens have more strength than the horizontal at a given density. The anisotropy seems to be real. It has also been observed for processed snow (Reference NakayaNakaya, 1959 [a], Reference Nakaya[b]).
Data at Site 2, Greenland (Reference ButkovichButkovich, 1956) indicate that for densities below 0.53 g.cm.−3 the snow at the South Pole is weaker than that at Site 2, above that density it is stronger after applying the temperature correction. Reference BenderBender (1957[a]) worked out an equation which makes it possible to compare results of unconfined compression tests on snow at different temperatures at an arbitrary common temperature.
where σ c1 is the strength at temperature T 1 (°C.) and σ c2 is the strength at T 2(°C.). Bender used data from different authors who used high and low density snow. The constant by which σ c1 has to be multiplied to get σ c2 can be obtained from Figure 12 by reading off the ratio T 2/T 1 on the ordinate.
Example:

From 2 on the ordinate follow horizontally to the line marked 10−1. Where the lines intersect read off the temperature correction factor k B on the abscissa, which in this case would be 0.77.
A strength-temperature study will be conducted in greater detail and published at a later date. It is suspected that equation (13) cannot be applied over the whole density range and that the temperature correction will have to be different for the low density snow, part I in Figure 11.
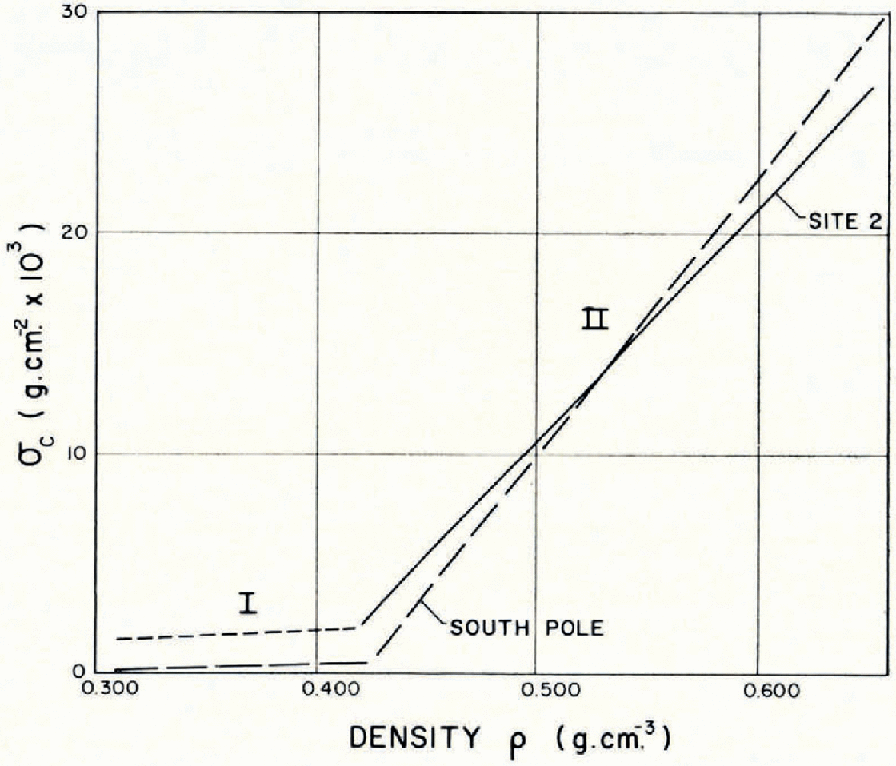
Fig. 11. Unconfined compressive strength versus density of South Pole and Site 2 snow (horizontal samplesi adjusted to − 10° C.
General Discussion
Snow can be divided by physical and mechanical properties into two to four parts over the whole density range.
Part I can be seen very clearly in Young’s modulus and unconfined compressive strength. It ranges from the density of freshly fallen snow to ~0.43 g.cm.−3. Reference FuchsFuchs (1959), by studying the structure of the snow with thin sections, described the transition to the next stage as occurring at a porosity of ~50 per cent. Above this porosity, the low density range, the grains have more freedom of position. Below 50 per cent they are more packed together. This change is found in all dry polar snow.
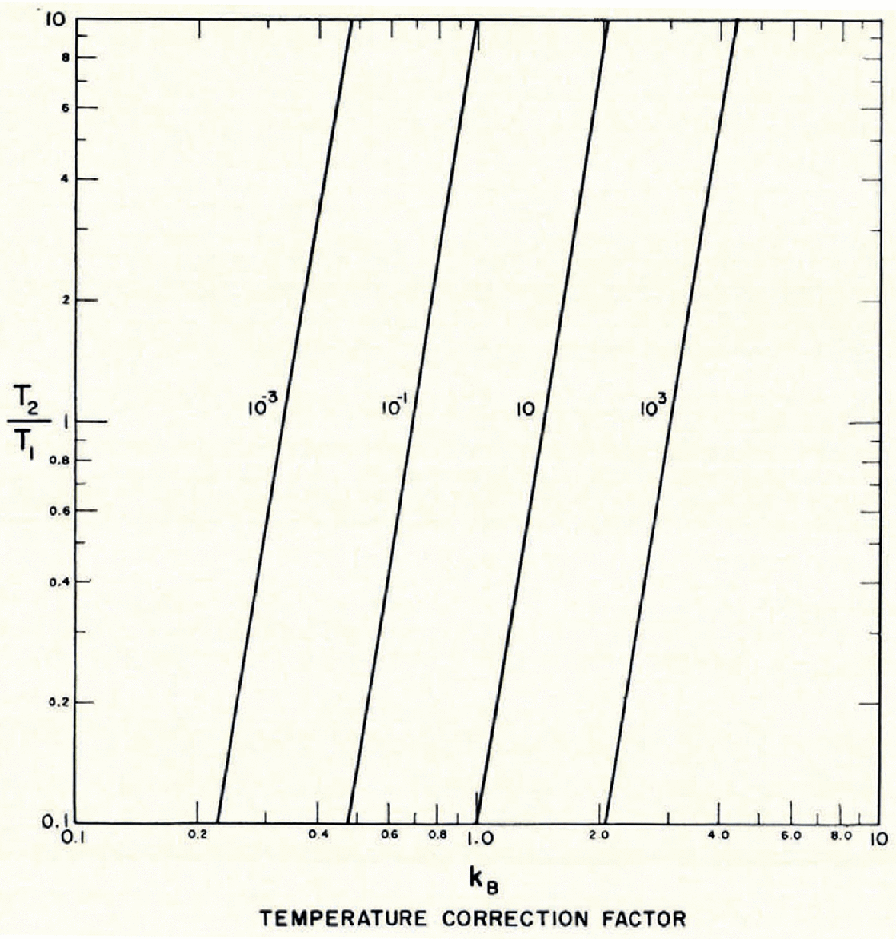
Fig. 12. Temperature correction graph for ice and snow (modified from Reference BenderBender, 1957[a])
Part II as shown in Figure 7 lies between 0.43 g.cm.−3 and 0.57 g.cm.−3 (medium density region) and part III extends from 0 57 g.cm.−3 to 0.90 g.cm.−3 (high density region). Reference NakayaNakaya (1959[a], Reference Nakaya[b]) has shown a smooth curve over this density range. It is believed at the present time that there is enough evidence available to represent the curve in two parts. Tensile and shear strength tests plotted against density on Greenland snow by Reference ButkovichButkovich (1956), and the unconfined compressive strength tests of Reference Gow and RamseierGow and Ramseier (1963) show a similar trend. Reference MellorMellor (in press) has compiled a large amount of data for unconfined compressive strength and ram hardness for natural snow and disaggregated snow. For disaggregated snow the difference between the two parts II and III is striking.
It would be feasible to explain this change by saying that the snow in part II is compacted (densified) without appreciable deformation of the individual grains. The same effect appears by agitating spherical glass beads of the same size. The highest average porosity achieved experimentally for glass beads is about 40 per cent (0.55 g.cm.−3 if the beads have the density of ice) which is near the average of 37 per cent for cubical (47.64%) and hexagonal (25.95%) packing. The intersection of lines representing parts II and III occurs at a porosity of 37.8 per cent. It is reasonable that this should be below 40 per cent because in snow we have to consider a varying size of grains rather than a single size as for the spherical glass beads. Any further densification of snow has to be accompanied by considerable deformation of the grains and slipping of small grains into voids, which is the case in part III.
Part IV, which Nakaya calls the ice region, ranges from 0.90 g.cm. −3 to 0.917 g.cm. −3. The only change which occurs is in the volume of air in the voids. This region could also be shown in the unconfined compression tests.
The air permeability curve shows a change at a density of‘~0.625 g.cm.−3. This is an indication of the closing off of some air space by densification. This change in structure is not shown in the visco-elastic and unconfined compressive tests since change in the air permeability does not always indicate a change in the visco-elastic properties and unconfined compressive strength.
All three tests show an anisotropy. If we look at a snow block taken from a point in the depth profile, we know that the vertical forces acting upon it are larger than the horizontal forces. The horizontal or lateral forces are not known and cannot be calculated at this point, but the boundary conditions are
Equation (15) holds when the stress conditions become hydrostatic.
We can deduce in general what happens to the snow structure. Bonding between the snow grains is favored in the vertical direction. We expect to have more and larger bonds than in the horizontal direction. This anisotropy is readily apparent in the results of the three different tests. Since σ cV > σ cH for unconfined compression, greater forces are required to break the bonds in the vertical direction than in the horizontal. Similarly, the visco-elastic measurements show that E V > E H The effects of age hardening on Young’s modulus (Reference NakayaNakaya, 1959[a], Reference Nakaya[b]) also show this anisotropy.
That K V > K Hshows that the air encounters less resistance in the vertical direction than in the horizontal (Δp V < Δp H) because of the more open structure in the vertical direction.
Young’s modulus is shown plotted against unconfined compressive strength, for data both from the South Pole and Site 2, in Figure 13. Since the two curves are almost identical we can conclude that, for all practical purposes, there is no essential difference in the visco-elastic and unconfined compressive properties of snow from the South Pole and Site 2 in Greenland.

Fig. 13. Dynamic Young’s modulus versus unconfined compressive strength for South Pole and Site 2, Greenland snow adjusted to − 10° C.
The relationship can be expressed by two empirical equations:

The air permeability shows some changes which cannot be overlooked. For snow below 46 per cent porosity (0.49 g.cm.−3) the South Pole snow has a smaller air permeability coefficient than Site 2 snow. Above 46 per cent the coefficient for South Pole snow is greater than for Site 2 snow. This shows a change in structure without a change in the porosity (or density).
The air permeability depends mostly on grain size and shape whereas the Young’s modulus and unconfined compressive strength depend mostly on the bonds between the grains as has been shown in previous sections.
Snow from other sites should be investigated before any conclusive statements can be made about the difference of properties at different geographical sites. It would also be of great interest to find out more about the temperature correction for unconfined compressive strength. It is suggested that a standard temperature of −10° C. should be used for representing the corrected experimental data.
Acknowledgements
This project was supported in part by the National Science Foundation, Office of Antarctic Programs. The author would like to express his indebtedness to this group and also to Edward Oliver for his valuable assistance in the field work. Further appreciation is extended to John W. Glen and Thomas L. Pavlak for suggestions and assistance in the preparation of the manuscript for publication.


