


The knowledge that cells with taste receptors are not only present in the mouth but are widely distributed in the human digestive tract (trachea, stomach, intestine, bile duct) boosted several research studies aimed at understanding the physiological roles of these taste circuits in humans( Reference Trivedi 1 ). Mounting evidence indicates that taste cells in the gastrointestinal (GI) tract play a major role in nutrient sensing and in triggering a specific gut–brain response( Reference Rønnestad, Akiba and Kaji 2 ). In fact, taste receptor agonists elicit in enteroendocrine cells in vitro and in animals in vivo the release of peptides (including CCK, glucose-dependent insulinotropic peptide (GIP), peptide YY (PYY) and glucagon-like peptide-1 (GLP-1)), which are involved in the regulation of GI secretion and motility, glucose homoeostasis, food intake and satiety( Reference Sternini, Anselmi and Rozengurt 3 ). In particular, several studies on cell lines, animals and humans suggested that bitter-tasting compounds may modulate energy intake (EI) by delaying gastric emptying through the inhibition of gastric contractility and by triggering the secretion of CCK, GLP-1 and ghrelin( Reference Chen, Wu and Reeve 4 – Reference Andreozzi, Sarnelli and Pesce 9 ). In addition, a link between the bitter taste receptors and the endocannabinoids (EC) system, a group of molecules also involved in the regulation of energy homoeostasis and reward( Reference Cristino, Becker and Di Marzo 10 ), has been suggested. Tomassini Barbarossa et al.( Reference Tomassini Barbarossa, Carta and Murru 11 ) showed that the sensitivity to the bitter compound 6-n-propylthiouracil was associated with higher plasma levels of EC 2-arachidonoylglycerol (2-AG) and arachidonoylethanolamide (AEA). They speculated that the genetic of bitter taste receptors may influence the eating behaviour through the modulation of the EC system( Reference Tomassini Barbarossa, Carta and Murru 11 – Reference Tepper, Banni and Melis 12 ).
Moreover, a long-term study conducted in high-fat-diet-fed rats demonstrated that isohumulones, the bitter compounds derived from hops in beer, improved insulin sensitivity and lipid metabolism through activation of both PPAR-α and -γ ( Reference Yajima, Ikeshima and Shiraki 13 ). An effect of isohumulones in controlling glycaemia in mild diabetic subjects was also ascertained by the same authors and was confirmed by Obara et al.( Reference Obara, Mizutani and Hitomi 14 ). Contrasting results were found in the two studies on the ability of hop-derived bitter compounds to control body weight upon a 12-week intervention( Reference Yajima, Ikeshima and Shiraki 13 , Reference Obara, Mizutani and Hitomi 14 ).
In these in vivo studies bitter compounds were always administered as gastric gavage or drugs in the form of capsules, in order to skip the natural aversion for this taste and possible anticipated physiological responses induced by oral tasting. In fact, the use of bitter compounds as food ingredients with specific health effects is limited by the general aversion for this taste. The aversion for bitter is not an intrinsic value of this tastant, but it comes from the ability of bitter compounds to stimulate the brain centre for disgust( Reference Berridge 15 ). Mueller et al.( Reference Mueller, Hoon and Erlenbach 16 ) clearly demonstrated that the attractive or aversive behaviour towards bitter compounds is mediated by the specific activation of taste receptors cells, rather than being a simple property of the tastant molecules( Reference Mueller, Hoon and Erlenbach 16 ).
On the other hand, social interactions may influence the food palatability, leading to the recognition of certain bitter foods, such as coffee or beer, as highly palatable( Reference Prescott, Buchanan-Smith and Smith 17 ). Food palatability has a crucial role in eating behaviour. The relation between food palatability and appetite sensations or EI is not clear, but several studies demonstrated that hunger and food intakes increase as palatability increases( Reference Sørensen, Møller and Flint 18 ).
Encapsulation is a reliable strategy to design a palatable food enriched with functional compounds with unpleasant taste. The formation of a specific external coating around the desired compound avoids the perception in the mouth and allows the controlled delivery of the encapsulated compound to the different compartments of the GI tract( Reference Champagne and Fustier 19 ).
In this study a new food ingredient consisting of bitter compounds encapsulated with a coating material was developed. The core was a concentrated extract of Gentiana lutea root with a known amount of bitter compounds, and the coating was made of ethylcellulose and stearic acid. In this way, we aimed to mask bitterness in the mouth and obtain the release of the core material in the intestine. This ingredient was included in a vanilla pudding that was administered to volunteers to verify the hypothesis that it might influence appetite in humans. The appetite ratings, GI hormones, EC and N-acylethanolamine (NAE) responses over 3 h from consumption of the new pudding and the control pudding (CP) (without encapsulated ingredient) as well as individual 24 h EI were recorded in healthy subjects on different experimental days.
Methods
Encapsulated bitter ingredient
An aqueous extract of G. lutea root was provided by Polcaro Fitopreparazioni SRL and was chemically characterised by HPLC analysis using the method described by Aberham et al.( Reference Aberham, Pieri and Croom 20 ). Separation of the bitter compounds was achieved on a Zorbax Eclipse XDB-C18 column (150×4·6 mm, 5 µm; Agilent Technologies) using as mobile phases 0·1 % (v/v) formic acid acidified water (A) and acetonitrile (B). The following binary gradient was used: 0 min 95A/5B, 12 min 80A/20B, 20 min 70A/30B, 40 min 20A/80B, 45 min 2A/98B, 53 min 2A/98B, 53·5 min 95A/5B, and 65 min 95A/5B. Flow rate and injected sample volume were set at 1·0 ml/min and 20 µl, respectively. Detection was performed at 254 nm. Identification and quantification of the secoiridoids was based on a calibration curve ranging from 0·5 to 50 mg/l. In order to mask bitterness in the mouth and to allow the release of bitter compounds in the intestine, the gentian root extract was submitted to spray-drying technique and coated with ethylcellulose and stearate coating following the procedure described by Shirai et al.( Reference Shirai, Sogo and Yamamoto 21 ).
Puddings
Two equally isoenergetic and macronutrient-enriched vanilla puddings were formulated: a microencapsulated bitter ingredient-enriched pudding (EBIP) and a CP. EBIP contained 1·25 g of micro encapsulated bitter ingredient (EBI) per a 100 g portion, providing 100 mg of bitter secoiridoids. CP contained the same amount of EBI coating except the bitter core. The two puddings were also very similar for sensory properties as assessed by a preliminary test conducted with volunteers (data not shown). In order to provide about 20 % of the total daily EI three biscuits were served together with the CP or the EBIP at breakfast. The macronutrient composition, energy values and bitter compound content of the two puddings and breakfasts are reported in Table 1.
Table 1 Nutritional composition and bitter compounds content of the two puddings (micro encapsulated bitter ingredient (EBI) – pudding and control pudding), biscuits and of the breakfasts offered to volunteers

In vitro digestion of puddings and cryo-scanning electron microscopy analysis
The stability of EBI along the GI tract from the oral cavity up to the intestine was tested by a multistep enzyme in vitro digestion-simulating human digestive process. A volume of 5 g of EBIP and CP was submitted to the in vitro digestion protocol described by Papillo et al.( Reference Papillo, Vitaglione and Graziani 22 ) and 20 μl of the soluble extract from the salivary phase and from the gastrointestinal phase (after sequential treatment of the food samples with pepsin, pancreatin, α-amylase, pronase and viscozyme) was analysed using ultra-high-resolution (cryo) scanning electron microscopy (SEM). In brief, the samples were pipetted onto anodisc filters, which were placed onto standard filter paper. After draining most of the liquid the anodisc filter was placed on a SEM sample holder using a thin layer of carbon glue (Leit-C; Neubauer Chemikalien). The samples were then immediately frozen in liquid N2. The samples were transferred to a non-dedicated cryo-preparation system (MED 020/VCT 100; Leica) onto a sample stage at −93°C. In this cryo-preparation chamber the samples were freeze-dried for 2 min at −93°C at 1·3×10 −6 mbar to remove water vapour contamination. Thereafter, the samples were sputter-coated with a layer of 10 nm Tungsten. The samples were cryo-shield-transferred into the field emission scanning microscope (Magellan 400; FEI) on the sample stage at −125°C. The analysis was performed with SE detection at 2 kV, 6 pA.
Subjects
Recruitment was performed at the Department of Agricultural Sciences of the University of Naples among students and staff of the department. Subjects were excluded from the study if they had a BMI≥25 kg/m2, any chronic illnesses such as diabetes or hypertension, if they were smokers or were taking any prescription medication, were under a controlled dietary regimen or had lost weight over the previous 3 months, or were pregnant or lactating. A total of twenty subjects were recruited and enrolled in two experimental sessions. Subject characteristics are reported in Table 2.
Table 2 Subjects’ characteristics (Mean values and standard deviations)

M, male; F, female.
Study design
This study was conducted according to the guidelines laid down in the Declaration of Helsinki, and all procedures involving human subjects/patients were approved by the Ethical Committee of the University of Naples (protocol no. 235/13). Written informed consent was obtained from all subjects.
The study had a two-sided cross-over randomised design with a 1-week wash-out period. Thus each subject participated in two 1-d experimental sessions. On the evening before the experimental days volunteers were instructed to consume a standardised dinner until 22.00 hours. On the experimental days fasted subjects arrived at 08.15 hours to the nutritional laboratory of the Department of Agricultural Sciences. After 10 min they rated their appetite sensations (hunger, fullness, satiety and desire to eat) on a 100 mm visual analogue scale, anchored on the left as ‘not at all’ and on the right as ‘extremely’. Subsequently, a venous catheter was placed into an arm vein and a baseline blood sample was collected and glycaemia was measured by finger-pricking. A duration of 30, 60, 120 and 180 min after subjects had consumed their breakfast (in 15 min), appetite sensations, glycaemia and blood samples were collected. At 3 h post-breakfast an ad libitum lunch was offered to the volunteers who were free to take all the time they wanted to consume a self-selected meal. During the lunch each subject sat in a single-place cabin separated by the others, and EI was measured as the differences between the amount of food contained in each plate taken and the foods left in the plate by the subject. Before leaving the laboratory, subjects were asked to fill out a food diary over the following 24 h to register all foods and beverages consumed, together with the post-ingestive sensations.
Test meal
The food offered in the test meal included a variety of typical Italian dishes: pasta with tomato sauce, pasta with zucchini, bread, fish, chicken cutlet, fries, salad and fruit. They were chosen on the basis of a food preference questionnaire filled out during the enrolment procedure: those not rated by participants as very high or very low in a hedonic scale from 0 to 10 were selected. The dishes were prepared following the same recipes always in order to accurately know the energy value and the macronutrient composition. Food was portioned in coded plates and subjects were free to compose their tray and eat ad libitum.
Biochemical analysis
Blood collection
For each time point, two different vacutainer® tubes of 4 ml each were used to collect plasma samples. A protease inhibitor mix, consisting of dipeptidyl peptidase IV (DPPIV) inhibitor (Millipore’s DPPIV inhibitor; St Charles), protease inhibitor cocktail (Sigma) and 4-(2-Aminoethyl)-benzenesulfonyl fluoride hydrochloride (Pefabloc® SC; Roche Diagnostics), was immediately added to the blood sample destined for identifying the GI peptide. After sample preparation, tubes were centrifuged at 4000 g for 10 min and plasma samples were aliquoted and frozen at −80°C within 30 min from collection.
Gastrointestinal peptides
Luminex Technology (Bio-Plex; Bio-Rad) was used to determine GI peptides. A magnetic bead panel kit provided by Milliplex® (Merck Millipore; Millipore S.p.A.) allowed the simultaneous determination of the following nine hormones: ghrelin, glucagon, GLP-1, GIP, insulin, leptin, pancreatic polypeptide (PP), total amylin and PYY. The sensitivity levels of the assay (ng/l) were: ghrelin 2·0; leptin, 27·0; GIP 0·6; GLP-1 7·0; glucagon 6·0; insulin 58·0; PP 2·0; total amylin 14·0; PYY 8·0.
The intra-assay variation (%CV) was 2 % for ghrelin, total amylin and PYY; 3 % for GIP, glucagon, insulin and leptin; 4 % for the PP; and 7 % for the GLP-1. The inter-assay variation (%CV) was 4 % for leptin; 5 % for GIP; 6 % for insulin; 7 % for PP and glucagon; 8 % for ghrelin; 10 % for GLP-1; 11 % for PYY; and 33 % for amylin.
Endocannabinoids and N-acylethanolamines
Two EC – 2-arachidonoylglycerol (2-AG) and AEA – and three NAE – linoleoyl ethanolamide (LEA), oleoylethanolamide (OEA) and palmitoylethanolamide (PEA) – were determined by LC/MS/MS.
Samples were extracted following the method set up by Lam et al.( Reference Lam, Marczylo and Konje 23 ). In brief, 1 ml of sample was added into Oasis HLB 1 cc, 30 mg cartridges (Waters) preconditioned with 1 ml methanol and 1 ml H2O. The cartridges were washed with 1 ml 40 % aqueous methanol and eluted in 1 ml acetonitrile. The eluants were then dried under N2, and re-suspended in 100 µl of acetonitrile–water (1:1) before chromatographic separation( Reference Lam, Marczylo and Konje 23 ).
This was performed using an HPLC apparatus equipped with two micropumps Perkin-Elmer series 200. A Synergi Max RP 80 column, 50×2·1 mm (Phenomenex), was used and the flow rate was set to 0·2 ml/min. Injection volume was 20 µl. MS/MS analyses were performed on an API 3000 triple quadrupole MS (Applied Biosystems). All analyses were performed with a TurboIonSpray (Applied Biosystems) source set as previously described( Reference Mennella, Savarese and Ferracane 24 ). The acquisition was carried out in multiple reaction monitoring in positive ion mode for each compound. Data acquisition and processing were performed using Analyst software, version 1.4. Acquisition parameters have been already published( Reference Mennella, Savarese and Ferracane 24 ).
Blood glucose
Blood glucose concentration was measured by finger pricking and using a bedside glucometer (OneTouch Sure Step; LifeScan Inc.). Accuracy of the glucometer was evaluated by the manufacturer using least-squares linear regression analysis and was found to be 98 % ‘clinically accurate’ when compared with the reference.
Statistical analysis
The sample size needed to detect an effect of breakfast was estimated on the basis of previous studies. For the primary endpoint, power analysis indicated that a sample size of seventeen participants was sufficient to detect a minimum difference of 837 kJ (200 kcal) in EI with a power of 80 % and an α=0·05( Reference Vitaglione, Lumaga and Montagnese 25 ). Regarding the secondary outcomes (biochemical parameters) a sample size of thirteen participants was calculated to be adequate to find significant differences( Reference Mennella, Savarese and Ferracane 24 ). Therefore, the participant number was increased to twenty because of possible dropouts. ANOVA was performed to exclude any difference at baseline between treatments for both biochemical analysis and appetite scores. Because no differences were found the results were analysed and expressed as the absolute changes from the baseline to reduce possible effects of inter-subject fasting variability. The subjective appetite sensations and the response of hormones and EC were tested for the effect of treatment and of time as factors by ANOVA for repeated measures. The linear trapezoidal rule was used to calculate the total AUC for the appetite sensations and biochemical markers. Differences in EI after the two test meals were assessed using paired t test analysis. Results are expressed as means with their standard errors and were considered statistically significant for P<0·05. Statistical analyses were performed using the Statistical Package for Social Sciences (version 16.0; SPSS Inc.).
Results
Encapsulated ingredient characterisation and in vitro digestion of puddings
An EBI containing 8 % of bitter compounds (including loganic acid 11·5 %, swertiamarin 9·5 %, gentiopicroside 53·9 %, sweroside 25·1 % as shown in Fig. 1) was obtained and used in pudding preparation. The EBIP could not be distinguished by the CP as assessed by a preliminary test conducted with volunteers (data not shown). The results from the in vitro digestion of the puddings combined with the cryo SEM technique analysis confirmed that EBI was stable during the salivary phase, whereas it lost the physical form along the GI tract during the digestion steps (Fig. 2), thus allowing the delivery of the bitter compound-rich core.
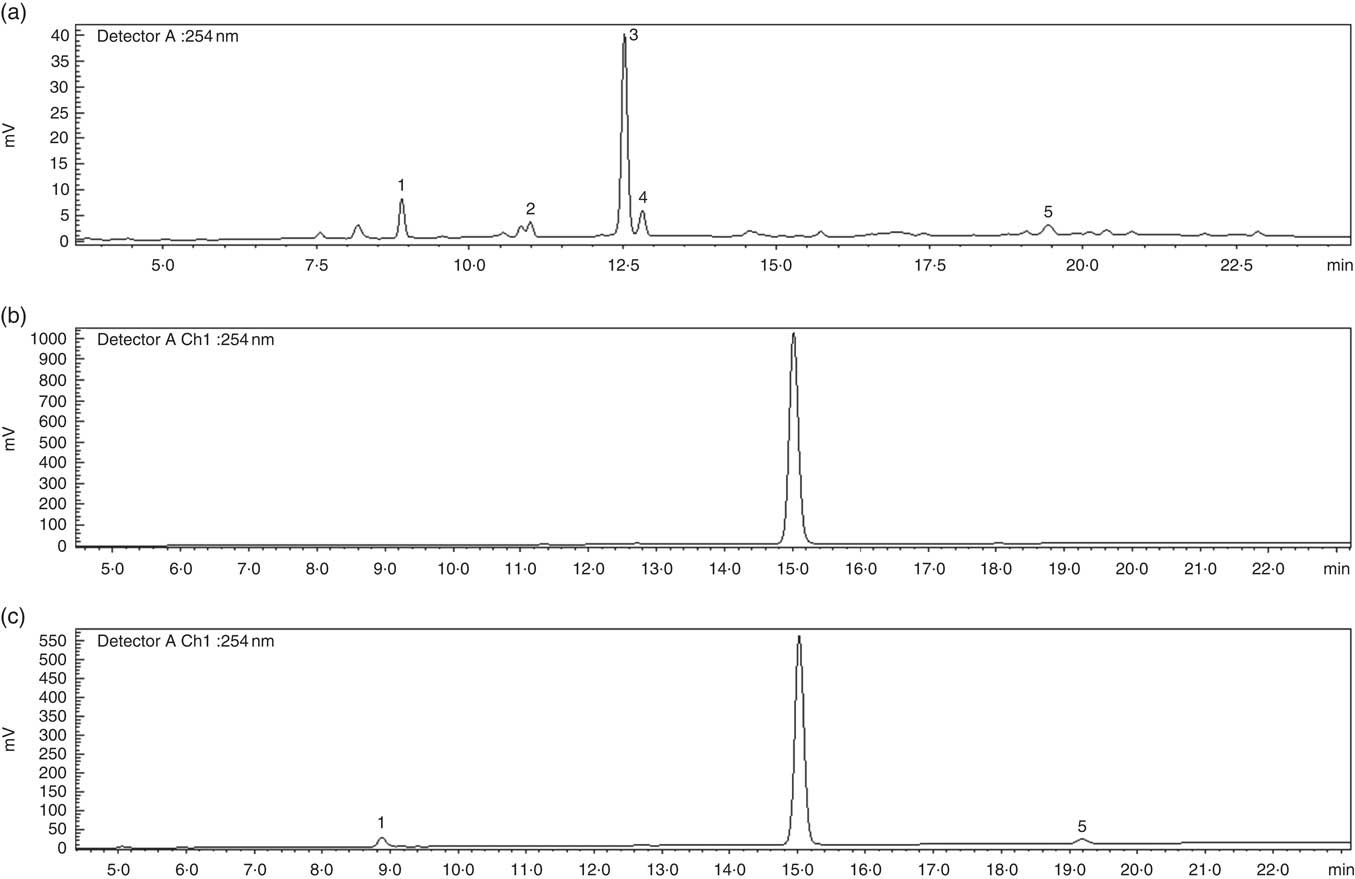
Fig. 1 HPLC profile of secoiridoids present in the Gentiana lutea aqueous extract. (a) Gentiana lutea root aqueous extract. (b) Microencapsulated Gentiana lutea aqueous root extract after the salivary phase of the in vitro enzyme digestion. (c) Microencapsulated Gentiana lutea aqueous extract after the intestinal phase of the in vitro enzyme digestion. 1, loganic acid; 2, swertiamarin; 3, gentiopicroside; 4, sweroside; 5, amarogentin.
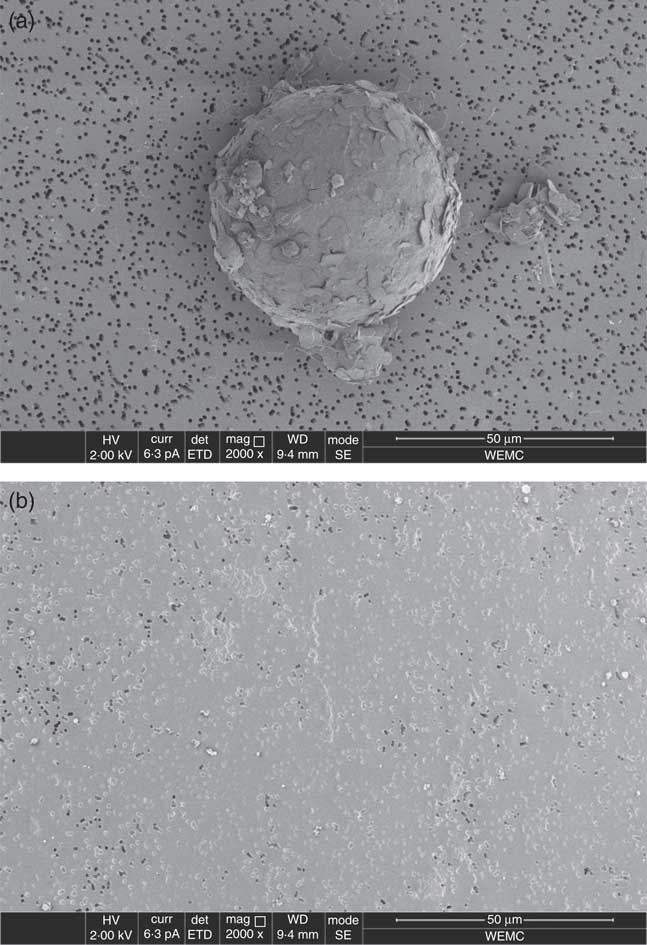
Fig. 2 Scan sight of the solubilised material from microencapsulated bitter ingredient-enriched pudding in vitro digestion. The microcapsules were visible and intact in the salivary phase (a) whereas they were absent in the material solubilised after the gastrointestinal enzyme digestion (b).
Appetite
Fig. 3 shows the profiles of appetite sensations over 180 min after breakfasts. All the sensations positively (for fullness and satiety) or negatively (for hunger and desire to eat) peaked at 30 min and returned to baseline values at 180 min after breakfasts. AUC0–180 of each sensation was not significantly different after EBIP or CB consumption, being 3229 (sem 1123) v. 1861 (sem 863) mm×min for fullness, 3800 (sem 1230) v. 2648 (sem 1176) mm×min for satiety, −2999 (sem 810) v. −3550 (sem 1107) mm×min for hunger and −2558 (sem 805) v. −2444 (sem 1073) mm×min for desire to eat (P>0·05 each).

Fig. 3 Time course of the appetite sensations over the 3 h post-breakfast: (a) hunger; (b) fullness; (c) desire to eat; (d) satiety. Values are mean variations from baseline, with their standard errors. No differences were found between the two experimental conditions. * P<0·05 v. baseline (ANOVA for repeated-measures).
![]() , microencapsulated bitter ingredient-enriched pudding;
, microencapsulated bitter ingredient-enriched pudding;
![]() , control pudding.
, control pudding.
Energy intake
Fig. 4 shows the EI at the ad libitum lunch and over the rest of the experimental day. When subjects had EBIP at breakfast compared with CP, a non-significant 10 % lower EI at lunch (3443 (sem 364) v. 3812 (sem 230) kJ ((823 (sem 87) v. 911 (sem 55) kcal), P>0·05) but a significant 30 % lower EI during the post-lunch time period (2494 (sem 264) v. 3548 (sem 414) kJ ((596 (sem 63) v. 848 (sem 99) kcal), P=0·04) was recorded. This caused a 22 % lower 24 h EI during the experimental day with EBIP than with CP (5937 (sem 473) v. 7360 (sem 506) kJ ((1419 (sem 113) v. 1759 (sem 121) kcal); P<0·05). No differences were found in the macronutrient composition of lunch and post-lunch meals between the 2 experimental days.

Fig. 4 Energy intakes (EI) at ad libitum lunch, over the remaining part of the experimental day (post-lunch) and total daily EI (sum of lunch and post-lunch EI) after breakfast with microencapsulated bitter ingredient-enriched pudding (EBIP) or control pudding (CP). Values are means, with their standard errors. * P<0·05 v. EI at lunch and daily EI after CP (paired t test).
![]() , EI post-lunch;
, EI post-lunch;
![]() , EI lunch.
, EI lunch.
Blood glucose
Blood glucose response over 180 min after breakfasts was monitored. A significant increase at 30 min following both breakfasts compared with baseline was found. At 60 min blood glucose concentration reduced and returned to baseline values at 180 min. No significant differences between treatments were found, with AUC0–180 being 179·47 (sem 8·22) v. 186·75 (sem 6·16) g/l×min for CP and EBIP, respectively.
Gastrointestinal peptides
Amylin, ghrelin, glucagon, GIP, insulin, leptin, PP, PYY and GLP-1 variations from baseline over the 3 h following breakfast are reported in Fig. 5. At 30 min after both breakfasts ghrelin concentration showed a significant reduction (P<0·05), whereas amylin, GIP, insulin and PP increased (P<0·05) compared with baseline. Interestingly, at 30 min GLP-1 significantly peaked only after EBIP consumption (P<0·05). All the hormones, with the exception of PP and GIP, returned to baseline levels within 180 min after the breakfasts. Glucagon, leptin and PYY did not change after any breakfast. No significant differences between the two experimental breakfasts were found for any of the hormones investigated. Interestingly, a trend for a higher response of GLP-1 after EBIP than after CP was found (AUC0–180 after EBIP was 14 660 ng×min/l and after CP was 10 553 ng×min/l, P=0·09).
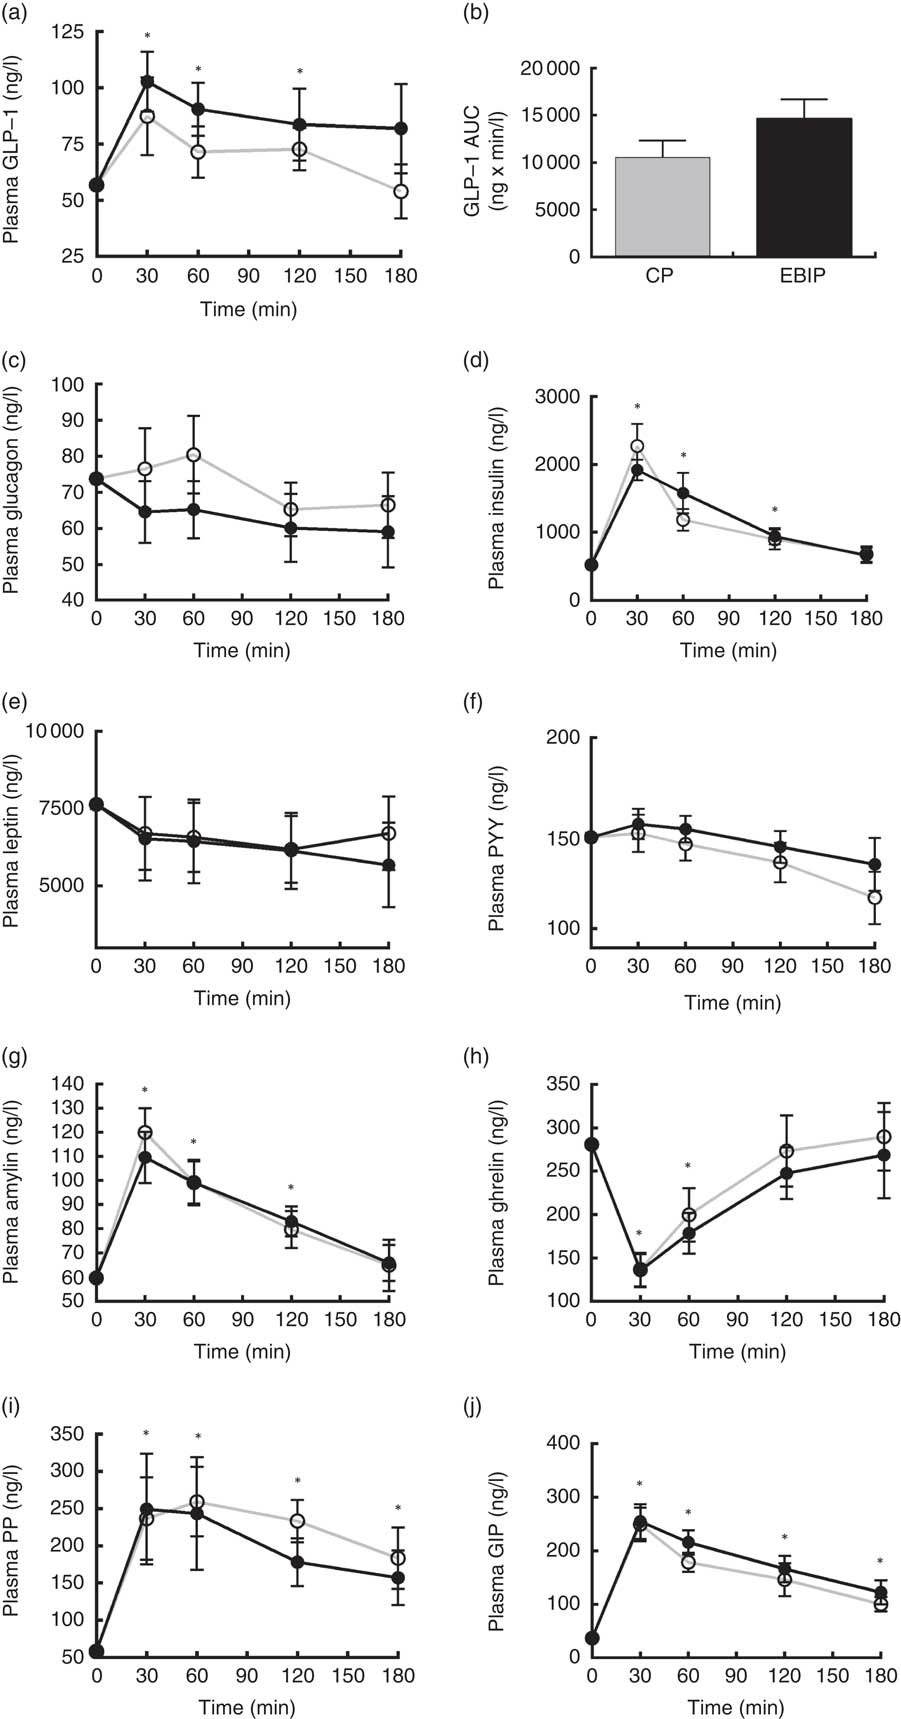
Fig. 5 Gastrointestinal hormone variations in plasma over the 3 h post-breakfasts: (a) glucagon-like peptide-1 (GLP-1); (b) AUC of GLP-1; (c) glucagon; (d) insulin; (e) leptin; (f) peptide YY (PYY); (g) amylin; (h) ghrelin; (i) pancreatic polypeptide (PP); (j) glucose-dependent insulinotropic peptide (GIP). Values are mean variations from baseline, with their standard errors. * P<0·05 v. baseline (ANOVA for repeated-measures). EBIP, microencapsulated bitter ingredient-enriched pudding (
![]() ); CP, control pudding (
); CP, control pudding (
![]() ).
).
Endocannabinoids and N-acylethanolamines
A significant decrease from baseline of plasma levels of AEA, LEA, OEA and PEA over the 3 h after both breakfasts was found (P<0·05). 2-AG showed a significant reduction from baseline only at 180 min after both breakfasts. No differences between the plasma response of any EC or NAE after the two puddings were recorded (Fig. 6).
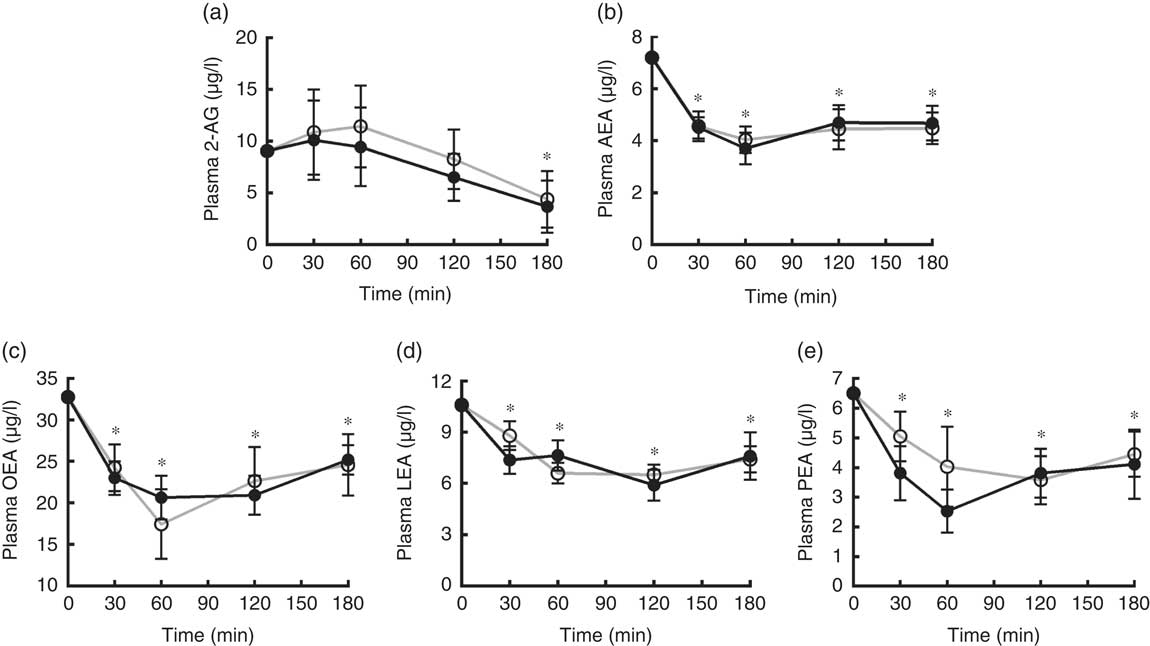
Fig. 6 Endocannabinoids and N-acylethanolamines variations in plasma over the 3 h post-breakfasts: (a) 2-arachidonoylglycerol (2-AG); (b) arachidonoylethanolamide (AEA); (c) oleoylethanolamide (OEA); (d) linoleoyl ethanolamide (LEA); (e) palmitoylethanolamide (PEA). Values are mean variations from baseline, with their standard errors. * P<0·05 v. baseline (ANOVA for repeated-measures). EBIP, microencapsulated bitter ingredient-enriched pudding (
![]() ); CP, control pudding (
); CP, control pudding (
![]() ).
).
Discussions
Some in vitro and in vivo studies showed that the activation of bitter receptors in the GI tract may result in the secretion of hormones modulating appetite and eating behaviour( Reference Chen, Wu and Reeve 4 – Reference Andreozzi, Sarnelli and Pesce 9 ). This study was designed to assess the efficacy of microencapsulated bitter compounds to modulate appetite and EI in humans. A new food ingredient consisting of a microencapsulated G. lutea root extract was developed and included in a palatable vanilla pudding, which was sensory comparable to the control one.
G. lutea bitterness is due to the secoiridoids monoterpenes and their acylglucoside derivatives such as amarogentin, which is known as one of the most bitter among natural compounds( 26 ). Microencapsulation of the extract by a lipid-based material was used to mask the bitterness of G. lutea secoiridoids in the mouth and to guarantee their release in the intestine upon consumption of the pudding containing EBI.
Pudding was chosen as the test food because during its preparation ingredients never reach a temperature >60°C and only slow agitation is necessary: in this way the stability of EBI in the final product was guaranteed. On the other hand the enrichment of EBIP with 1 % EBI was selected on the basis of a previous study from our research group demonstrating that 100 mg of bitter secoiridoids from G. lutea extract was effective in reducing the plasma levels of orexigenic endocannabinoid 2-AG in humans upon a modified sham feeding protocol( Reference Mennella, Ferracane and Zucco 27 ).
Data from the present study indicated that the consumption of EBIP at breakfast did not influence EI at lunch offered 3 h after its consumption, but it led to a 30 % reduced EI over the post-lunch period compared with CP.
These results were partially in agreement with those of Janssen et al.( Reference Janssen, Laermans and Verhulst 7 ) who reported that gastric administration of bitter compounds in mice determined an immediate release of ghrelin and an increase in food intake accompanied by an anorexigenic effect starting from the next 4 h after treatment (resulting in a 49 % reduction in 24 h food intake in mice treated with bitter compounds compared with placebo). In that study the food intake reduction was also associated with an inhibition of gastric emptying, which was not mediated by cholecystokinin and GLP-1, but involved a direct inhibitory effect of bitter compounds on gastric contractility mediated by ion channel mechanisms( Reference Janssen, Laermans and Verhulst 7 ). The capacity of intragastric administration of bitter solutions to delay gastric emptying was recently confirmed in pigs( Reference Mani, Hollis and Gabler 8 ) and fasting humans( Reference Deloose, Corsetti and Van Oudenhove 28 ), whereas it did not underpin the reduction of appetite over 4 h post consumption of a meal ingested 30 min after bitter administration( Reference Verschueren, Janssen and Andrews 29 ).
The uniqueness of our study was the use of microencapsulated gentian extract (EBI). It allowed us to evaluate the effect of bitter-tasting compounds on appetite and on eating behaviour in humans in a physiological condition and in a less stressful manner than in previous studies using nasogastric administration( Reference Deloose, Corsetti and Van Oudenhove 28 , Reference Verschueren, Janssen and Andrews 29 ). In fact, the use of microencapsulated bitter compounds possessing a taste-masking effect prevented any adverse GI events or nausea in volunteers and influenced their eating behaviour following EBIP.
Behavioural and biochemical data collected over the 3 h after breakfast showed a parallel 10 % (not significant) reduction of EI at lunch and a slight 28 % (not significant) increase in plasma GLP-1 response after EBIP compared with CP. This finding was likely due to the EBI that had already reached the duodenum over the time period between breakfast and lunch, because it is known that in healthy subjects about 60 % of a solid meal is reversed in the duodenum over 3 h from eating( Reference Collins, Houghton and Read 30 ). Thus, in accordance with the working mechanism designed for EBI, this finding suggested that once in the duodenum EBI digestion allowed the release of the bitter core (amarogentin and the other bitter secoiridoids) from the microcapsules( Reference McClements and Li 31 ) and it could trigger the secretion of GLP-1 from the entero-endocrine cells.
Several in vitro studies supported this hypothesis. Stimulation of GLP-1 secretion was induced by bitter compounds in mouse STC-1 and human NCIeH716 enteroendocrine cell lines when treated with TAS2R agonist( Reference Jeon, Zhu and Larson 6 , Reference Park, Kim and Kim 32 , Reference Kim, Egan and Jang 33 ). Among bitter compounds with this property loganic acid, a bitter iridoid glycoside isolated from G. scabra and present in EBI, was found( Reference Suh, Lee and Kim 34 ). Moreover, G. lutea bitter compounds were demonstrated to be able to bind several TAS2R including TAS2R1, −4, −39, −43, −46, −47 and −50( Reference Wölfle, Elsholz and Kersten 35 ).
On the other hand the significant 30 % reduction in EI over the post-lunch period and the 22 % reduction within the 24 h following EBIP consumption also demonstrated that a longer time than 3 h was necessary to benefit from the EI control effect of EBI (providing 100 mg secoiridoids) when consumed in a semisolid food (pudding) and together with other solid foods in a real meal (like the breakfast of this study). Thus the fact that other mechanisms such as delayed gastric emptying mediated by interaction of bitter compounds with ions channels could co-work with GLP-1-mediated anorexigenic effect could not be excluded.
The evidence from this study is apparently contradictory to the common tradition of drinking bitter herb infusions to aid digestion or the popular use of bitter wines as aperitifs, leading to a short-term increase in appetite. Actually it is true that the activation of bitter receptors in the GI tract stimulates ghrelin secretion, resulting in a short-term orexigenic effect( Reference Janssen, Laermans and Verhulst 7 ); however, its release is predominant in the stomach( Reference Sakata and Sakai 36 ). This action was abolished in the experimental conditions adopted here as the lipid-based EBI coating was resistant to the hydrolytic environment of the stomach. This was in agreement with the study by Andreozzi et al.( Reference Andreozzi, Sarnelli and Pesce 9 ), in which the use of acid-resistant capsules containing 18 mg of hydrochloride quinine did not affect ghrelin levels.
Data altogether suggested that when bitter compounds are masked to bitter receptors in the stomach (due to coating material or because they are included in a food or a meal) ghrelin secretion is reduced; therefore, over the day a long-term anorexigenic effect is prevalent on the short-term orexigenic effect.
The present study has some limitations as well. First, subjects participated in two randomised 1-d experimental sessions wherein they consumed a EBIP and a CP, once each, during breakfast. Therefore, it could not be excluded that some adaptive mechanisms would emerge and disrupt the maintenance of the effect over time during a continued consumption of EBIP. This point is central from an industry perspective to label an ingredient or food with a claim on satiety, as demonstrated by the failure of several satiety claim submissions to the European Food Safety Authority to be approved because of a lack of evidence that satiety generated by the product reduces EI and/or that the effect is sustained with repeated experience( Reference Halford and Harrold 37 , Reference Chambers, McCrickerda and Yeomans 38 ). Thus, further studies are warranted to verify whether EBIP may sustain EI control over a longer period. Second, the protocol used was primarily designed to verify the effect of EBI on EI in a real-life situation and it did not allow us to ascertain the physiological mechanisms underpinning its activity, which could be only hypothesised on the basis of the biochemical data collected over the 3 h post breakfast and on the basis of previous literature. It could not be ruled out that multiple mechanisms including delayed gastric emptying (mediated by gut hormones or ions channels) or direct effect of anorexigenic hormones co-worked over the 24 h from EBI consumption to determine its EI control effect.
Conclusions
In conclusion, the present study demonstrated that microencapsulation of bitter compounds designed to mask the bitter taste in the mouth and to allow a targeted delivery to the intestine is an effective approach to produce new food ingredients to control EI. These data, together with those from previous studies, suggested that the kinetic of bitter compound delivery along the GI tract is effective in modulation of appetite behaviour finalised to EI reduction in humans.
However, further studies aiming at clarifying the biochemical response underpinning the long-term effect on daily food intake here shown with EBI are warranted to model the kinetic of the delivery of bitter compounds to the GI tract. Modelling the delivery of bitter compounds in the light of physiological effects may be important to foresee the effect of the ingredient on body weight control in overweight subjects upon continued consumption.
Acknowledgements
This study was supported by the programme PON01_ 02863 ‘Incapsulazione di principi attivi per il miglioramento di qualità e sicurezza degli alimenti’ funded by the Italian Ministry of Education, University and Research. P. V. thanks Attilio Visconti for his skillful technical assistance during the study.
The authors’ contributions are as follows: P. V. designed the study; M. A. and F. P. developed the encapsulated bitter ingredients; I. M. conducted the research; R. F. analysed biochemical samples; I. M. analysed questionnaires and performed the statistical analysis; I. M., V. F. and P. V. wrote the paper; P. V. had primary responsibility for the final content. All authors read and approved the final manuscript.
The authors have nothing to disclose.


