


Prior research indicates that having frequent family meals is associated with positive health outcomes in children, including diets of higher nutritional quality and lower weight status( Reference Berge, Wall and Hsueh 1 – Reference McCullough, Robson and Stark 12 ), although not all findings have been consistent( Reference Andaya, Arredondo and Alcaraz 13 , Reference Valdes, Rodriguez-Artalejo and Aguilar 14 ). For example, several longitudinal studies and reviews of the literature have shown that having regular family meals (about 3–5 times/week) as a child is associated with higher intakes of fruits and vegetables, Ca-rich foods, dietary fibre and key nutrients such as Ca and Fe as an adolescent or adult( Reference Larson, Neumark-Sztainer and Hannan 4 , Reference Christian, Evans and Hancock 8 , Reference Utter, Denny and Robinson 9 , Reference Burgess-Champoux, Larson and Neumark-Sztainer 15 – Reference Fruh, Fulkerson and Mulekar 20 ). Additionally, cross-sectional and some longitudinal research has shown that having frequent family meals is associated with reduced risk of overweight/obesity in children and adolescents( Reference Berge, Wall and Hsueh 1 , Reference Valdes, Rodriguez-Artalejo and Aguilar 14 , Reference Hammons and Fiese 21 ). While research suggests that family meals are protective for child diet quality and potentially weight status, little research has examined whether it matters if the family meal is breakfast, lunch or dinner( Reference Blondin, Anzman-Frasca and Djang 22 , Reference Larson, Wang and Berge 23 ). It is important to understand whether one meal type conveys a more positive impact on child diet quality and weight status than another to inform research regarding which meals should be targeted in nutrition interventions. For example, if families are more likely to serve vegetables and fruits at dinner, then it may be important for interventions to target serving vegetables and fruits at family breakfast meals and/or lunches.
Additionally, little is known about the associations between eating breakfast, lunch or dinner together as a family and diet quality and weight status among children of pre-school age (i.e. 2–5 years old) and whether the relationship between eating breakfast, lunch or dinner family meals and diet quality and weight status is comparable to the positive association observed for older children (i.e. 6–12 years old) and adolescents (i.e. 13–18 years old)( Reference Larson, Neumark-Sztainer and Hannan 4 , Reference Andaya, Arredondo and Alcaraz 13 , Reference Larson, Miller and Watts 24 ). Furthermore, previous research examining the protective influence of family meals on diet quality and weight status have not always included diverse samples. When race/ethnicity has been intentionally examined, results have been inconsistent. For example, several studies have shown that family dinner meals are protective for White( Reference Fulkerson, Larson and Horning 25 ) and African-American youth( Reference Berge, Wall and Hsueh 1 , Reference Rollins, Belue and Francis 26 ), but not for Hispanic youth( Reference Fulkerson, Neumark-Sztainer and Hannan 2 , Reference Rollins, Belue and Francis 26 , Reference Fulkerson, Pasch and Stigler 27 ).
Thus, a first step in moving the field forward in understanding more about family meal type and associations with child diet quality would be to examine the types of family meals being eaten by pre-school children and their families and to examine whether the frequency of eating breakfast, lunch, dinner or total weekly family meals differs by sociodemographic characteristics and other household characteristics (i.e. family structure, working status, income, education). Additionally, it would be important to understand whether child overall diet quality and weight status are more strongly associated with one specific type of meal (i.e. breakfast, lunch, dinner) or the total number of family meals. Furthermore, examining whether one specific family meal type or the total number of family meals confers greater health behaviour benefits for different racial/ethnic groups would also be important.
Examining associations between the frequency of eating breakfast, lunch or dinner family meals and child diet quality and weight status may also be important for informing the design of public health messages and interventions to promote particular family meals. For example, if results show that eating breakfast, lunch or dinner family meals to be equally associated with higher diet quality and lower weight status in pre-school children, then public health messages could inform parents that eating any meal together as a family may be beneficial for child weight and weight-related behaviours. Such messages would have the potential to reduce barriers to eating family meals and increase the likelihood that more families would benefit from the protective nature of family meals.
There are two aims of the current study: (i) to describe the frequency of eating breakfast, lunch, dinner and total weekly family meals among Hispanic and non-Hispanic pre-school children aged 2–5 years, including differences according to sociodemographic and other household characteristics; and (ii) to examine the association of the frequency of eating breakfast, lunch, dinner and total weekly family meals with child diet quality and BMI percentile among Hispanic and non-Hispanic pre-school children. The main hypothesis is that the frequency of eating all types of family meals (i.e. breakfast, lunch, dinner) will be associated with similar benefits for healthier weight and higher diet quality in pre-school children.
Methods
Study design and population
The present study uses baseline data from the NET-Works( Reference Sherwood, French and Veblen-Mortenson 28 ) (Now Everybody Together for Amazing and Healthy Kids) and GROW( Reference Po’e, Heerman and Mistry 29 ) (Growing Right Onto Wellness) studies. These two studies are 3-year randomized childhood obesity prevention trials, which are a part of the National Institutes of Health’s (NIH) Childhood Obesity Prevention and Treatment Research (COPTR) Consortium (intervention years 2013–2017). Both sites included samples with over 50 % Hispanic households and the majority of families earning less than $US 50 000 per year, which allows for examining associations between family meal type and diet quality and weight status in minority and low-income populations
NET-Works study
In 2012–2014 the NET-Works study (clinical trial registration number NCT01606891) recruited and randomized 534 pre-school children who were 2–4 years old, above the 50th percentile for age- and sex-adjusted height and weight (as measured by the Centers for Disease Control and Prevention standardized growth charts( Reference Kuczmarski, Ogden and Grummer-Strawn 30 )) and from low-income households (<$US 65 000 annual household income) in the Minneapolis and St. Paul area, Minnesota, USA( Reference Sherwood, French and Veblen-Mortenson 28 ). The NET-Works intervention integrates and links resources across home, community, primary-care clinics and neighbourhoods to promote healthy eating and activity patterns and body weight among lower-income, racially/ethnically diverse pre-school children.
GROW study
In 2012–2014 the GROW study (clinical trial registration number NCT01316653)( Reference Po’e, Heerman and Mistry 29 ) randomized 610 parent–pre-school child (ages 3–5 years) pairs from underserved, low-income communities in Nashville, Tennessee, USA. Eligible children were between the 50th and 95th percentile for age- and sex-adjusted height and weight (as measured by the Centers for Disease Control and Prevention standardized growth charts( Reference Kuczmarski, Ogden and Grummer-Strawn 30 )). Additionally, potential participants were eligible for GROW if they received at least one form of government assistance, spoke English or Spanish, the parent was over 18 years old, and both parent and child could participate in physical activity. The GROW intervention is a staged-intensity behavioural intervention. Throughout the intervention parents and children build skills in nutrition, physical activity and parenting, with a concurrent focus on forming new social networks and utilizing the built environment of parks and recreation for family health.
Complete details about the NET-Works( Reference Sherwood, French and Veblen-Mortenson 28 ) and GROW( Reference Po’e, Heerman and Mistry 29 ) study designs, full inclusion/exclusion criteria, intervention and evaluation are published elsewhere( Reference Sherwood, French and Veblen-Mortenson 28 , Reference Po’e, Heerman and Mistry 29 ). The Institutional Review Board (IRB) Human Subjects Committee at the University of Minnesota and Vanderbilt University approved all protocols used in NET-Works and GROW study, respectively. All participants signed written informed consent prior to participation into the respective studies. Additionally, the University of North Carolina at Chapel Hill IRB, which is the coordinating centre for the COPTR Consortium, approved the analysis of the data from both studies.
Measures
Standardized objective measures, including three 24 h dietary recalls, anthropometry and parent self-report surveys, were conducted by trained and certified research staff from the NET-Works and GROW studies in participants’ homes or local community centres. All surveys were administered in English or Spanish according to participant preference and completed by the index parent/guardian prior to randomization.
Exposure variables: family meals
Questions assessing the frequency of breakfast (el desayuno), lunch (el almuerzo), dinner (la cena) and total weekly family meals were taken from previously validated surveys( Reference Christian, Evans and Hancock 8 , Reference Andaya, Arredondo and Alcaraz 13 , Reference Neumark-Sztainer, Larson and Fulkerson 31 ). Frequency of breakfast, lunch and dinner family meals was measured at baseline. The primary caregiver/guardian was asked three questions about family meals. For the NET-Works study, primary caregivers were asked: ‘During the past seven days, how often did your family eat breakfast (lunch, dinner) together?’ (response options: 0, 1–2, 3–4, 5–6 or 7 times). GROW study primary caregivers were asked: ‘During the past seven days, how often did most of your family eat breakfast (lunch, dinner) together?’ (response options: 0, 1–2, 3–4, 5–6 or 7 times). Thus, the family meal frequency questions were asked slightly differently at each site. A pseudo-continuous variable was created for analyses by coding the categorical response options as 0, 1·5, 3·5, 5·5 and 7, respectively, for each of the questions about breakfast, lunch and dinner family meals. The total weekly family meals variable was the sum of the variables for breakfast, lunch and dinner.
Outcome variables
Child height and weight
Child height and weight were measured with the participant in light clothing without shoes. Body weight was measured to the nearest 0·1 kg using a calibrated electronic scale (Seca Corp., Chino, CA, USA). Height was measured to the nearest 0·1 cm using a portable stadiometer (Seca Corp.). Measures were conducted in duplicate and averaged. BMI was calculated as weight in kilograms divided by the square of height in metres and transformed to age- and sex-specific percentiles based on Centers for Disease Control and Prevention guidelines( 32 ).
Child dietary quality
In both studies, child dietary quality was assessed using the Nutrition Data Software for Research (NDS-R) version 2010 (Nutrition Coordinating Center, University of Minnesota, Minneapolis, MN, USA). Three 24 h dietary recalls were pre-scheduled with the parent and administered by telephone in English or Spanish. The primary caregiver or guardian served as proxy for the child to report the child’s previous day intake. Booklets showing food amounts were used by the respondent to assist in identifying portion sizes. For children in childcare, food records were given to the childcare provider and the completed form was used by the parent to report foods the child consumed while in childcare. Diet recalls were conducted on weekdays and weekend days with a maximum of three recalls (two weekdays and one weekend day) and a minimum of two dietary recalls. Total energy, nutrients and food groups from the two or three dietary recalls were averaged to estimate the child’s typical diet quality.
Dietary quality was computed using the 2010 Healthy Eating Index (HEI-2010)( Reference Guenther, Casavale and Reedy 33 , Reference Guenther, Kirkpatrick and Reedy 34 ). The HEI-2010 includes nine adequacy components (total fruit, whole fruit, total vegetables, greens and beans, whole grains, dairy, total protein foods, seafood and plant proteins, fatty acids) and three moderation components (refined grains, sodium, empty calories). Participants received a score for the twelve components and the component scores were summed to create the total HEI-2010 score. For the adequacy components, a higher score indicates higher consumption and for the moderation components, a higher score indicates lower consumption. The total HEI-2010 score’s upper range is 100, with higher scores indicating better child diet quality.
Covariates
All demographic covariates were chosen because of prior research showing they are confounders of the relationship between the exposure and outcome variables in the study( Reference Berge, Wall and Hsueh 1 , Reference Larson, MacLehose and Fulkerson 3 , Reference Pourhoseingholi, Baghestani and Vahedi 35 ).
Demographic variables
Children were categorized as Hispanic or non-Hispanic for the analysis based on parent report. The primary parent/guardian also reported the age (date of birth) and sex of the child and his/her own marital status (married/living as married, single), employment status (full-time, part-time, not working for pay) and country of birth (born in USA; yes, no). Household education was calculated using the highest level of education reported from the following two sources: the index parent’s self-reported education level and the highest education of other adults in household (<high school, high school or equivalent, at least some college). Annual household income (<$US 14 999, $US 15 000–24 999, $US 25 000–34 999, $US 35 000–79 999, don’t know, no response) and household-level participation in the Supplemental Nutrition Assistance Program (SNAP) and Special Supplemental Nutrition Program for Women, Infants, and Children (WIC) were self-reported by the primary caregiver.
Statistical analysis
Data from the NET-Works and GROW studies were combined and all analyses were pre-stratified by Hispanic origin a priori, based on previous studies showing differential benefits of family meals for non-Hispanic v. Hispanic populations( Reference Fulkerson, Neumark-Sztainer and Hannan 2 , Reference Rollins, Belue and Francis 26 , Reference Fulkerson, Pasch and Stigler 27 ). Eleven participants from the GROW study were excluded from analyses based on the following reasons: having fewer than two dietary recalls (n 1), missing one or more family meals questions (n 3) or having a BMI percentile outside the range (i.e. <50th percentile or >95th percentile; n 7). The final analysis sample was 276 non-Hispanics and 857 Hispanics. Unadjusted mean numbers of breakfast, lunch, dinner and total weekly family meals were compared across sociodemographic characteristics using linear regression (PROC GENMOD with linear distribution and LSMEANS option). Bonferroni corrections were made to account for the multiple comparisons. The corrected level of statistical significance was P<0·00143 for non-Hispanics and P<0·00161 for Hispanics.
The associations between breakfast, lunch, dinner and total weekly family meals and the HEI-2010 and BMI percentile using linear regression (PROC GENMOD with linear distribution) was examined. For each meal type, three models were run. Model 1 was unadjusted and Model 2 adjusted for age, sex, marital status, employment status and study site. Model 3 adjusted for all the covariates in Model 2 plus the number of times the other two family meals were eaten together, to try and distinguish each meal’s effect from the total number of meals consumed together. We also adjusted for race/ethnicity in Models 2 and 3 for the non-Hispanics. When the outcome of interest was BMI percentile, we included mean total daily energy intake in the adjusted regression models. Data were analysed using the statistical software package SAS version 9.3 (2016).
Results
The mean age of children in the sample was 3·5 (sd 0·9) years for non-Hispanic children and 4·0 (sd 0·9) for Hispanic children. About 49 % of the children were male (Table 1). By design of the studies, about half of the children were in the upper range of the normal weight category as defined by BMI percentile and half were in the overweight/obese range. The mean age of parent participants was 31·5 (sd 6·8) years for non-Hispanic parents and 31·9 (sd 6·0) years for Hispanic parents. Most parents were overweight or obese. Average household income was <$US 35 000 per year and over 50 % of Hispanic participants had less than a high school education, while over 70 % of non-Hispanic participants had at least some college education.
Table 1 Mean and frequency distribution of sociodemographic characteristics for non-Hispanic and Hispanic households; baseline data from NET-Works and GROW studies among parent–child (aged 2–5 years) pairs from respectively Minnesota (n 222 non-Hispanics; n 312 Hispanics) and Tennessee (n 545 Hispanics; n 55 non-Hispanics), USA, 2012–2014
NET-Works, Now Everybody Together for Amazing and Healthy Kids; GROW, Growing Right Onto Wellness; SNAP, Supplemental Nutrition Assistance Program; WIC, Special Supplemental Nutrition Program for Women, Infants, and Children; HEI-2010, Health Eating Index-2010.
Frequency of eating breakfast, lunch, dinner and total weekly family meals
Overall, non-Hispanic and Hispanic households had similar frequency patterns of eating breakfast, lunch, dinner and total weekly family meals (Fig. 1).
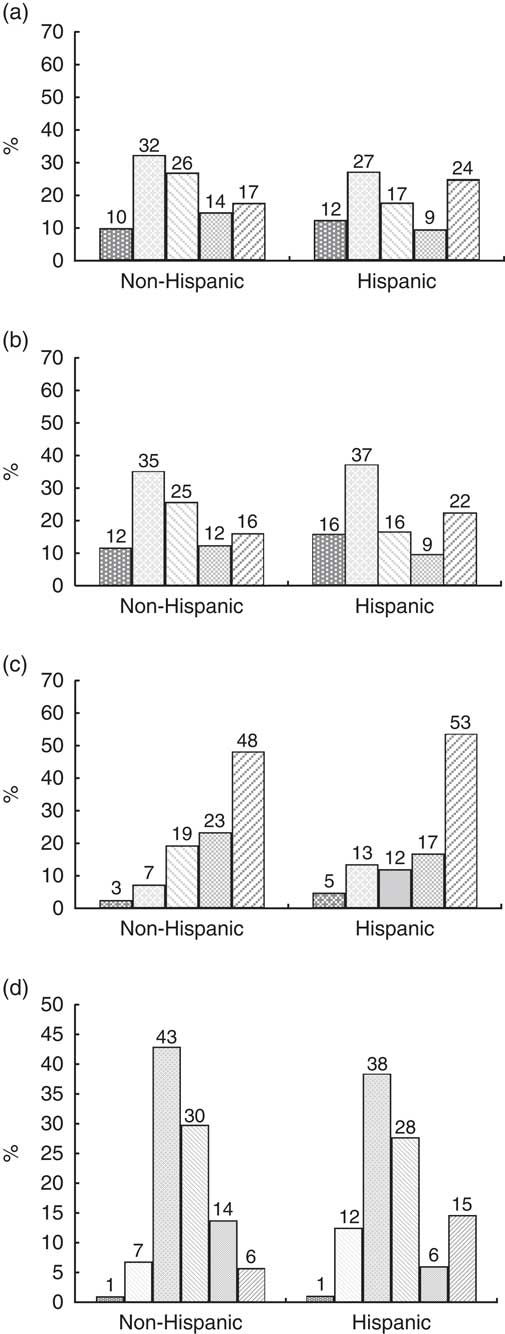
Fig. 1 Distribution of eating breakfast (a), lunch (b), dinner (c) and total family meals (d) among non-Hispanic and Hispanic households; baseline data from NET-Works and GROW studies among parent–child (aged 2–5 years) pairs from respectively Minnesota (n 222 non-Hispanics; n 312 Hispanics) and Tennessee (n 545 Hispanics; n 55 non-Hispanics), USA, 2012–2014. Frequency of eating breakfast family meals, lunch family meals and dinner family meals: ![]() , never;
, never; ![]() , 1–2 times/week;
, 1–2 times/week; ![]() , 3–4 times/week;
, 3–4 times/week; ![]() , 5–6 times/week;
, 5–6 times/week; ![]() , 7 times/week. Frequency of eating total family meals:
, 7 times/week. Frequency of eating total family meals: ![]() , never;
, never; ![]() , 1 to <5 times/week;
, 1 to <5 times/week; ![]() , 5 to <11 times/week;
, 5 to <11 times/week; ![]() , 11 to <17 times/week;
, 11 to <17 times/week; ![]() , 17 to <21 times/week;
, 17 to <21 times/week; ![]() , 21 times/week (NET-Works, Now Everybody Together for Amazing and Healthy Kids; GROW, Growing Right Onto Wellness)
, 21 times/week (NET-Works, Now Everybody Together for Amazing and Healthy Kids; GROW, Growing Right Onto Wellness)
Breakfast
Breakfast family meal patterns (Fig. 1(a)) were similar for non-Hispanic and Hispanic households, with the majority of families eating breakfast family meals between one and four times weekly. About 20 % of all children ate five or more breakfast family meals per week.
Lunch
Lunch family meal patterns (Fig. 1(b)) were similar for non-Hispanic and Hispanic households, with the majority of families eating between one and four lunch family meals per week. About 20 % of all children ate five or more lunch family meals weekly.
Dinner
Dinner family meal patterns (Fig. 1(c)) were similar for non-Hispanic and Hispanic households, with almost 90 % of families eating three or more family dinner meals per week. About 50 % of all pre-school children ate seven family dinner meals weekly.
Total meals
The majority of non-Hispanic and Hispanic households ate between five and sixteen meals per week (Fig. 1(d)). A larger percentage of Hispanic households (15 %) ate all family meals (twenty-one meals in total) together compared with 6 % of non-Hispanic households.
Differences in the frequency of having breakfast, lunch and dinner family meals by sociodemographic characteristics
There were some significant differences in family meal frequency by sociodemographic characteristics (Table 2). Non-Hispanic White children on average had significantly more breakfast family meals compared with non-Hispanic Black children and non-Hispanic multiracial children. In addition, non-Hispanic normal-weight parents on average had significantly more breakfast family meals compared with non-Hispanic parents who were obese. Additionally, younger Hispanic children on average had more breakfast, lunch and total family meals compared with older Hispanic children. For both non-Hispanic and Hispanic pre-school children, there was a higher frequency of eating breakfast, lunch, dinner and total weekly family meals when children were from households where a parent was either not working for pay or working part-time compared with children from households where a parent was working full-time.
Table 2 Unadjusted mean number of breakfast, lunch and dinner family meals per week among non-Hispanic and Hispanic households; baseline data from NET-Works and GROW studies among parent–child (aged 2–5 years) pairs from respectively Minnesota (n 222 non-Hispanics; n 312 Hispanics) and Tennessee (n 545 Hispanics; n 55 non-Hispanics), USA, 2012–2014
NET-Works, Now Everybody Together for Amazing and Healthy Kids; GROW, Growing Right Onto Wellness; SNAP, Supplemental Nutrition Assistance Program; WIC, Special Supplemental Nutrition Program for Women, Infants, and Children.
Greyed cells indicate significance after Bonferroni correction (P<0·00143 for non-Hispanics and P<0·00161 for Hispanics).
Associations between breakfast, lunch and dinner family meals and pre-school children’s Healthy Eating Index-2010 score and BMI percentile
Breakfast family meals
There was a statistically significant positive association between eating breakfast family meals and diet quality as measured by HEI-2010 in non-Hispanic pre-school children compared with Hispanic pre-school children in all models (P<0·05; Table 3). For example, for every one-day increase in eating breakfast family meals, non-Hispanic pre-school children’s HEI-2010 scores were higher by 1·30, after adjusting for sociodemographic characteristics and lunch and dinner family meals. There were no significant findings for breakfast family meal frequency and weight status for non-Hispanic or Hispanic pre-school children.
Table 3 Associations between family meal type (breakfast, lunch, dinner, total meals) and pre-school children’s diet quality and BMI percentile among non-Hispanic and Hispanic households; baseline data from NET-Works and GROW studies among parent–child (aged 2–5 years) pairs from respectively Minnesota (n 222 non-Hispanics; n 312 Hispanics) and Tennessee (n 545 Hispanics; n 55 non-Hispanics), USA, 2012–2014

NET-Works, Now Everybody Together for Amazing and Healthy Kids; GROW, Growing Right Onto Wellness; SNAP, Supplemental Nutrition Assistance Program; WIC, Special Supplemental Nutrition Program for Women, Infants, and Children; HEI-2010, Health Eating Index-2010.
Estimates are beta coefficients. Interpretation=for every one-day increase in eating (breakfast, lunch, dinner, total) family meals, HEI-2010 score and BMI percentile changes. Values shown in bold are significant at P<0·05.
* Model 1: unadjusted.
† Model 2: adjusted for age, sex, marital status, employment status and site. For non-Hispanic participants, also adjusted for race/ethnicity. BMI models also adjusted for mean total daily energy intake.
‡ Model 3: adjusted for all of the covariates in Model 2 plus the frequency of the other two family meals.
Lunch and dinner family meals
There were no significant findings for lunch or dinner family meals and HEI-2010 or weight status for non-Hispanic or Hispanic pre-school children (Table 3).
Total meals
There was a significant positive association between the total number of family meals eaten per week and HEI-2010 scores in non-Hispanic pre-school children compared with Hispanic pre-school children in all models (P<0·05; Table 3). There were no significant associations between the total number of family meals per week and weight status for non-Hispanic or Hispanic pre-school children (Table 3).
The online supplementary material, Supplemental Table 1, shows associations between family meal types (breakfast, lunch, dinner, total meals) and diet quality scores for each of the twelve HEI-2010 components among non-Hispanic and Hispanic pre-school children. As can be seen, specific components (e.g. fruit, vegetables, greens and beans, seafood and plant proteins) consistently contributed to the finding that breakfast and overall total family meals are beneficial for the diet quality of non-Hispanic pre-school children but not for Hispanics.
Discussion
The present results indicated that most children of pre-school age ate breakfast and lunch family meals at least once or twice per week and more than half of children ate dinner family meals five or more times per week. Limited prior research has examined breakfast, lunch and dinner family meal patterns( Reference Larson, MacLehose and Fulkerson 3 , Reference Andaya, Arredondo and Alcaraz 13 ) in pre-school children; thus, these new findings add to the pre-existing literature on family meals and suggest that it is fairly common for families with pre-school children to eat breakfast and lunch family meals( Reference Larson, MacLehose and Fulkerson 3 ). Additionally, family dinner meal frequency results in the current study are consistent with previous studies among older children showing that it is common for families to eat at least five family dinner meals or more per week( Reference Fulkerson, Neumark-Sztainer and Hannan 2 , Reference Larson, Neumark-Sztainer and Hannan 4 , Reference Fulkerson, Kubik and Story 18 , Reference Neumark-Sztainer, Hannan and Story 36 ).
There were some significant differences in the frequency of eating family meals within meal type by sociodemographic characteristics. For example, in households where a parent worked part-time or did not work for pay, pre-school children ate more breakfast, lunch, dinner and total family meals compared with pre-school children who had a parent who worked full-time. This may mean that family meals are more challenging/logistically problematic (e.g. time constraints) to carry out for families where the primary caregiver works full-time.
Results indicated that frequency of breakfast family meals per week and total weekly family meals (any type – breakfast, lunch, dinner) were significantly associated with non-Hispanic pre-school children’s diet quality, but these associations were not evident for Hispanic pre-school children. This result corroborates prior research showing that the frequency of breakfast family meals and total weekly family meals are positively associated with better diet quality for children of elementary-school age and adolescents( Reference Berge, Wall and Hsueh 1 – Reference Larson, Neumark-Sztainer and Hannan 4 , Reference Woodruff, Hanning and McGoldrick 10 , Reference Andaya, Arredondo and Alcaraz 13 , Reference Larson, Fulkerson and Story 37 ) and extends previous studies by showing that pre-school children receive dietary benefits from breakfast family meals too. This result is also consistent with previous literature showing that associations between family meals and diet quality are more likely to be observed among non-Hispanic children compared with Hispanic children( Reference Fulkerson, Neumark-Sztainer and Hannan 2 , Reference Rollins, Belue and Francis 26 , Reference Fulkerson, Pasch and Stigler 27 ). One potential reason why only breakfast and total family meals were significantly associated with pre-school children’s diet quality may be because the frequency of having family dinner meals was already high. Additionally, one potential reason why significant results were not found for Hispanic children may be that the study did not measure the concept of merienda, which is a light meal eaten multiple times throughout the day. This concept is common in Latin American families. Thus, if Hispanic pre-school children were eating multiple types of meals per day it may have resulted in systematic measurement error that resulted in null findings for this group.
Furthermore, there were no significant associations found between family meal frequency by meal type and child BMI percentile for non-Hispanic or Hispanic pre-school children. This finding supports prior research conducted with elementary-school-aged children and adolescents that shows mixed findings regarding family meal frequency and child weight status( Reference Fulkerson, Neumark-Sztainer and Hannan 2 , Reference Fulkerson, Kubik and Story 18 , Reference Fulkerson, Larson and Horning 25 , Reference Rollins, Belue and Francis 26 , Reference Wurbach, Zellner and Kromeyer-Hauschild 38 – Reference Berge, Rowley and Trofholz 43 ). One potential reason for this finding is that although the diet quality of foods consumed by children at family meals may be healthier (e.g. fruits, vegetables), the portion sizes of food consumed by children at family meals may still be large; thus, higher energy intake at family meals would not lead to lower weight status in children. Another reason may be that the weight status range in the samples was somewhat restricted, with one study having children between the 50th and 95th BMI percentile and the other study having all children at the 50th percentile or above.
There were several strengths and limitations of the study. Strengths of the study include the use of two large diverse samples from different parts of the USA with some common measures made possible through being part of a NIH-funded consortium; inclusion of a lower-income sample; detailed questions about family meal types; strong dietary intake assessment measures; and objectively measured child BMI. One limitation of the study was the inclusion of a restricted range of weight status, only including children from the 50th BMI percentiles and higher because these studies were obesity prevention trials. Another limitation is the cross-sectional nature of the baseline data, precluding the ability to examine temporal associations. An additional limitation was the use of single-item questions assessing breakfast, lunch and dinner family meal frequencies. Furthermore, the family meal frequency questions were slightly different between NET-Works and GROW and it is possible that the different wording of the family meals frequency questions (i.e. ‘How often did most of your family members eat…’ v. ‘How often did your family eat…’) could explain some differences between groups. In addition, although 24 h dietary recalls are a stronger measure than self-report dietary intake, they still have inherent limitations such as day-to-day variability as well as larger errors for foods with higher energy density. Another limitation is that other important variables that could impact the association between family meals and diet quality, such as acculturation and parenting practices (e.g. parent feeding practices, parent modelling of healthy eating), were not assessed due to not having similar measures across the two sites. These measures would be important to include in future research.
Implications for research and practice
Results of the current study suggest that eating breakfast, lunch and dinner family meals was fairly common among non-Hispanic and Hispanic pre-school children. In addition, there were significant associations between frequency of breakfast and total weekly family meals and diet quality among non-Hispanic pre-school children, but not among Hispanic pre-school children. Findings from the current study may have implications for practice and research. While it appears that for non-Hispanic pre-school children having breakfast and regular family meals across the week confers some dietary benefit, clinicians who work with families with pre-school children may want to be cautious in recommending the importance of having frequent breakfast, lunch or dinner family meals until more research can confirm or refute the current study findings. Specifically, longitudinal research is needed to understand more fully the association between the frequency of breakfast, lunch, dinner and total family meals and pre-school children’s diet quality and weight status.
Supplementary material
To view supplementary material for this article, please visit https:/doi.org/10.1017/S1368980017002348
Acknowledgements
Financial support: This research was supported by grant number U01HD068990 (S.A.F and N.E.S. co-principal investigators; ClinicalTrials.gov identifier: NCT01606891), with additional support from other members of the Childhood Obesity Prevention and Treatment Research (COPTR) Consortium (grant numbers U01HL103622, U01HL103629, U01HL103620 and U01HL103561) supported by the National Heart, Lung, and Blood Institute (NHLBI), the Eunice Kennedy Shriver National Institute of Child Health and Development (NICHD), and the Office of Behavioral and Social Sciences Research, National Institutes of Health (NIH). J.M.B.’s time was supported by an R56 grant from the NHLBI (number HL116403). W.J.H.’s time was supported by a K12 grant from the Agency for Healthcare Research and Quality (number 1K12HS022990). Additionally, REDCap data collection was used, supported by grant number UL1TR000114 from the National Center for Advancing Translational Sciences (NCATS) and dietary data collected at Vanderbilt University was supported by grant number DK56350 from the National Institute of Diabetes and Digestive and Kidney Diseases (NIDDK). The content is solely the responsibility of the authors and does not necessarily represent the official views of the NHLBI, the NICHD, the Office of Behavioral and Social Sciences Research or the NIH. Conflict of interest: Authors have no conflicts of interest to report. Authorship: All co-authors made a substantial contribution to the paper as described below and agree to be accountable for all aspects of the work regarding the accuracy or integrity of any part of the work. J.M.B. conceptualized the paper, assisted with data analysis and interpretation, wrote all drafts of the paper, and gave final approval of this version to be published. K.P.T. conducted the data analysis, critically reviewed the paper, and gave final approval of this version to be published. N.E.S. is a co-principal investigator on the NET-Works grant, she assisted with data interpretation, critically reviewed the paper, and gave final approval of this version to be published. N.M. assisted with data analysis and interpretation, critically reviewed the paper, and gave final approval of this version to be published. W.J.H. assisted with interpretation of the data, critically reviewed the paper, and gave final approval of this version to be published. S.B. is the principal investigator on the GROW grant, she critically reviewed the paper, and gave final approval of this version to be published. D.M. assisted with conceptualization of the paper, critically reviewed the paper, and gave final approval of this version to be published. C.E.L.-L. assisted with conceptualization of the paper, she critically reviewed the paper, and gave final approval of this version to be published. S.A.F. is a co-principal investigator on the NET-Works grant, she critically reviewed the paper, and gave final approval of this version to be published. Ethics of human subject participation: The IRB Human Subjects Committee at the University of Minnesota and Vanderbilt University approved all protocols used in the NET-Works and GROW study, respectively. All participants signed written informed consent prior to participation into the respective studies. Additionally, the University of North Carolina at Chapel Hill IRB, which is the coordinating centre for the COPTR Consortium, approved the analysis of the data from both studies.


