


The International Nosocomial Infection Control Consortium (INICC) published international reports providing data on ventilator-associated pneumonia (VAP) and clinical outcomes of low- and middle-income countries (LMICs) in 2006, Reference Rosenthal, Maki and Salomao1 2008, Reference Rosenthal, Maki and Mehta2 2010, Reference Rosenthal, Maki and Jamulitrat3 2012, Reference Rosenthal, Bijie and Maki4 2014, Reference Rosenthal, Maki and Mehta5 2016, Reference Rosenthal, Al-Abdely and El-Kholy6 2019, Reference Rosenthal, Bat-Erdene and Gupta7 and 2021. Reference Rosenthal, Duszynska and Bat-Erdene8 Device utilization in INICC ICUs was comparable to that reported by the US Centers for Disease Control and Prevention National Healthcare Safety Network (CDC-NHSN) for ICUs, but INICC VAP rates were greater. Reference Rosenthal, Maki and Jamulitrat3 According to the CDC-NHSN, the VAP rate in medical surgical ICUs and all other ICUs with ≤15 beds in United States is 1.1 VAP cases per 1,000 mechanical ventilator (MV) days. Reference Dudeck9 In the most recent international data for INICC ICUs, the pooled VAP rate was 10 times greater than those reported for CDC-NHSN ICUs (11.47 vs 1.1 per 1,000 ventilator days). Reference Rosenthal, Duszynska and Bat-Erdene8 In INICC reports, the crude mortality rate in ICU patients without healthcare-associated infection (HAI) is 17.12% (95% CI, 16.93–17.32); for those with VAP it is 42.32% (95% CI, 40.61–44.09); and for those with VAP plus CLABSI plus CAUTI it is 63.44% (95% CI, 55.99–71.60). Reference Rosenthal, Duszynska and Bat-Erdene8 A recent study demonstrated that VAP is an independent risk factor for mortality in a multiple logistic regression analysis (adjusted OR [aOR], 1.48; P < .0001). Reference Rosenthal, Yin and Lu10
The appropriate interventions to prevent VAP in LMICs have yet to be analyzed thoroughly and data are very limited. It is necessary to develop more definitive approaches for VAP prevention for implementation in LMICs. Researchers have identified the following VAP risk factors (RFs): tracheostomy, Reference Sugerman, Wolfe and Pasquale11,Reference Ibrahim, Tracy, Hill, Fraser and Kollef12 length of stay (LOS), Reference Talon, Mulin, Rouget, Bailly, Thouverez and Viel13,Reference Sofianou, Constandinidis, Yannacou, Anastasiou and Sofianos14 older age, Reference Bauer, Ferrer, Angrill, Schultze-Werninghaus and Torres15 trauma patients, Reference Charles, Kali and Easow16 postsurgical patients, Reference Garibaldi, Britt, Coleman, Reading and Pace17 burns patients, Reference Garibaldi, Britt, Coleman, Reading and Pace17 longer duration of surgery, Reference Grobmyer, Maniscalco, Purdue and Alcohol18 history of smoking, Reference Grobmyer, Maniscalco, Purdue and Alcohol18 low serum albumin concentration, Reference Garibaldi, Britt, Coleman, Reading and Pace17 high score on the American Society of Anesthesiologists (ASA) Physical Status Classification System, Reference Garibaldi, Britt, Coleman, Reading and Pace17 Acute Physiology and Chronic Health Evaluation (APACHE II) score >20, Reference Sofianou, Constandinidis, Yannacou, Anastasiou and Sofianos14 acute respiratory distress syndrome, Reference Chastre, Trouillet and Vuagnat19 lung injury, Reference Chastre, Trouillet and Vuagnat19 chronic obstructive pulmonary disease, Reference Charles, Kali and Easow16 upper respiratory tract colonization, Reference Charles, Kali and Easow16 sinusitis, Reference Charles, Kali and Easow16 PaO2:FiO2 ratio <200 mmHg, Reference Sofianou, Constandinidis, Yannacou, Anastasiou and Sofianos14 oropharyngeal colonization, Reference Bauer, Ferrer, Angrill, Schultze-Werninghaus and Torres15 biofilm on the surface and within lumen of the endotracheal tube, Reference Charles, Kali and Easow16 duration of mechanical ventilation (MV), Reference Sofianou, Constandinidis, Yannacou, Anastasiou and Sofianos14,Reference Bauer, Ferrer, Angrill, Schultze-Werninghaus and Torres15 frequent change in ventilator circuit, Reference Charles, Kali and Easow16 lack of use of heat and moist exchange humidifiers, Reference Charles, Kali and Easow16 supine position, Reference Bauer, Ferrer, Angrill, Schultze-Werninghaus and Torres15,Reference Pelosi, Brazzi and Gattinoni20 frequent reintubation, Reference Charles, Kali and Easow16 enteral feeding, Reference Charles, Kali and Easow16 multiple central venous line insertions, Reference Ibrahim, Tracy, Hill, Fraser and Kollef12 presence of catheter-related infection, Reference Sofianou, Constandinidis, Yannacou, Anastasiou and Sofianos14 paralytic agents, Reference Charles, Kali and Easow16 previous use of broad-spectrum antibiotics, Reference Talon, Mulin, Rouget, Bailly, Thouverez and Viel13,Reference Bauer, Ferrer, Angrill, Schultze-Werninghaus and Torres15 and patients transported out of an ICU. Reference Charles, Kali and Easow16
Additional epidemiological studies need to be conducted to achieve an understanding of VAP risk factors in LMICs. Currently, no study has analyzed multiple countries simultaneously to identify VAP RFs in ICUs, nor has any study been conducted prospectively with a standardized form over 24 years. Also, no study has analyzed any of the following variables and their association with VAP: income level of the country according to the World Bank; facility ownership; hospitalization type; and ICU type. And all of these factors are important in understanding the unique challenges in LMICs.
The objective of this study was to simultaneously analyze the following 10 variables to identify VAP RFs in LMICs: (1) age, (2) sex, (3) duration of MV, (4) MV utilization ratio as marker of severity of illness of patients, (5) LOS, (6) type of respiratory support, (7) type of hospitalization, (8) ICU type, (9) facility ownership, and (10) income level according to the World Bank.
Methods
Study population and design
This prospective observational cohort study included patients admitted to 743 ICUs of 282 hospitals in 144 cities in 42 Asian, African, European, Latin American, and Middle Eastern countries across 24 years between July 1, 1998, and February 12, 2022.
Prospective cohort in ICUs and surveillance of HAIs
Each patient’s data were gathered at the time of ICU admission. An infection prevention professional (IPP) visited each patient’s bedside daily from the time of admission until discharge. This analysis prospectively included all adult and pediatric patients hospitalized in an ICU with or without HAI, and their data were gathered utilizing the INICC Surveillance Online System (ISOS). Reference Rosenthal21 An IPP brings a tablet to each hospitalized patient’s bedside in the ICU, signs in to the ISOS, and simultaneously uploads patient data. Reference Rosenthal21
Information provided at the time of admission includes setting (eg, nation, city, name of the hospital, and the ICU type) as well as information about the patient such as age, type of hospitalization, use of invasive devices (central line [CL], MV, urinary catheter [UC]), and presence of infection. Reference Rosenthal21 Every day until the patient is discharged, an IPP uploads details regarding invasive devices (CL, MV, and/or UC) and positive cultures (blood, urine, and respiratory samples) for each patient. Reference Rosenthal21
If the patient has signs or symptoms of infection, an infectious diseases specialist approaches the patient to determine the presence of an HAI (CLABSI, VAP, or CAUTI). According to the CDC-NHSN, an IPP looks at a patient’s signs and symptoms, cultures, radiographs, and other criteria that fulfill definitions of HAI. 22
Over the 24 years of this study, all IPPs of all participant hospitals have been applying the current and updated CDC definitions of HAI. That is, whenever the CDC updated their definitions, our IPPs began using the new updated definitions.
When IPPs upload the results of a culture to the ISOS, the ISOS immediately displays a message and directs the IPP to an online module of the ISOS where the IPP can check all the CDC-NHSN criteria to determine the presence of a HAI and the type of HAI (CLABSI, VAP, or CAUTI). Reference Rosenthal21
Daily device utilization checks are performed by ISOS. When a bias in patient days or device use is detected from admission to discharge, the ISOS notifies an IPP. The ISOS data may show that the patient has been hospitalized in the ICU without any devices in place, most likely because the IPP forgot to upload the use of devices or forgot to upload the discharge of the patient. If the ISOS detects the lack of use of any kind of device on any given day, it sends a message to the IPP to upload missing devices or upload the discharge of the patient. In other words, the ISOS asks the IPP to investigate why a patient in an ICU does not have any devices in place. Reference Rosenthal21 This approach significantly reduces biases associated with device utilization, patient days, and discharge conditions. Reference Rosenthal21
Patients with missing data were excluded from this study. The institutional review boards of the participating hospitals approved this study. Patient and hospital identities have been excluded for confidentiality.
INICC surveillance online system
Standard CDC-NSHN methodologies state that HAI denominators are device days gathered from all patients as pooled data, without mentioning the characteristics of particular patients or the quantity of device days associated with particular patients. 22 INICC HAI surveillance is carried out through an online platform, the ISOS, which includes CDC-NHSN criteria and methods. 22
Additionally, ISOS includes the gathering of patient-specific information on all patients, including those with and those without HAI, with a several variables per patient. Reference Rosenthal21 The ability to match data from all patients admitted to ICUs by different variables allows for the estimation of the VAP RFs. The CDC-NHSN criteria and methods are used in the data uploaded to ISOS to identify HAIs, to estimate HAI rates, and to determine device utilization ratios. 22
Validation of diagnosis of healthcare-associated infections
Validation of an HAI is a unique feature of the ISOS and is considered essential for maximizing the sensitivity and accuracy of surveillance data. Each HAI reported by an IPP is validated, that is, scrutinized to ascertain that criteria are fulfilled to justify its recording as an HAI. All necessary corrections and additions are indicated with a clear red sign on the screen. The validation process also includes the scrutiny of data reported for putatively uninfected patients to permit detection of unreported but true HAI. To accomplish this, should the ISOS suspect an HAI when the IPP uploads a culture to the ISOS but does not confirm an HAI (based on the uploaded culture, the date that the culture was taken, and the result of the culture), the ISOS automatic validation system sends an online message to the IPP requesting a check of the CDC-NHSN criteria for that putative HAI. Also, the ISOS sends a Excel (.xls) file (Microsoft, Redmond, WA) to the IPP every month with a list of biases regarding HAIs that have not been confirmed. Reference Rosenthal21
Study definitions
Ventilator was defined as any device used to support, assist, or control respiration through the application of positive pressure to the airway when delivered via an artificial airway, specifically an oral or nasal endotracheal or tracheostomy tube. Definitions of VAP used during surveillance were those published by the CDC in 199123 and included all subsequent updates through 2022. 24 VAP was defined as pneumonia in which the patient had been on MV for >2 consecutive calendar days on the date of the event, with the day of ventilator placement being day 1, and the ventilator had been in place on the date of the event or the day before. 24
Clinical pneumonia was defined as 2 or more serial chest-imaging results with at least 1 of the following: new and persistent or progressive and persistent, infiltrate, consolidation, cavitation, pneumatoceles (in infants aged ≤1 year). In addition, for any patient, at least 1 of the following must be present: fever, leukopenia or leukocytosis, or altered mental status with no other recognized cause (only in adults aged ≥70 years). Also, at least 2 of the following must be present: new onset of purulent sputum or change in character of sputum, increased respiratory secretions, or increased suctioning requirements; new-onset or worsening cough, dyspnea, or tachypnea; rales or bronchial breath sounds; worsening gas exchange; increased oxygen requirements; and/or increased ventilator demand. 24
Pneumonia with common bacterial or filamentous fungal pathogens and specific laboratory findings was defined as 2 or more serial chest imaging test results with at least 1 of the following: new and persistent or progressive and persistent infiltrate; consolidation; cavitation; pneumatoceles (in infants aged ≤1 year). Also, at least 1 of the following must be present: fever, leukopenia or leukocytosis, or altered mental status with no other recognized cause (only in adults aged ≥70 years). In addition, for any patient, at least 1 of the following must be present: new onset of purulent sputum, change in character of sputum, or increased respiratory secretions, or increased suctioning requirements; new onset or worsening cough, dyspnea, or tachypnea; rales or bronchial breath sounds; worsening gas exchange; increased oxygen requirements; or increased ventilator demand. In addition, at least 1 of the following must be present: organism identified from blood; organism identified from pleural fluid; positive quantitative culture or corresponding semiquantitative culture result from minimally contaminated LRT specimen; ≥5% BAL-obtained cells contain intracellular bacteria on direct microscopic exam; positive quantitative culture or corresponding semiquantitative culture result of lung tissue; or histopathologic exam showing evidence of pneumonia. 24
World Bank country classifications were defined in 4 income groups: low income, lower–middle income, upper–middle income, and high income. These classifications are based on gross national income (GNI) per capita expressed in current US dollars (USD). Low-income countries are those countries with a GNI <1,045 USD. Lower–middle income countries are those with a GNI between 1,046 and 4,095 USD. Upper–middle-income countries are those with a GNI between 4,096 and 12,695 USD. High-income countries are those with a GNI >12,695 USD. 25
Device utilization was calculated as the ratio of device days to patient days for each location type. As such, the device utilization of a location measures the use of invasive devices and constitutes an extrinsic RF for HAI. Device utilization may also serve as a marker for the severity of illness of patients (ie, severely ill patients are more likely to require an invasive device), which is an intrinsic RF for infection. Reference Dudeck, Edwards and Allen-Bridson26
Facility and institution ownership type were defined as follows: publicly owned facilities owned or controlled by a governmental unit or another public corporation (where control is defined as the ability to determine the general corporate policy); not-for-profit privately owned facilities that are legal or social entities created for the purpose of producing goods and services, whose status does not permit them to be a source of income, profit or other financial gains for the unit(s) that establish, control or finance them; and, for-profit privately owned facilities that are legal entities set up for the purpose of producing goods and services and are capable of generating a profit or other financial gains for their owners. 27
Statistical analysis
Patients with and without VAP were compared using multiple logistic regression. Statistically significant variables were independently associated with an increased risk for VAP. The test statistic used was the Wald test, and the statistical significance level was set at 0.05. Calculated from the outputs of multiple logistic regression, adjusted odds ratios (aORs) and the corresponding 95% confidence intervals (CIs) of statistically significant variables were also reported.
We estimated variables independently associated with the outcome (VAP), adjusted to the following prospectively collected data: (1) sex (female or male), (2) age, (3) MV days before acquisition of VAP, (4) MV utilization ratio as a marker of severity of illness of patient, (5) type of respiratory support (continuous positive airway pressure [CPAP], endotracheal tube connected to a mechanical ventilator, tracheostomy connected to a mechanical ventilator, tracheostomy without connection to a mechanical ventilator, (6) hospitalization type (medical or surgical), (7) LOS, (8) ICU type (medical-surgical, medical, pediatric, surgical, coronary, neurosurgical, cardiothoracic, neurologic, trauma, pediatric oncology, or adult oncology), (9) facility ownership (publicly owned facility, not-for-profit privately owned facility, for-profit privately owned facility, or university hospital), 27 and (10) income per country according to the World Bank classification (ie, low, lower-middle, upper-middle, or high). 25
The evaluated outcome was the acquisition of VAP according to the CDC-NHSN definitions. All statistical analyses were performed using R version 4.1.3 software (R Foundation for Statistical Computing, Vienna, Austria).
To estimate VAP rates per country and per continent, we used the full database. To estimate risk factors for VAP, we included only those patients with data available for sex, age, and MV utilization ratio.
Results
A cohort, prospective, multicenter, surveillance study of VAP was conducted in 743 ICUs of 282 hospitals in 144 cities in 42 countries from Asia, Africa, Europe, Latin America, and Middle East currently participating in the INICC: Argentina, Bahrain, Brazil, Bulgaria, China, Colombia, Costa Rica, Cuba, Dominican Republic, Ecuador, Egypt, El Salvador, Greece, India, Jordan, Kingdom of Saudi Arabia, Kosovo, Kuwait, Lebanon, Malaysia, Mexico, Mongolia, Morocco, Nepal, Pakistan, Palestine, Panama, Papua New Guinea, Peru, Philippines, Poland, Romania, Russia, Slovakia, Serbia, Sri Lanka, Sudan, Thailand, Tunisia, Turkey, United Arab Emirates, and Vietnam.
In this is a cohort study, the length of participation by hospitals ranged from 1.17 to 226.07 months (mean, 38.47; SD 42.62). Between July 1, 1998, and February 12, 2022, over 24 years, 289,643 patients admitted to 743 ICUs were followed for 1,951,405 patient days, and these patients acquired 8,236 VAPs.
Table 1 shows data on facility ownership, ICU type, and other participating hospital and patient characteristics. Rates of VAP stratified per country and per region are shown in Table 2 and Figure 1. VAP rates stratified per ICU type and per type of respiratory support are shown in Table 3. VAP rates stratified per World Bank country classification by income level (lower–middle income, upper–middle income, and high income) and by facility ownership type (publicly owned facilities, for-profit privately owned facilities, Teaching hospitals, and not-for-profit privately owned facilities) are shown in Table 3.
Table 1. Setting and Patient Characteristics, July 1, 1998, to February 12, 2022

Note. ICU, intensive care unit; MV, mechanical ventilator; LOS, length of stay; VAP, ventilator-associated pneumonia; SD, standard deviation; CPAP, continuous positive airway pressure.
Table 2. Ventilator-Associated Pneumonia Rates Stratified per Country and per Region
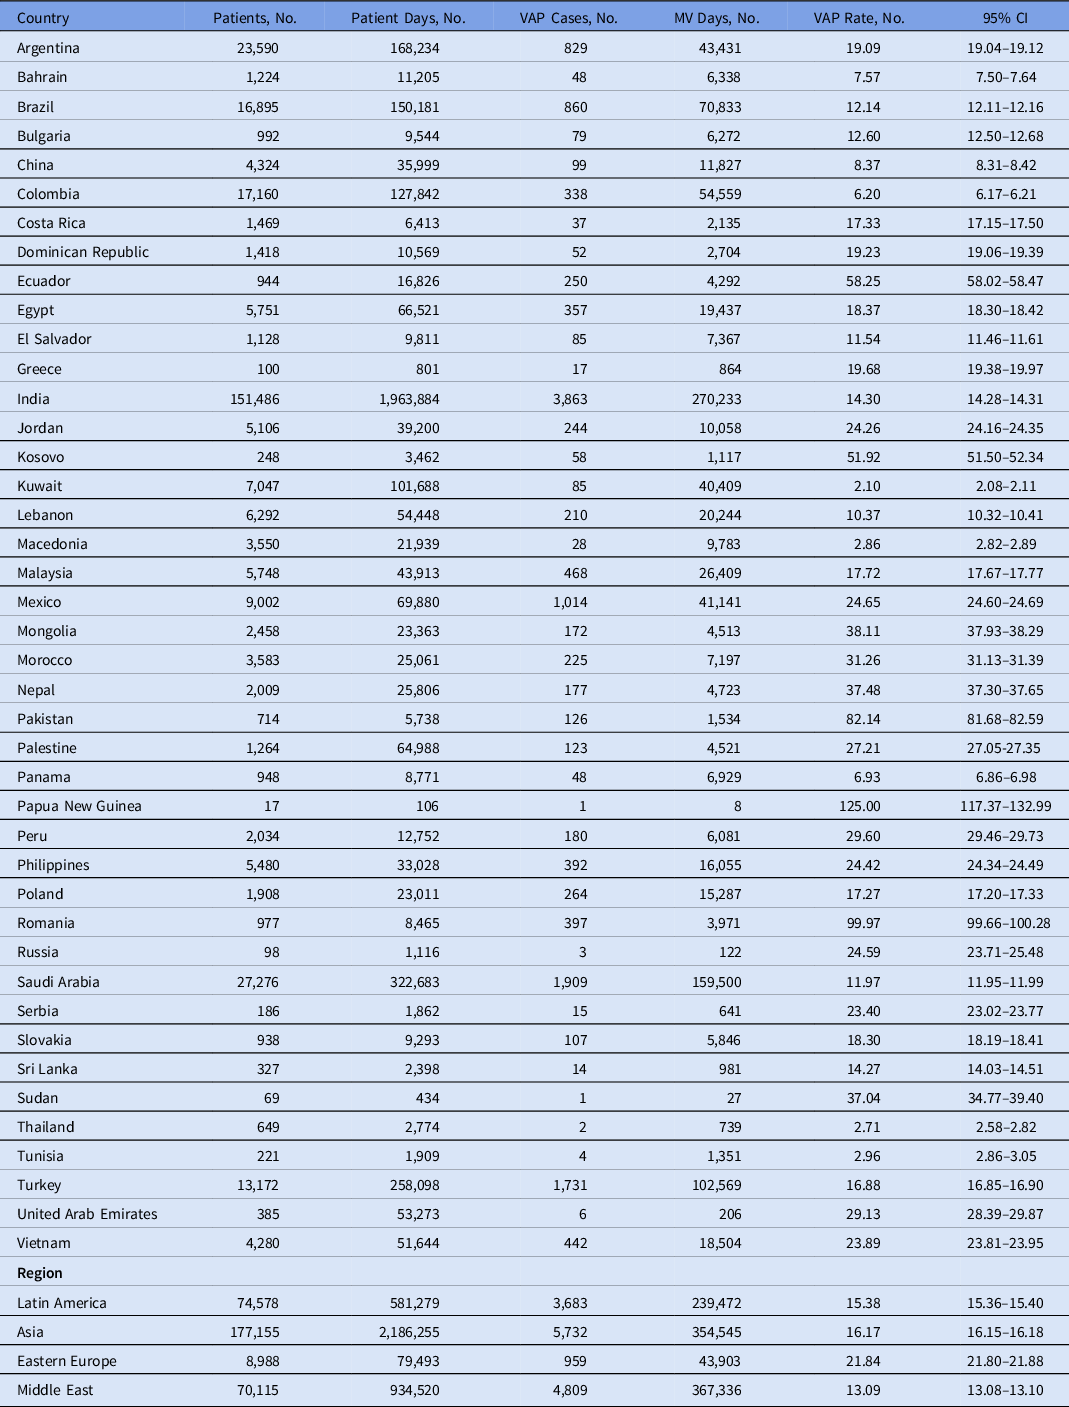
Note. MV, mechanical ventilator; VAP, ventilator-associated pneumonia; CI, confidence interval.

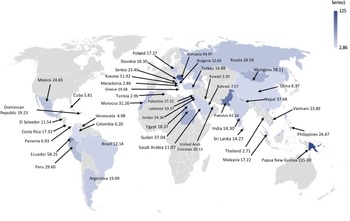
Fig. 1. Rate of ventilator-associated pneumonia per 1,000 mechanical ventilator day, stratified per country.
Table 3. Ventilator-Associated Pneumonia Rates Stratified per ICU Type, per Type of Respiratory Support, per World Bank Country Classifications by Income Level, and per Facility Ownership Type

Note. ICU, intensive care unit; CI, confidence interval; MV, mechanical ventilator; VAP, ventilator-associated pneumonia; CPAP, continuous positive airway pressure.
aICUs are listed in order of the highest to lowest ventilator-associated pneumonia rate.
Using multiple logistic regression, the following 6 variables were identified as statistically significantly independently associated with VAP: male sex; longer LOS, which increased the risk by 7% per day; MV utilization ratio; CPAP, which was associated with the highest risk; tracheostomy connected to a MV and endotracheal tube connected to a MV, which had the next-highest risk; surgical hospitalization instead of medical; public hospital; middle-income country; adult oncology ICU, which was associated with the highest risk; neurologic ICU and respiratory ICU, which had the next-highest risk. (Table 4). Coronary ICU showed the lowest risk.
Table 4. Multiple Logistic Regression Analysis of Risk Factors for Ventilator-Associated Pneumonia

Note. ICU, intensive care unit; MV, mechanical ventilation; LOS, length of stay; VAP, ventilator-associated pneumonia; CPAP, continuous positive airway pressure; aOR, adjusted odds ratio; CI, confidence interval.
Discussion
The VAP rates in the present study per country and per continent are significantly higher than those of the CDC-NHSN. Reference Rosenthal, Duszynska and Bat-Erdene8 This finding has been reported by the INICC since 20061 and beyond. Reference Rosenthal, Maki and Mehta2–Reference Rosenthal, Duszynska and Bat-Erdene8
In the present study, we identified an association between male sex and VAP. In 1997, Kollef et al Reference Kollef, Von Harz and Prentice28 conducted a prospective cohort study in ICUs of Barnes-Jewish Hospital; they analyzed 521 ICU patients requiring MV for >12 hours. With multiple logistic regression analysis, they demonstrated that male sex was independently associated with the development of VAP. Reference Kollef, Von Harz and Prentice28
We further identified an association between the MV utilization ratio and VAP. In 2000, Sofianou et al Reference Sofianou, Constandinidis, Yannacou, Anastasiou and Sofianos14 conducted a prospective study to determine risk factors for VAP in 198 patients requiring MV for >48 hours. They found that MV for >10 days was a risk factor for VAP (OR, 44.4; 95% CI, 2.16–26.7; P < .0001). Reference Sofianou, Constandinidis, Yannacou, Anastasiou and Sofianos14
In our study, CPAP was associated with risk of acquiring pneumonia. Strategies to prevent VAP published by the Society for Healthcare Epidemiology of America (SHEA)–Association for Professionals in Infection Control and Epidemiology (APIC)–Infectious Diseases Society of America (IDSA) include the recommendation of using high-flow nasal oxygen or noninvasive positive pressure ventilation based on high quality of evidence, but there is no recommendation to use CPAP. Reference Klompas, Branson and Cawcutt29 A nationwide study conducted in Taiwan analyzed the impact of CPAP as a pneumonia RF. During 10 years, they identified adult patients with sleep apnea from the Taiwan National Health Insurance Research Database. A control cohort without sleep apnea, matched for age, sex and comorbidities, was selected for comparison. Of the 34,100 patients (6,816 study patients and 27,284 matched controls), 2,757 (8.09%) had pneumonia during a mean follow-up period of 4.50 years, including 638 (9.36%) study patients and 2,119 (7.77%) controls. Kaplan–Meier analysis showed a higher incidence of pneumonia among patients with sleep apnea (log rank test, P < .001). After multivariate adjustment, patients with sleep apnea experienced a 1.20-fold (95% CI, 1.10–1.31) increase in incident pneumonia. The risk was even higher among patients who use CPAP. Reference Su, Liu and Wang30
We did not find a difference in the risk of VAP associated with age. However, Jovanovic et al Reference Beardsley31 conducted a prospective study to identify VAP RF, and age was independently associated with late-onset VAP. Furthermore, the Jovanovic study reported an association between surgical hospitalization and VAP compared with medical hospitalization. In our study, the ICUs with the highest risk for VAP were adult oncology ICU, respiratory ICU, and neurology ICU. The coronary ICU showed the lowest risk of VAP. The MV utilization ratio, as a marker of severity of illness of patients, is the highest in these types of ICUs, 32 which could explain why these ICUs are associated with the highest risk of VAP.
Moreover, we detected an association between the acquisition of VAP rates in public hospitals compared with Teaching hospitals. However, a study Reference Rosenthal, Lynch and Jarvis33 conducted in neonatal ICUs found that the VAP rate per 1,000 MV days at Teaching hospitals was 13.2 (95% CI, 11.5–15.0). At public hospitals, this rate was 4.9 (95% CI, 2.5–8.6), and at private hospitals, this rate was 2.4 (95% CI, 1.3–3.9). Compared with public hospitals, Teaching hospitals showed a higher risk for VAP (relative risk [RR], 2.69; 95% CI, 1.50–4.80; P = .0001). Reference Rosenthal, Lynch and Jarvis33 In a study Reference Rosenthal, Jarvis and Jamulitrat34 conducted in pediatric ICUs, the VAP rate per 1,000 MV days at Teaching hospitals was 8.3 (95% CI, 7.3–9.3). At public hospitals this rate was 4.7 (95% CI, 3.9–5.7), and at private hospitals this rate was 3.5 (95% CI, 2.6–4.5). Reference Rosenthal, Jarvis and Jamulitrat34 Compared with private or public hospitals, Teaching hospitals showed a highest risk for VAP. Reference Rosenthal, Jarvis and Jamulitrat34
In our study, patients admitted to ICUs in upper–middle-income countries were at higher risk for VAP than those admitted to ICUs in high-income countries. This finding could be explained by the lower quality of healthcare programs in middle-income countries participating in this study. A previous study Reference Rosenthal, Lynch and Jarvis33 conducted in NICUs reported a VAP rate per 1,000 MV days at lower–middle-income countries of 11.8 (95% CI, 10.1–13.6). In upper–middle-income countries, this rate was 6.7 (95% CI, 5.2–8.5). Compared with upper–middle-income countries, lower–middle-income countries showed a higher risk for VAP (RR, 1.75; 95% CI, 1.32–2.32; P = .0001). Reference Rosenthal, Lynch and Jarvis33 Another study Reference Rosenthal, Jarvis and Jamulitrat34 conducted in PICUs reported a VAP rate per 1,000 MV-days in lower–middle-income countries of 9.0 (95% CI, 7.5–10.6). In upper–middle-income countries, this rate was 5.4 (95% CI, 4.8–6.1). Compared with upper–middle-income countries, lower–middle-income countries showed a higher risk for VAP. Reference Rosenthal, Jarvis and Jamulitrat34
According with the most recent and also previous INICC reports Reference Rosenthal, Maki and Salomao1–Reference Rosenthal, Duszynska and Bat-Erdene8 published from 2006 to 2021, VAP is the most prevalent HAI in LMICs, and VAP is associated with high mortality, extra LOS, costs, and high bacterial resistance. Reference Rosenthal, Maki and Salomao1–Reference Rosenthal, Duszynska and Bat-Erdene8 To save countless lives in LMICs, it is essential to act quickly to control and prevent VAP. Reference Rosenthal, Yin and Lu10 To do so, we suggest first focusing on identifying an evidence-based set of VAP prevention recommendations, such as those of SHEA–APIC–IDSA. Reference Klompas, Branson and Cawcutt29 Given that these organizations have already identified a number of evidence-based strategies to prevent the acquisition of VAP, it is crucial to be aware of this set of recommendations. Reference Klompas, Branson and Cawcutt29 Second, it is also recommended to monitor healthcare worker compliance with this set of recommendations and to provide them with performance feedback. This strategy has been effective in reducing the very high rate of VAP in LMICs. Reference Leblebicioglu, Yalcin and Rosenthal35–Reference Rosenthal, Desse and Maurizi42 Last but not least, we suggest focusing on risk factors that can be changed to prevent VAPs. Some VAP risk factors are unlikely to change, such as sex, medical or surgical hospitalization, ICU type, facility ownership, and the country’s economy. Based on the our findings, addressing the following risk factors has the highest chance to reduce VAP: reducing LOS, limiting the duration of mechanical ventilation, limiting the use of CPAP. In addition, we suggest following a set of evidence-based recommendations to prevent VAP such as those published by the SHEA–APIC–IDSA. Reference Klompas, Branson and Cawcutt29
This study had several strengths. We use a prospective cohort study design. We collected data prospectively using standardized forms with a checklist for diagnosis of VAP, an online platform with dropdown menus to select the options of type of devices used, criteria for VAP, and diagnosis of VAP, to avoid typos in collected data. We used an electronic system to avoid bias in data collection among denominators and VAPs. IPPs who collected the data were trained individually by our principal investigator. This study was conducted across 24 years in 42 countries. All hospitals worldwide are invited to join this surveillance and research network and to collect data on HAIs using the INICC online platform (ie, participation is free).
Our research also had several limitations. First, this study is not representative of all hospitals in the 42 participant countries because hospitals voluntarily join the INICC and use this surveillance system for free. Second, the hospitals that participate in our surveillance system likely have better-quality HAI surveillance and prevention programs. Thus, the HAI rates in our study may be lower than the HAI rates in other hospitals not participating in our research. Finally, participating hospitals have not collected data on disease severity scores and underlying diseases, but we collected mechanical ventilation utilization ratio as a marker of severity of illness of patients, and we adjusted the analysis to this independent variable.
Acknowledgments
The authors thank the many healthcare professionals who assisted in conducting surveillance in their hospitals, the INICC advisory board, country directors, and secretaries who have so generously supported this unique international infection control network.
Author contributions
Dr. Rosenthal was responsible for study conception and design, software development, technical support, drafting tutorials for surveillance process, training of data collectors, provision of study patients, data validation, data assembly, data interpretation, epidemiological analysis, drafting of the manuscript. Zhilin Jin and Ruijie Yin contributed equally to building machine-learning models and conducting statistical analyses, critical revision for important intellectual content, and final approval of the manuscript. The remaining authors were involved in the providing patient data. All authors were involved in critical revision of the manuscript for important intellectual content and final approval of the manuscript.
Financial support
No financial support was provided relevant to this article.
Conflicts of interest
All authors report no conflicts of interest relevant to this article.


 Open access