


Preface
The following set of articles describe in detail the science goals of the future Space Infrared telescope for Cosmology and Astrophysics (SPICA). The SPICA satellite will employ a 2.5-m telescope, actively cooled to below 8 K, and a suite of mid- to far-IR spectrometers and photometric cameras, equipped with state of the art detectors. In particular, the SPICA Far Infrared Instrument (SAFARI) will be a grating spectrograph with low (R = 300) and medium (R ~ 3000–11000) resolution observing modes instantaneously covering the 35–230 μm wavelength range. The SPICA Mid-Infrared Instrument (SMI) will have three operating modes: a large field of view (12 arcmin × 10 arcmin) low-resolution 17– 36 μm spectroscopic (R ~ 50–120) and photometric camera at 34 μm, a medium resolution (R ~ 2000) grating spectrometer covering wavelengths of 18–36 μm and a high-resolution echelle module (R ~ 28000) for the 12–18 μm domain. A large field of view (80 arcsec × 80 arcsec), three channel (110, 220, and 350 μm) polarimetric camera (POL) will also be part of the instrument complement. These articles will focus on some of the major scientific questions that the SPICA mission aims to address; more details about the mission and instruments can be found in Roelfsema et al. (Reference Roelfsema2018).
1 INTRODUCTION
The cycling of matter between stars and gas is one of the drivers of galaxy evolution, along with black hole accretion and interaction with the surroundings (Davé, Finlator, & Oppenheimer Reference Davé, Finlator and Oppenheimer2012). It is becoming established that the initial conditions for star formation in galaxies include large-scale webs of filamentary structures that eventually form the smaller scale seeds that give birth to individual stars in molecular clouds (Putman, Peek, & Joung Reference Putman, Peek and Joung2012). How these processes on local galaxy scales link to a web of interstellar matter taking shape as different phases on larger scales in galaxies has yet to become clear (André et al. Reference André, Beuther, Klessen, Dullemond and Henning2014). Linking the total star-formation rate (SFR) to the processes governing it in nearby galaxies is a key topic for the next decade; such detailed studies will provide a reference sample to calibrate and inform the observations of star formation across cosmic time in the coming datasets with massive samples of galaxies at all epochs.
One key finding from observations in the last ~10 yrs is that the rate at which stars form varies widely between galaxies (Kennicutt & Evans Reference Kennicutt and Evans2012). While it is natural to expect that the SFRs of galaxies scale roughly with their stellar masses, from dwarf galaxies to normal galaxies, it is more surprising and interesting that the specific SFRs (i.e., SFRs per unit stellar mass) increase substantially from normal galaxies to starburst systems (Kennicutt & Evans Reference Kennicutt and Evans2012; Boquien et al. Reference Boquien2015). Many factors may contribute to this variation, especially morphology/galaxy type and environmental effects such as mergers and the inflow of material from the surrounding intergalactic medium. Metallicity may also play a role, as observations show that dwarf galaxies have higher sSFRs than spirals in the local Universe (Brinchmann et al. Reference Brinchmann2004) and simulations show various metallicity effects on the gas/dust and H/H2 ratios (Gnedin & Kravtsov Reference Gnedin and Kravtsov2010; Krumholz & Dekel Reference Krumholz and Dekel2012). Disentangling these effects requires sensitive observations of SFRs and gas masses for a large variety of galaxies.
The interstellar media of galaxies consist of several phases of matter (ionised, neutral atomic, and molecular gas, and dust) which are actively interacting with each other and with the surrounding intergalactic medium. The molecular phase hosts the bulk of the star formation, but its total mass is not well constrained since the common tracer of H2, CO, is subject to large uncertainties (Wilson Reference Wilson1995; Bolatto, Wolfire, & Leroy Reference Bolatto, Wolfire and Leroy2013, and references therein). In addition, observations of [C ii] 158 μm line emission (Madden et al. Reference Madden, Poglitsch, Geis, Stacey and Townes1997; Planck Collaboration 2011; Pineda et al. Reference Pineda, Langer, Velusamy and Goldsmith2013) and gamma rays (Grenier, Casandjian, & Terrier Reference Grenier, Casandjian and Terrier2005) indicate that a large fraction of H2 is completely invisible in CO, a fraction which increases with Galactocentric radius (Langer et al. Reference Langer, Velusamy, Pineda, Willacy and Goldsmith2014). Dust measurements also indicate substantial masses of ‘CO-dark gas’ in low metallicity environments (Leroy et al. Reference Leroy2011), although with caveats related to our knowledge of the dust properties (Roman-Duval et al. Reference Roman-Duval2014). Unraveling the interdependence of the SFR, the properties of the multiphase gas and dust reservoirs, morphology/galaxy type and local conditions (radiation field, gas density, dynamical, and chemical processes. . .) is crucial to our understanding of how galaxies nurture star formation and evolve over cosmic time.
A key ingredient of galaxies is their dust content, which may vary by orders of magnitude. The Spitzer and Herschel missions, together with AKARI and WISE, have provided spectral coverage of the dust emission of numerous nearby galaxies, out to the submillimetre regime (e.g., Smith et al. Reference Smith2007; Auld et al. Reference Auld2012; Dale et al. Reference Dale2012; Ciesla et al. Reference Ciesla2014; Rémy-Ruyer et al. Reference Rémy-Ruyer2015). These data have led to major revisions of the dust models for the Large Magellanic Cloud (Galliano et al. Reference Galliano2011; Gordon et al. Reference Gordon2014; Chastenet et al. Reference Chastenet2017) and the Galaxy (Ysard et al. Reference Ysard2015; Planck Collaboration 2016). However, our knowledge of the grain properties is still very limited and therefore the inferred dust masses for nearby and more distant galaxies are crude and potentially biased and inaccurate if Galactic dust model assumptions are made. We still lack direct constraints on the dust composition in galaxies, because these properties have been estimated with a small number of broadband filters. The next level of understanding interstellar dust is to constrain the mineralogy of the bulk of the dust mass, dominating its emission spectrum. While ISO opened the field of astromineralogy (e.g., Waters et al. Reference Waters1996), Herschel showed how the dust content of galaxies changes with metallicity (Rémy-Ruyer et al. Reference Rémy-Ruyer2014; Zhukovska Reference Zhukovska2014). Herschel, however, was sensitivity limited when it came to the low surface brightness galaxies as well as diffuse regions within galaxies. These include the low metallicity outer regions of (spiral) galaxies and the very low metallicity dwarf galaxies. To date, only a handful of galaxies have been spectroscopically studied in the very low surface brightness regime where the evolution of the metals with respect to the gas and dust is highly non-linear (Draine et al. Reference Draine2007; Galliano, Dwek, & Chanial Reference Galliano, Dwek and Chanial2008; Galametz et al. Reference Galametz2011). The very low mass, low metallicity galaxies seem to have much less dust than expected from their metallicity, which is a regime that offers us a window into the conditions in the early Universe (Herrera-Camus et al. Reference Herrera-Camus2012; Rémy-Ruyer et al. Reference Rémy-Ruyer2014).
In summary, despite recent advances in interpreting the observations we have to date, several key questions remain open, in particular, (i) what local and global processes determine the SFRs of galaxies?, (ii) what are the main interstellar matter reservoirs of galaxies and how do they interact?, (iii) how does the dust content of galaxies depend on the ISM phases within galaxies, the metallicity, SFR and history, and other galactic properties?
Mid- and far-infrared (IR) spectroscopy at high sensitivity is essential to take these issues a decisive step forward. Such spectra allow us to jointly characterise all phases of interstellar matter (ionised, neutral and molecular gas, and dust) more robustly than can be done in any other wavelength regime, because of the many available lines and dust spectral features. The high linear resolution and mass sensitivity achievable in nearby galaxies (including the Milky Way) allow us to probe specific mechanisms and interpret the integrated measurements that are obtained in galaxies at higher redshift, which puts them in a more accurate physical context.
In 2016 October, SPICA Footnote 1 has been proposed to ESA by a European–Japanese–American consortium as the fifth medium-sized (M5) mission of the Cosmic Vision programme. The basic concept of SPICA is a large space telescope with an actively cooled mirror to achieve extreme sensitivity in the mid- to far-IR wavelength ranges. Three instruments are foreseen: SMI, SAFARI, and a polarimetric imager (POL). The design of the SPICA telescope and its instruments was initially described in Swinyard et al. (Reference Swinyard2009), and updated by Nakagawa et al. (Reference Nakagawa, Oschmann, Clampin, Fazio and MacEwen2014) and Sibthorpe et al. (Reference Sibthorpe, Helmich, Roelfsema, Kaneda, Shibai, Simon, Schaaf and Stutzki2015). The detailed design and capabilities of SPICA are described by Roelfsema et al. (Reference Roelfsema2018); here we just summarise its main features.
With a 2.5-m telescope cooled to <8 K, SPICA is expected to reach 5σ noise levels of ~5 × 10⁻²⁰ W m−2 in terms of line sensitivity in 1 h of integration. This sensitivity is comparable to that of the James Webb Space Telescope (JWST) and the Atacama Large Millimeter/submillimeter Array (ALMA), as shown in Roelfsema et al. (Reference Roelfsema2018). At 34 μm, SPICA′s diffraction-limited angular resolution of 3.4 arcsec corresponds to 170 pc at 10 Mpc. Although the critical mid- to far-IR range between JWST and ALMA was explored before by ISO, Spitzer, and Herschel, the 102–104 times better sensitivity of SPICA enables an entirely new approach to currently outstanding science questions. At any given distance, SPICA will increase the accessible range in luminosities by a factor of ~100. Specifically, this allows low-luminosity dwarf galaxies to be detected well beyond the Local Group, and average-luminosity spiral galaxies beyond the local universe, which has not been the case thus far.
This paper describes the progress that can be made with SPICA in our understanding of the interstellar media of nearby galaxies. Companion papers by Spinoglio et al. (Reference Spinoglio2017), González-Alfonso et al. (Reference González-Alfonso2017), Fernández-Ontiveros et al. (Reference Fernández-Ontiveros2017), Gruppioni et al. (Reference Gruppioni2017), and Kaneda et al. (Reference Kaneda2017) discuss the ability of SPICA to disentangle starburst nuclei from AGN, to study galactic winds and outflows, to probe the chemical evolution of galaxies, to carry out deep wide-field surveys of galaxies, and to probe the dust evolution of galaxies. The science case for the POL instrument is described by André et al. (in preparation), including topics in extragalactic polarimetry. The present paper is organised as follows: Section 2 gives a brief outline of the main diagnostic spectral features in the mid- and far-IR. Section 3 presents how SPICA will help us understand star-formation processes in galaxies. Section 4 discusses the ways in which mid- and far-IR spectral lines may be used to understand the gas content of the ISM of galaxies, while Section 5 discusses the role of SPICA to understand their dust content. Section 6 discusses the main requirements for the telescope and its instruments and outlines a possible observing programme, and Section 7 concludes the paper.
2 THE POWER OF MID- AND FAR-INFRARED SPECTROSCOPY
The mid- to far-IR spectral range hosts a large suite of atomic, molecular, and dust features covering a wide range of excitation, density, and metallicity, directly tracing the physical conditions in the nuclei, disks, and halos of galaxies (Figure 1). Table 1 lists the key diagnostic features, arranged by the main ISM phase that they trace, although some features (such as [C ii] 158 μm) trace more than one phase. For further information on these features, such as ionisation potentials and critical densities, see the cloudy databaseFootnote 2 for atomic lines, and the lamda database (Schöier et al. Reference Schöier, van der Tak, van Dishoeck and Black2005)Footnote 3 for molecular lines. Fine structure lines from low-ionisation species (e.g., Ne+, S++, O++) probe H ii regions around hot young stars, providing a measure of the ionising photon flux (i.e., stellar type), and the density of the gas (Abel et al. Reference Abel, Ferland, Shaw and van Hoof2005). Lines from highly ionised species (e.g., O3 +, Ne4 +) trace the presence of energetic photons emitted from AGN, providing a measure of the accretion rate (Spinoglio & Malkan Reference Spinoglio and Malkan1992). Photo-dissociation regions (PDRs), the interaction zones between young stars and their parent molecular clouds, can be studied via the strong [C ii], [O i], and [Si ii] lines and the emission from small dust grains and PAHs (Kaufman et al. Reference Kaufman, Wolfire, Hollenbach and Luhman1999). The major coolants of the diffuse warm gas (e.g., [N ii] 122, 205 μm) in galaxies are also in the far-IR, giving us a complete picture of the warm ISM.
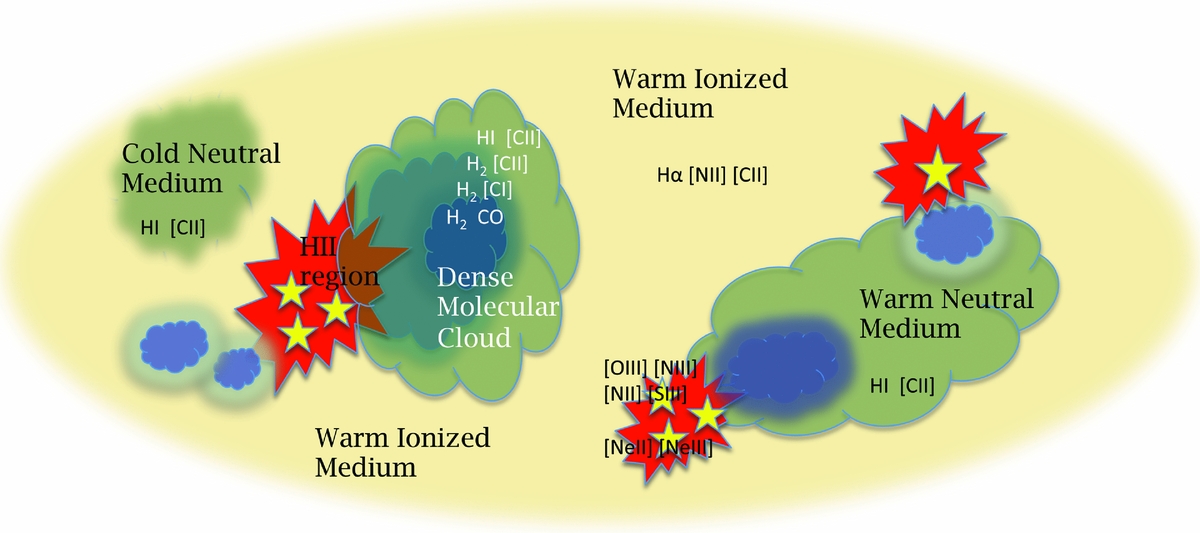
Figure 1. Schematic picture of the origin of fine structure and molecular line emission in the mid- and far-infrared ranges from the various ISM components of galaxies.
Table 1. Key diagnostic features in the mid- and far-infrared ranges.
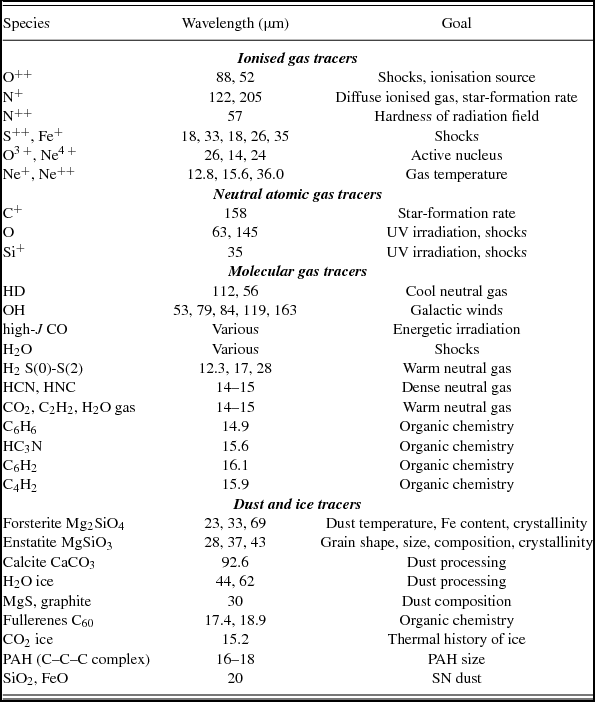
The rest-frame mid- and far-IR is also home to pure rotational H2, HD, and OH lines (including their ground state lines), mid- to high-J CO lines, and many H2O lines, including the ortho-H2O ground state line at 179 μm. The same wavelength range hosts numerous unique dust features from minerals such as silicates and carbonates that probe evolution from pristine to processed dust (e.g., by aqueous alteration), as well as CO2 and water ice, and molecules like acetylene (C2H2) and fullerenes, up to polycyclic aromatic hydrocarbons (PAHs).
The combination of lines in the mid- and far-IR spectra of galaxies is especially powerful as a diagnostic of physical conditions and processes in their interstellar gas. In particular, [C ii] 158 μm is often advocated as tracer of SFR and/or gas reservoir (De Looze et al. Reference De Looze2014; Herrera-Camus et al. Reference Herrera-Camus2015), except in extreme cases such as AGN and (U)LIRGs due to the ‘far-IR line deficit’ (Graciá-Carpio et al. Reference Graciá-Carpio2011; Díaz-Santos et al. Reference Díaz-Santos2013). In normal star-forming galaxies, both ionised and neutral gas contribute to the [C ii] 158 μm emission. To disentangle the two, the ratio of the [N ii] 122 and 205 μm lines may be used to estimate the density of ionised gas, so that the absolute [N ii] 205 μm line intensity gives an estimate of the fraction of C ii emission arising from ionised gas (Oberst et al. Reference Oberst2011; Hughes et al. Reference Hughes2014). Alternatively, the ionised gas density may be estimated from the ratio of the [O iii] 52 and 88 μm, and the [S iii] 18 and 33 μm lines (Rubin et al. Reference Rubin1994). To trace very high densities, the [Ne iii] 15.6 and 36 μm lines may be used. With the gas density in hand, line ratios from adjacent ionisation stages, especially [N ii]/[N iii], probe the hardness of the ambient UV radiation field (Rubin Reference Rubin1985). The ratio of the [N iii] 57 μm and [O iii] 52 μm lines is a good measure of the N/O abundance ratio, which is an indicator of the degree of stellar processing of the ISM through gas-phase metallicity (Rubin et al. Reference Rubin, Simpson, Erickson and Haas1988; Nagao et al. Reference Nagao, Maiolino, Marconi and Matsuhara2011; Pereira-Santaella et al. Reference Pereira-Santaella, Rigopoulou, Farrah, Lebouteiller and Li2017). The [N ii] emission at 205 μm has also been advocated as a good tracer of the SFR (Zhao et al. Reference Zhao2013; Wu et al. Reference Wu2015; Hughes et al. Reference Hughes2016; Herrera-Camus et al. Reference Herrera-Camus2016), as well as the combined [Ne ii] + [Ne iii] line emission (Ho & Keto Reference Ho and Keto2007).
Mid- and far-IR spectra are also powerful diagnostics of neutral gas conditions, especially the [C ii] and [O i] lines as major cooling channels. The ratio of [C ii] to [O i] and the ratio of the two [O i] lines both vary with gas density and incident UV flux, but in different ways (Kaufman et al. Reference Kaufman, Wolfire, Hollenbach and Luhman1999), so that SPICA can disentangle the two. At low metallicity, the [Si ii] line is also a major coolant, potentially as bright as [C ii] (Santoro & Shull Reference Santoro and Shull2006), due partly to the higher ISM temperature at low metallicity, and especially due to the low dust/gas mass ratio, with much less silicon locked into dust grains. The HD 1–0 and 2–1 lines at 112 and 56 μm are useful tracers of CO-dark gas, since their intensity ratio is a probe of gas temperature, and their absolute flux measures cool molecular gas mass. Given recent detections in Galactic objects, these lines are expected to be detectable as far out as ~10 Mpc (see Section 4.1). In addition, the H2 S(0) line at 28 μm is a unique probe of warm molecular gas, which can be better detected by SPICA than by JWST, due to its cooled mirror. The ratio of the H2 17 and 28 μm lines is an alternative way to measure the gas temperature (Stacey et al. Reference Stacey2010) for phases too diffuse to emit in CO. In nearby galaxies, the CO ladder is useful to distinguish shocks from radiative heating of the gas (Mashian et al. Reference Mashian2015), especially the high-J lines at wavelengths shorter than ~200 μm.
In summary, high spectral sensitivity in the mid- and far-IR will enable a decisive step forward in characterising ISM conditions in galaxies, by providing accurate estimates of the dust temperature, the gas density, and the ionising UV radiation field (Section 2; Table 1). Analysis tools are available in the form of thermochemical and photoionisation models such as the Kaufman et al. (Reference Kaufman, Wolfire, Hollenbach and Luhman1999) code, the Meudon code (Le Petit et al. Reference Le Petit, Nehmé, Le Bourlot and Roueff2006)Footnote 4 , Kosma-τ (Röllig et al. Reference Röllig2007), and Cloudy (Ferland et al. Reference Ferland2013)Footnote 5 , which are calibrated on Milky Way PDRs. Using such models, multi-line observations can be used to constrain the filling factors of the various ISM phases, as was already demonstrated for bright nearby galaxies (Graciá-Carpio et al. Reference Graciá-Carpio2011; Cormier et al. Reference Cormier2012).
3 STAR FORMATION IN GALAXIES: PROCESSES AND RATES
It has recently become clear that most galaxies evolve through secular processes that involve relatively smooth accretion of metal-poor material (through minor mergers or directly from the cosmic web), star formation, and excretion of metal-enriched gas and dust into the interstellar, circumgalactic, and intergalactic medium. The processes that regulate this cycling of matter are major drivers of galaxy evolution, and the relative importance and efficiencies of different physical processes (large-scale gas infall, outflows, AGN, and stellar feedback, etc.) are not yet well characterised. Galaxies exhibit a wide range of star-formation efficiencies, defined as the fraction of the gas mass that is going into stars. The availability of fresh gas and the self-regulation of star formation within galaxies determine many of their properties (e.g., Leroy et al. Reference Leroy2008; Saintonge et al. Reference Saintonge2011; Alatalo et al. Reference Alatalo2013). In the Milky Way, stars form inside dense cloud condensations, often filamentary, where the local SFR is directly related to the fraction of gravitationally unstable gas (e.g., Heiderman et al. Reference Heiderman, Evans, Allen, Huard and Heyer2010; Lada et al. Reference Lada, Forbrich, Lombardi and Alves2012; André et al. Reference André, Beuther, Klessen, Dullemond and Henning2014). The idea that clouds are fully self-gravitating once they are molecular is based on the observation that the dense gas fraction (probed by the HCN/CO ratio) is remarkably constant in clouds (e.g., Dobbs et al. Reference Dobbs, Beuther, Klessen, Dullemond and Henning2014). This picture may not hold for all galaxies: in M51 for instance, Bigiel et al. (Reference Bigiel2016) find that HCN/CO is an increasing function of the local surface mass density and of the molecular gas fraction, and for Local Group galaxies, Braine et al. (Reference Braine2017) find variations of HCN/CO with metallicity and SFR.
Compression and cooling of the ISM plays a fundamental role in setting the global and local conditions needed for star formation, while feedback provides energy that heats the gas and dust reservoirs. However, the trigger of star formation and onset of gravitational collapse, which may determine the Initial Mass Function (André et al. Reference André, Beuther, Klessen, Dullemond and Henning2014), are not yet well understood. To understand the initial stages of star formation, the process of energy dissipation of turbulent gas and the formation of filamentary structures needs to be studied in detail.
Mid- and far-IR spectroscopy affords a unique opportunity to observe major cooling and other diagnostic lines of the ISM (Figure 1); see e.g., Malhotra et al. (Reference Malhotra2001). With its outstanding sensitivity to spectral lines, SPICA will enable detailed study of thousands of galaxies. High spectral-line sensitivity enables measurements of the key elements that regulate star formation in galaxies: gas temperature, density, and local radiation field conditions, both near the star-formation sites and in galactic fountains and outflows. Mid- and far-IR spectra also probe the dust content of galaxies (Table 1), following its evolution between the atomic and molecular gas phases and its properties in galaxy outflows that may feed the large dust reservoirs observed in the circumgalactic medium (Ménard, Kilbinger, & Scranton Reference Ménard, Kilbinger and Scranton2010; Peek, Ménard, & Corrales Reference Peek, Ménard and Corrales2015).
Mid- to far-IR spectroscopy over a wide wavelength range is also a great probe of Galactic ISM physics, in particular to disentangle the relative importance of radiative heating (i.e., PDRs) versus shocks. In the classic picture, the [O i]/[C ii] ratio is >10 if shocks dominate, and <10 if PDRs dominate (Hollenbach & McKee Reference Hollenbach and McKee1989). However, in observing galaxies as a whole, PDRs may be dominating, while when resolving galaxies, shock-heated lines may dominate the diffuse part (Lee et al. Reference Lee2016). Access to a variety of fine structure and molecular lines at a range of IR wavelengths is essential to disentangle these contributions.
3.1. The star-formation rates of galaxies
Bright far-IR fine-structure lines can be used as SFR measures at high redshift, once they are locally calibrated. Although local observations exist (e.g., De Looze et al. Reference De Looze2014; Herrera-Camus et al. Reference Herrera-Camus2015), the exploration of parameter space and particularly the influence of galaxy properties (e.g., metallicity, presence of AGN, dust properties) is far from understood. A particularly prominent example is [C ii], which has potential as a star formation indicator and as a probe of conditions for early stages of galaxy evolution with mm-wave instruments such as ALMA. Herschel has clarified what drives the gas cooling, especially the [C ii] emission from PDRs, in normal galaxies (Smith et al. Reference Smith2017) and starbursts (Díaz-Santos et al. Reference Díaz-Santos2013), but these studies were restricted to bright regions in normal galaxies, or luminosity-weighted averages of ~kpc scales in starbursts. The much higher brightness sensitivity of SPICA will allow us to probe significantly fainter regions in the ISM of resolved galaxies, both normal and starbursting. The typical [C ii] limit for galaxy surveys with Herschel was a few 1038 erg s−1 kpc−2 (~10−8 W m−2) which is ~100 × higher than a short SPICA integration. SPICA will detect low-density gas in [C ii], providing a measurement of the [C ii] fraction from diffuse gas, potentially very high according to Heiles (Reference Heiles1994), which has not been done before. Furthermore, SPICA will detect distant objects with normal properties, not just LIRGs which often have a mixture of emission and absorption in [C ii]. SPICA will also detect outer disk material, also impossible up to now, which will help characterise the radial variation in ISM properties.
Fine-structure line tracers of SFR can also be used to investigate the correlation between SFR and metallicity. Using the far-IR to estimate both SFR and metallicity eliminates biases due to dust extinction. Such studies have application at high redshift, where submillimetre-wave telescopes like ALMA can access red-shifted far-IR transitions (Swinbank et al. Reference Swinbank2012; De Breuck et al. Reference De Breuck2014; Riechers et al. Reference Riechers2014; Aravena et al. Reference Aravena2016). Finally, accurate SPICA measurements of SFRs will be an excellent complement to the stellar mass estimates provided for massive samples of galaxies with the coming near-IR capabilities of JWST, Euclid, and WFIRST, substantially improving the measurements of the ‘star formation main sequence’ (Elbaz et al. Reference Elbaz2011).
Besides lines from H ii regions such as [Ne ii] 12.8 μm and [N ii] 122 μm, SPICA can provide accurate measurements for the SFR in nearby galaxies based on the shape of the SED in the mid- to far-IR range. Such estimates are usually based either on monochromatic fluxes (e.g., Calzetti et al. Reference Calzetti2000) or on total IR luminosities (L IR) derived from fitting of SED templates. The SFRs associated with the L IR obtained from these libraries are provided by standard calibrations (e.g., Kennicutt & Evans Reference Kennicutt and Evans2012), which rely either on observations of nearby galaxies (e.g., Chary & Elbaz Reference Chary and Elbaz2001; Dale & Helou Reference Dale and Helou2002) or on modelling of the dust emission (e.g., Draine & Li Reference Draine and Li2007). Although Spitzer and Herschel allowed to build new templates and test them at high redshift (e.g., Elbaz et al. Reference Elbaz2011; Magnelli et al. Reference Magnelli2011, Reference Magnelli2014; Magdis et al. Reference Magdis2012), these libraries are still very generic, based on limited SED sampling, and show a large dispersion (see Figure 2). Of particular interest is the 24–60 μm range, where predictions by current templates differ by factors up to 10. However, it is still unclear whether the large scatter in the 24–60 μm range can be ascribed only to uncertainties in the way templates are built, or if it is due to intrinsic variations in the physical properties of galaxies. This range is particularly sensitive to the relative contribution of PDRs and the diffuse interstellar component to the dust heating (Draine & Li Reference Draine and Li2007; Draine et al. Reference Draine2007; Ciesla et al. Reference Ciesla2014). As shown in Figure 2, SPICA can drastically improve the SFR estimates by measuring the spectrum of the dust emission in the 24–60 μm range.
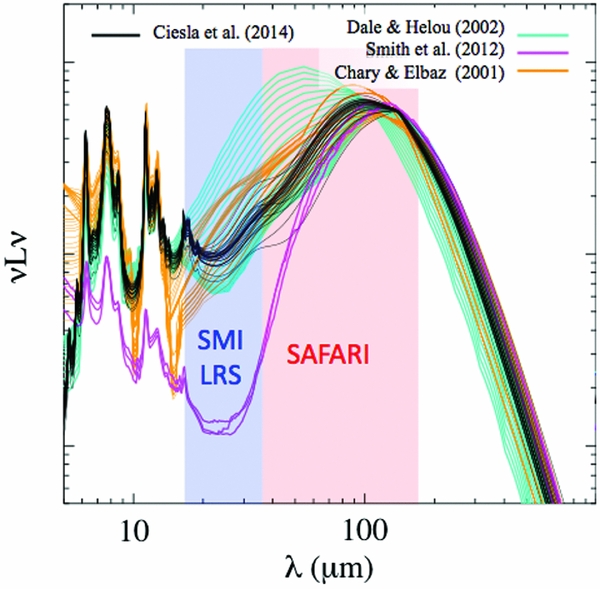
Figure 2. Average observed SED from the Herschel Reference Survey (HRS), normalised to 1 L⊙. Superposed are model SEDs for typical dust emission templates widely used to derive the L IR and therefore the obscured SFR, selected in the same range of L IR. Multiple lines of the same colour are different models from the same library. The shape of the SED is seen to vary greatly between libraries, especially in the SPICA wavelength range.
3.2. Structure of the ISM in nearby galaxies
Mid- and far-IR spectroscopic mapping of Local Group galaxies holds great scientific potential because the full mix of ISM phases can be studied in detail in and around individual molecular clouds. At SPICA′s diffraction limit, the HD lines at 56 and 112 μm can be used to map cloud complexes in the Magellanic Clouds at parsec resolution (1 pc at 56 μm, 2 pc at 112 μm), enabling a direct measure of size and molecular mass missed by CO observations (i.e., the CO-dark gas) in these environments of roughly 1/2 and 1/5 solar metallicity. At SPICA′s sensitivity, this can be done for clouds in many different environments in terms of radiation field and stellar surface density, in addition to the wide variety of metallicities in local galaxies. The HD lines are thus part of an overall study of the multiphase ISM in local galaxies which demands extreme sensitivity, which will reveal how much gas exists in each phase, at each density, and at each temperature. Extending such studies to large regions of local galaxies will shed light on the origin of the gas distribution over ISM phases, in particular the roles of radiation field, local gravity, and shocks.
Although ISO and Herschel observed the mid- and far-IR ranges, their spectroscopic sensitivity was limited so that only individual pointings or very small maps could be made of galaxies (e.g., Mookerjea et al. Reference Mookerjea2016). The >100× higher sensitivity of SPICA will open up new windows on the diffuse ISM and less active regions of galaxies, which is critical for assembling the complete picture of star formation in galaxies of all types—not just the most active systems. Furthermore, the extreme sensitivity of SPICA enables large-scale low-noise mapping to detect weak lines and measure the density, abundances, and temperatures of the H ii regions, PDRs, and diffuse ionised gas throughout local galaxies, down to parsec resolution in the Magellanic Clouds. High spatial resolution is important because fluxes and line ratios reflect the mixture of gas found within the telescope beam. Throughout the Local Group, the spatial resolution of SPICA is sufficient to resolve individual molecular clouds and separate molecular clouds from PDRs and H ii regions. It is also important to be able to isolate regions with only the warm diffuse component which sets the external pressure. Due to their proximity, the Magellanic Clouds in particular (49 and 69 kpc away) will be prime mapping targets. At this distance, the diffraction limit of SPICA at 158 μm is 8–10 pc, which is comparable to the typical sizes of molecular clouds. These measurements were not feasible with previous IR missions due to limited sensitivity and/or wavelength coverage, nor are they expected with any other mission planned to date. Such a comprehensive suite of observations will be a key step forward in our understanding of the structure and cooling of the ISM.
In the Magellanic Clouds, one can straightforwardly map several molecular cloud complexes. When mapping at 3 h arcmin−2, SPICA reaches a sensitivity such that all regions over column densities of 1022 cm−2 will be detected in the HD 1–0 transition for a gas temperature of 20 K (reasonable in the LMC, temperature probably higher in SMC). The 2–1 transition will remain undetectable, except in regions of active star formation where it will shine brightly as soon as the gas reaches 40 K, yielding both mass and temperature independent of CO and dust emission. Individual single pointings can of course go much deeper in only 1 h per pointing. For the more distant Local Group dwarfs, such as WLM and NGC 6822, slightly more time per square arcminute is required but each map can be smaller, covering the region observed with ALMA by Rubio et al. (Reference Rubio2015) in WLM and the major H ii regions in Hubble V and X in NGC 6822. The multitude of very nearby dwarf galaxies allows for a good measure of the H2 column density in a variety of environments and metallicities to well characterise not only the N(H2)/I CO ratio but also the dust cross-section per H-atom. The sensitivity of SPICA is such that the C ii, O i, O iii, N ii, N iii, and H2 lines in Table 1, in addition to high energy H2O lines, will be detected simultaneously with the HD, thus not requiring additional observing time.
Observing galaxies at a range of distances offers the possibility to connect their cloud-scale, kpc-scale, and galaxy-scale properties. In particular, just beyond the Local Group, galaxies such as M51, M83, and M82 represent the luminosity range (~L *) for which SPICA will provide resolved data. They span a range of morphologies and types: M51 is a bright grand design spiral, M83 is a bright strongly barred spiral, and M82 is a small but starbursting object. At intermediate redshifts (i.e., z ~ 0.5), SPICA would detect such galaxies in both spectroscopy and continuum, but not resolve them. In such cases, having local benchmarks is key to measure whether, how, and why intermediate-redshift galaxies differ from local objects. Several square arcminutes of M51, M83, and M82 can be mapped with SPICA at a sensitivity similar to that of the local group dwarfs (discussed above) in order to detect HD in similar situations (to identify the differences) as well as all the other lines. In the local objects, SPICA can clearly separate the nuclear regions from the disk but also identify emission characteristic of a bar and separate the arm and interarm regions at a variety of radial distances. Studies with Herschel have shown significant differences between the nuclei of galaxies and their disks, both in the molecular abundances (González-Alfonso et al. Reference González-Alfonso2012) and in the cosmic-ray ionisation rate (Van der Tak et al. Reference Van der Tak, Weiß, Liu and Güsten2016). Comparing the HD, C ii, O i, O iii, N ii, N iii, and H2 lines to local galaxies, SPICA will enable us to estimate the fraction of emission coming from the different regions. Where previous IR space telescopes were only able to observe the extreme starbursts (>1012 L⊙), the sensitivity of SPICA enables rather normal star-forming galaxies to be detected at intermediate redshifts, and thus to study how the conditions in these non-exceptional objects change with cosmic time.
3.3. Energy dissipation from clouds to star-forming regions
Large (~kpc)-scale motions in galaxies generate interstellar turbulence, and the corresponding turbulent kinetic energy is either dissipated by velocity shears (non-compressive mode; Falgarone, Pety, & Hily-Blant Reference Falgarone, Pety and Hily-Blant2009) or leads to the formation of dense structures at the origin of star formation through shocks (compressive mode; Godard, Falgarone, & Pineau Des Forêts Reference Godard, Falgarone and Pineau Des Forêts2009). Molecular clouds are partly supported by these turbulent, supersonic motions, and dissipation of this kinetic energy (turbulent dissipation) is therefore central to the regulation of star formation. The current picture is that turbulent dissipation occurs in low-velocity shocks which are closely related to the formation of filamentary structures (Padoan et al. Reference Padoan, Juvela, Goodman and Nordlund2001; Pudritz & Kevlahan Reference Pudritz and Kevlahan2013). The resulting warm gas has been proposed to correspond to the observed excess of mid-J CO emission in nearby clouds (Pon, Johnstone, & Kaufman Reference Pon, Johnstone and Kaufman2012; Larson et al. Reference Larson, Evans, Green and Yang2015). Subsequent formation of star-forming dense filaments may be associated with shocks in intermediate-density regions (103–104 cm−3), where a large fraction of kinetic energy is released through [O i] 63, 145 μm and CO line emission (Draine et al. Reference Draine, Roberge and Dalgarno1983; Lesaffre et al. Reference Lesaffre2013).
While low-density (~102 cm−3) turbulent dissipation will be studied by JWST H2 observations, high-sensitivity spectroscopy of a wide range of far-IR lines is crucial to correctly estimate the contribution from PDRs and study shocks down to low velocities. The regime below 3–4 km s−1 at densities of 103–104 cm−3 is well probed by the major [O i] 63 μm cooling line, which traces the bulk of the energy dissipation processes to form star-forming filaments (Figure 3). While oxygen is likely partially locked up in ice at A V >2–3, depletion is unlikely for the shocked material considered here. With SPICA, we will be able to obtain the first global picture of the energy dissipation processes from low-density shocks to filaments and star formation in the Galactic ISM. This will complement ALMA low-J CO observations, clearly identifying how shocks and turbulent dissipation occur, and clarifying the connection with the formation of dense filamentary structures and massive ridges of cluster-forming clumps.
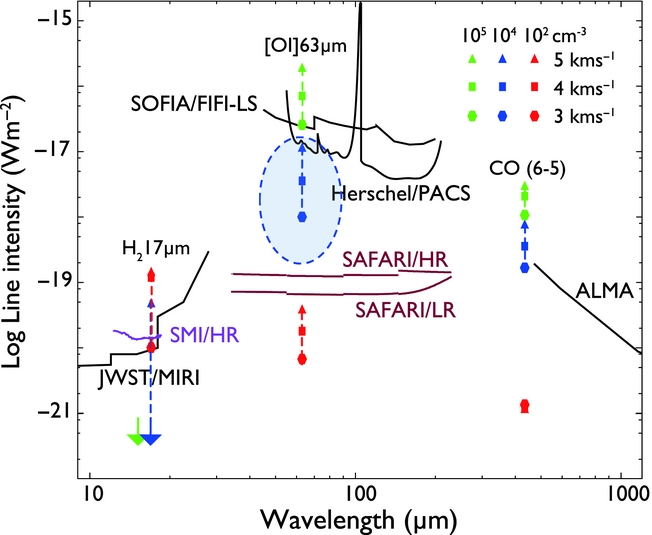
Figure 3. Predicted intensities of the H2 S(1) 17 μm, [O i] 63 μm, and CO J = 6 − 5 lines for MHD shocks with different pre-shock densities and shock velocities (Draine, Roberge, & Dalgarno Reference Draine, Roberge and Dalgarno1983; Lesaffre et al. Reference Lesaffre2013) in comparison to SAFARI and SMI sensitivities. The blue shaded region indicates the shocks that only SPICA can trace (103–104 cm−3 down to 3 km s−1).
4 INTERSTELLAR MATTER RESERVOIRS OF GALAXIES
Most star-formation activity in galaxies occurs in and is fueled by the molecular gas reservoir, which cannot be probed directly due to its low temperature. Cold H2 is usually probed by CO observations (e.g., Bolatto et al. Reference Bolatto, Wolfire and Leroy2013), but it is becoming increasingly clear that using only CO may miss a large fraction of the total molecular gas residing in galaxies (Madden et al. Reference Madden, Poglitsch, Geis, Stacey and Townes1997; Grenier et al. Reference Grenier, Casandjian and Terrier2005; Planck Collaboration 2011). In such CO-dark gas, the dust extinction is low and CO is photodissociated but H2 can survive due to its self-shielding effects. In our Galaxy, the mass of CO-dark gas ranges from at least 30% to ~100% of that traced by CO, with variations depending on the metallicity gradient from the inner to the outer Galaxy (Langer et al. Reference Langer, Velusamy, Pineda, Willacy and Goldsmith2014). For the half-solar metallicity spiral M33, Gratier et al. (Reference Gratier2017) found that CO traces only ~50% of the molecular gas, without any radial dependence. The ‘missing molecular mass’ problem is acute for the low-extinction ISM of low metallicity galaxies (Wolfire, Hollenbach, & McKee Reference Wolfire, Hollenbach and McKee2010; Nordon & Sternberg Reference Nordon and Sternberg2016), where vigorous star formation is often observed, but little or no cold gas reservoir is detected in the form of CO (e.g., Schruba et al. Reference Schruba2012; Cormier et al. Reference Cormier2014, Reference Cormier2017). Using tracers such as HD and [C ii], SPICA can uncover the total H2 reservoir in such galaxies where CO-based estimates may be off by orders of magnitude (Hunt et al. Reference Hunt2015; Israel, Rosenberg, & van der Werf Reference Israel, Rosenberg and van der Werf2015).
4.1. Probing cool gas with HD
The full impact of metallicity on the ISM and star formation and their interplay can only be understood via detailed studies of the different galactic ISM phases. One of the outstanding issues today is how vigorous star formation can exist in low metallicity environments where CO, the common tracer of the H2 reservoir, is difficult to detect. The size and the nature of the gas reservoir in these systems is unknown, and hence the efficiency of the gas to cool and collapse into stars. To detect and characterise the gas reservoirs of galaxies, the HD lines at 112 and 56 μm play a key role, as they are the most direct tracers of cool molecular gas (H2, $T {_>\atop {^\sim }}$
30–50 K). Using both lines gives a direct handle on the temperature dependence of the emission (e.g., Trapman et al. Reference Trapman, Miotello, Kama, van Dishoeck and Bruderer2017). The bulk of the CO-dark gas is at low extinctions (A
V = 0.5–1.0) where gas temperatures exceed ~30 K (Wolfire et al. Reference Wolfire, Hollenbach and McKee2010), which makes HD a good probe of this gas. The D/H ratio is well determined (≈25 ppm; Linsky et al. Reference Linsky2006) and the effect of astration is small for the Solar neighbourhood (≈5 ppm), including the effect of infalling pristine gas from the Galactic halo. For dwarf galaxies with low SFRs, the effect of astration should be even smaller, but enhanced HD photodissociation may be more important. Observations of molecular D/H ratios with ALMA may help to limit uncertainties in the HD abundance. With ISO and Herschel, the HD lines have been observed toward a few Galactic objects (Wright et al. Reference Wright, van Dishoeck, Cox, Sidher and Kessler1999; Bergin et al. Reference Bergin2013; McClure et al. Reference McClure2016), but the ~100 times higher sensitivity of SPICA/SAFARI will allow their detection in nearby galaxies as well (Figure 4), which, when combined with gas temperature estimates from HD or other molecules, will give accurate H2 masses. For example, at temperatures of 20–30 K, giant molecular clouds (GMCs) of 106–107 M⊙ are detectable out to ~10 Mpc distance, which covers ~100 spiral galaxies. In dwarf galaxies, gas temperatures may be higher, so that smaller clouds and larger distances become detectable. High-sensitivity HD observations will thus shed light on ‘CO-dark’ gas, because they give a tracer in which this gas is not dark anymore.
$T {_>\atop {^\sim }}$
30–50 K). Using both lines gives a direct handle on the temperature dependence of the emission (e.g., Trapman et al. Reference Trapman, Miotello, Kama, van Dishoeck and Bruderer2017). The bulk of the CO-dark gas is at low extinctions (A
V = 0.5–1.0) where gas temperatures exceed ~30 K (Wolfire et al. Reference Wolfire, Hollenbach and McKee2010), which makes HD a good probe of this gas. The D/H ratio is well determined (≈25 ppm; Linsky et al. Reference Linsky2006) and the effect of astration is small for the Solar neighbourhood (≈5 ppm), including the effect of infalling pristine gas from the Galactic halo. For dwarf galaxies with low SFRs, the effect of astration should be even smaller, but enhanced HD photodissociation may be more important. Observations of molecular D/H ratios with ALMA may help to limit uncertainties in the HD abundance. With ISO and Herschel, the HD lines have been observed toward a few Galactic objects (Wright et al. Reference Wright, van Dishoeck, Cox, Sidher and Kessler1999; Bergin et al. Reference Bergin2013; McClure et al. Reference McClure2016), but the ~100 times higher sensitivity of SPICA/SAFARI will allow their detection in nearby galaxies as well (Figure 4), which, when combined with gas temperature estimates from HD or other molecules, will give accurate H2 masses. For example, at temperatures of 20–30 K, giant molecular clouds (GMCs) of 106–107 M⊙ are detectable out to ~10 Mpc distance, which covers ~100 spiral galaxies. In dwarf galaxies, gas temperatures may be higher, so that smaller clouds and larger distances become detectable. High-sensitivity HD observations will thus shed light on ‘CO-dark’ gas, because they give a tracer in which this gas is not dark anymore.
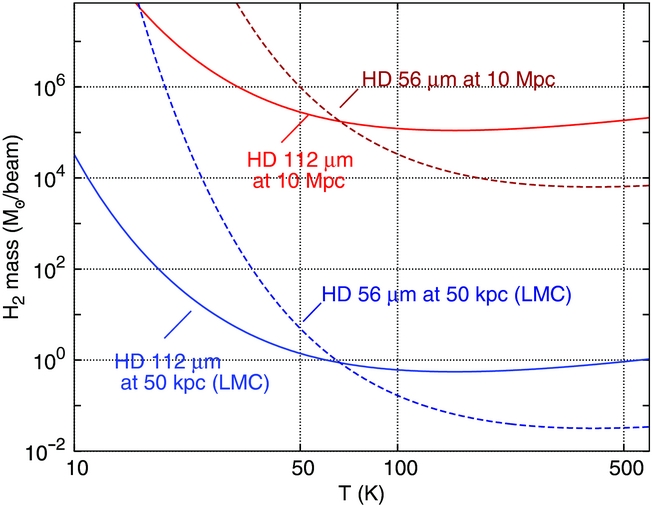
Figure 4. Detectable molecular mass in HD as a function of distance and gas temperature, for a flux limit of 5× 10⁻²⁰ W m−2 (SAFARI R = 300).
4.2. Probing CO-dark gas with fine-structure lines
For distant galaxies, the HD lines are too weak to detect, and fine structure lines will be key to measuring the total molecular gas reservoir. For the expected sensitivity of SPICA, this limit lies at ~10 Mpc (Figure 4). Studies with Herschel show that the [C ii] line is relatively bright in low-metallicity galaxies even though CO is faint (Figure 5), as expected for stronger radiation fields (Nordon & Sternberg Reference Nordon and Sternberg2016). Recent ALMA observations indicate that low-metallicity galaxies contain large C+–H2 zones where CO is confined to small dense clumps (Indebetouw et al. Reference Indebetouw2013; Rubio et al. Reference Rubio2015; Chevance et al. Reference Chevance2016). Contributions to the C+ emission by atomic gas (Lebouteiller et al. Reference Lebouteiller2017) can be calibrated with the [N ii] 122, 205 μm and [O i] 63, 145 μm lines. Mid- and far-IR lines (Table 1), including the [C ii] 158 μm line, can be used to quantify the total molecular gas reservoir in galaxies, including the CO-dark H2 that resides outside of the CO-emitting region. Comparison of HD and [C ii] observations of nearby (<10 Mpc) galaxies will be key to calibrate the two tracers against each other.
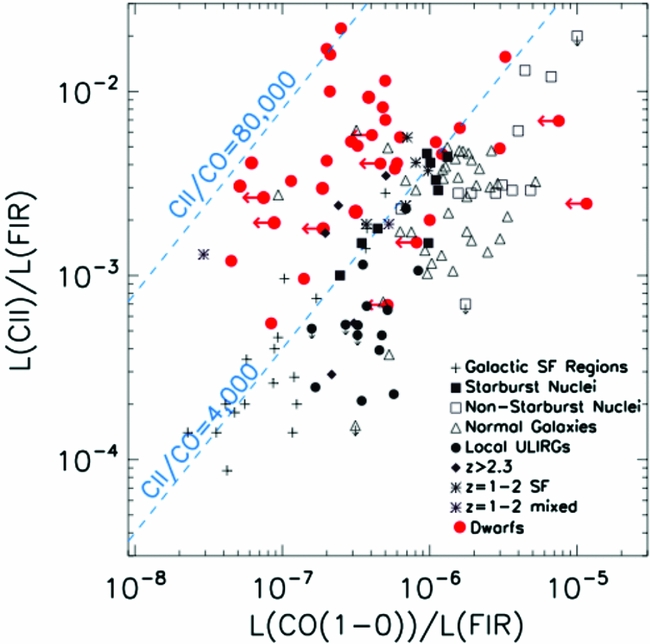
Figure 5. Luminosity in [C ii] versus that in CO, both normalised to the far-infrared luminosity, for galaxies with widely ranging star-forming activity: quiescent galaxies, starburst galaxies, ULIRGS, high-z galaxies, and dwarf galaxies. Dashed lines are examples of constant [C ii]/CO ratios. While most normal and SB galaxies show L[C ii]/CO between 1 000 and 4 000, low-metallicity dwarf galaxies show much higher ratios, up to an order of magnitude. From Madden, Cormier, & Rémy-Ruyer (Reference Madden, Cormier, Rémy-Ruyer, Jablonka, André and van der Tak2016).
With SPICA′s sensitivity, we will obtain a complete picture of the ISM in the lowest metallicity galaxies, including their currently elusive molecular phase. A comprehensive suite of the mid- and far-IR fine structure lines provided by SPICA, such as [C ii] 158 μm, [O i] 63 μm, [O i] 145 μm, [N ii] 122 μm, [O iii] 88 μm, [O iii] 52 μm, [N iii] 57 μm, [Si ii] 35 μm, and the [S iii] and 33 μm lines, covers 8 to 40 eV in ionisation energies and from 100 to 105 cm−3 in gas densities. Such a wide range of properties provides a full picture of the various phases of galaxies, such as the filling factors of the dense and diffuse ionised and neutral gas, and trace their temperatures, densities, abundances, and radiation fields. A glimpse of what will be possible for many galaxies is demonstrated in Cormier et al. (Reference Cormier2012).
4.3. Diffuse gas in galaxies
A major challenge in understanding the ISM of nearby galaxies is imaging material in diffuse regions with low gas column densities, which requires high surface brightness sensitivity. Mapping [C ii] emission with SPICA is ideal for this purpose, especially on scales ${{_>\atop {^\sim }}}10$
arcsec where radio interferometers lack sensitivity. In high-resolution mode, the longest-wavelength channel of SAFARI offers a 5σ flux limit of 5.1× 10⁻¹⁹ W m−2 for an 1 arcmin × 1 arcmin field (Roelfsema et al. Reference Roelfsema2018), which corresponds to a 1σ surface brightness sensitivity of 1.9× 10⁻¹¹ W m−2 sr−1 in 15 s. This sensitivity, W, is related to the C+ column density
${{_>\atop {^\sim }}}10$
arcsec where radio interferometers lack sensitivity. In high-resolution mode, the longest-wavelength channel of SAFARI offers a 5σ flux limit of 5.1× 10⁻¹⁹ W m−2 for an 1 arcmin × 1 arcmin field (Roelfsema et al. Reference Roelfsema2018), which corresponds to a 1σ surface brightness sensitivity of 1.9× 10⁻¹¹ W m−2 sr−1 in 15 s. This sensitivity, W, is related to the C+ column density $N_{\text{C}^+}$
by
$N_{\text{C}^+}$
by
 $$\begin{equation*}
W = \frac{h\nu }{4\pi } A_{ij} N_{\text{C}^+} f_{\text{u}},
\end{equation*}$$
$$\begin{equation*}
W = \frac{h\nu }{4\pi } A_{ij} N_{\text{C}^+} f_{\text{u}},
\end{equation*}$$
where hν, f
u, and A
ij
are the photon energy, the upper level population, and the spontaneous decay rate of the [C ii] 158 μm line (Crawford et al. Reference Crawford, Genzel, Townes and Watson1985). For a gas density well above the critical value of ≈4 000 cm−3 and a kinetic temperature well above E
up/k
B ≈ 92 K, this yields $N_{\text{C}^+}$
~1.3× 1013 cm−2; for the cases of lower gas temperatures and/or densities, see Figure 6 of Madden et al. (Reference Madden1993). Assuming a solar carbon abundance with all carbon in C+, and neglecting contributions from ionised gas to the [C ii] emission, the corresponding hydrogen column density is ~3.8× 1016 cm−2. Accounting for the contribution of He to the mass, this column corresponds to a surface density of ~4× 10⁻⁴ M⊙ pc−2, which is orders of magnitude below the threshold of 1– 2 M⊙ pc−2 (Martin & Kennicutt Reference Martin and Kennicutt2001; Schruba et al. Reference Schruba2011), below which star formation is not observed to occur. For comparison, Jansky VLA observations of the H i 21 cm line, matched to the same 13 arcsec resolution, reach a column depth of 1.4× 1021 cm−2, which is ~104 times less deep. The SKA is currently planned to have 3× the collecting area of the VLA, mostly on short baselines, and thus ~3 × the VLA sensitivity, which is still well below SPICA′s capabilities for warm gas (Figure 6). With this high brightness sensitivity, SAFARI will be uniquely suited to probe extraplanar material and extended UV disks (e.g., Thilker et al. Reference Thilker2007), measuring the in-situ conditions for star formation in a regime that has been completely inaccessible in the past. Similarly, SPICA will have extraordinary potential for tracing gas ejected in galactic fountains or winds, which in nearby galaxies can be imaged using far-IR transitions, particularly the [C ii] line (e.g., Contursi et al. Reference Contursi2013).
$N_{\text{C}^+}$
~1.3× 1013 cm−2; for the cases of lower gas temperatures and/or densities, see Figure 6 of Madden et al. (Reference Madden1993). Assuming a solar carbon abundance with all carbon in C+, and neglecting contributions from ionised gas to the [C ii] emission, the corresponding hydrogen column density is ~3.8× 1016 cm−2. Accounting for the contribution of He to the mass, this column corresponds to a surface density of ~4× 10⁻⁴ M⊙ pc−2, which is orders of magnitude below the threshold of 1– 2 M⊙ pc−2 (Martin & Kennicutt Reference Martin and Kennicutt2001; Schruba et al. Reference Schruba2011), below which star formation is not observed to occur. For comparison, Jansky VLA observations of the H i 21 cm line, matched to the same 13 arcsec resolution, reach a column depth of 1.4× 1021 cm−2, which is ~104 times less deep. The SKA is currently planned to have 3× the collecting area of the VLA, mostly on short baselines, and thus ~3 × the VLA sensitivity, which is still well below SPICA′s capabilities for warm gas (Figure 6). With this high brightness sensitivity, SAFARI will be uniquely suited to probe extraplanar material and extended UV disks (e.g., Thilker et al. Reference Thilker2007), measuring the in-situ conditions for star formation in a regime that has been completely inaccessible in the past. Similarly, SPICA will have extraordinary potential for tracing gas ejected in galactic fountains or winds, which in nearby galaxies can be imaged using far-IR transitions, particularly the [C ii] line (e.g., Contursi et al. Reference Contursi2013).
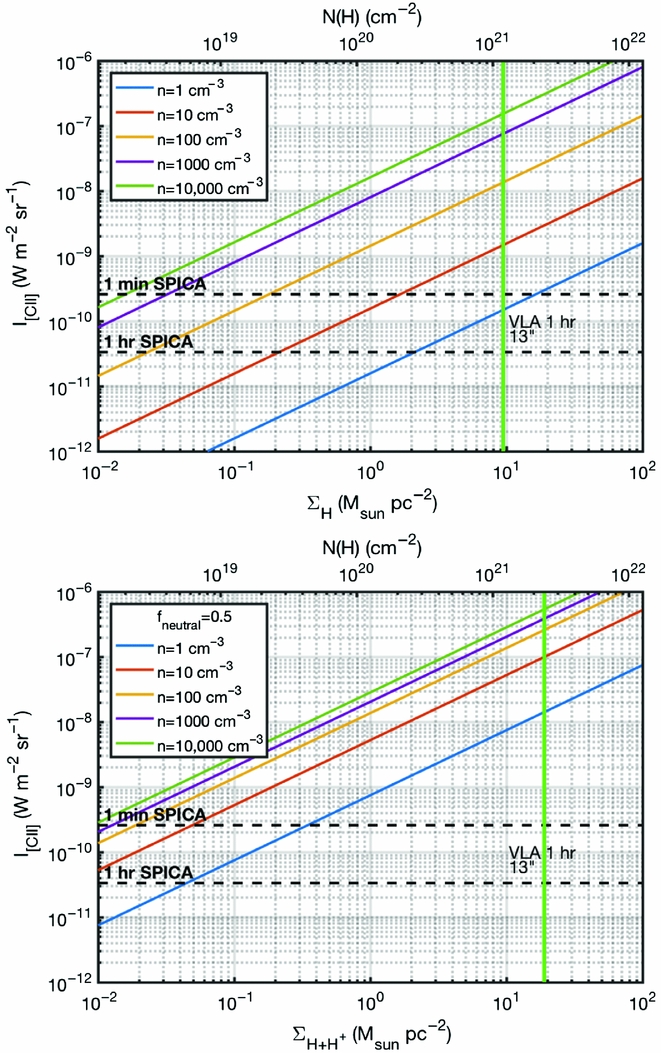
Figure 6. Predicted [C ii] 158 μm emission versus column and surface density (top and bottom axes) of warm diffuse atomic gas, with the sensitivities of SPICA and the VLA indicated. The top panel assumes purely neutral gas; the bottom panel assumes 50% ionised gas. The gas temperature is assumed to be ≫92 K, and the effect of gas density is indicated. All carbon is assumed to be in C+, with a Solar carbon abundance. The width of the lines is taken to be 125 km s−1.
5 THE ORIGIN AND EVOLUTION OF DUST IN GALAXIES
In normal star-forming galaxies (SFR ~1 M⊙ yr−1), the fraction of starlight absorbed by dust and re-emitted in the far-IR is determined to be about one-third on average (Popescu & Tuffs Reference Popescu and Tuffs2002; Skibba et al. Reference Skibba2011; Viaene et al. Reference Viaene2016). In actively star-forming galaxies (SFR ${_>\atop {^\sim }}$
10 M⊙ yr−1), this fraction goes up to 90%, and even higher in ULIRGs like Arp 220, which is evidence that IR emission from dust is the major cooling process during star formation in galaxies. Although dust is key to ISM energetics and regulating SFRs (e.g., Forbes et al. Reference Forbes, Krumholz, Goldbaum and Dekel2016), its formation and the path to its ultimate composition remain poorly understood. Simultaneous spectroscopy of dust and gas over a wide mid- and far-IR wavelength range will unveil and characterise the chemical and physical conditions where dust grains are formed, processed, and destroyed in unprecedented detail. The dust emission from galaxies peaks in the far-IR wavelength range, and complements observations of mid-IR dust and PAH features with JWST, in particular toward AGB stars.
${_>\atop {^\sim }}$
10 M⊙ yr−1), this fraction goes up to 90%, and even higher in ULIRGs like Arp 220, which is evidence that IR emission from dust is the major cooling process during star formation in galaxies. Although dust is key to ISM energetics and regulating SFRs (e.g., Forbes et al. Reference Forbes, Krumholz, Goldbaum and Dekel2016), its formation and the path to its ultimate composition remain poorly understood. Simultaneous spectroscopy of dust and gas over a wide mid- and far-IR wavelength range will unveil and characterise the chemical and physical conditions where dust grains are formed, processed, and destroyed in unprecedented detail. The dust emission from galaxies peaks in the far-IR wavelength range, and complements observations of mid-IR dust and PAH features with JWST, in particular toward AGB stars.
5.1. Dust content of nearby galaxies
In the traditional view of galaxy enrichment, star formation results in metal production through nucleosynthesis in massive stars on short (~Myr) timescales. The presence of a large amount of refractory elements enables condensation of a large dust mass in galaxies with strong star formation. Indeed, the total dust masses of galaxies generally appear to correlate with their two major properties: SFR and metallicity (da Cunha et al. Reference da Cunha, Eminian, Charlot and Blaizot2010), and some high-redshift galaxies clearly were already dust-rich (e.g., Laporte et al. Reference Laporte2017). However, recent discoveries of starbursting dwarf galaxies with little dust call into question the standard picture (Rémy-Ruyer et al. Reference Rémy-Ruyer2014; Fisher et al. Reference Fisher2014). Equally interesting and somewhat hard to interpret is the recently discovered class of low-mass galaxies with a large dust mass and a high SFR, but very little UV attenuation (Clark et al. Reference Clark2015; De Vis et al. Reference De Vis2017). Also, in damped Lyman α systems, the dust to gas mass ratio measured in absorption seems to follow a linear trend with metallicity, down to Z = 10−2 Z⊙, suggesting that the star-formation history plays a role. A large systematic survey measuring the dust masses of galaxies in the local universe is needed to understand the origin of the observed relations between dust mass and SFR, metallicity, and galaxy type. More modelling is needed to quantify how far SPICA can push the current limits in terms of specific parameters, in particular dust mass, SFR, and metallicity.
The primary means to measure dust masses is the submillimetre range, for which good quality data exist from the Herschel and Planck missions, but the main uncertainty in their interpretation is the dust emissivity. In the LMC (Galliano et al. Reference Galliano2011), the far-IR grain emissivity is found to be 2–3 times higher than in the widely used prescription of Draine & Li (Reference Draine and Li2007) which fits data for the Milky Way (Planck Collaboration 2014). Detailed panchromatic radiative transfer studies of edge-on spiral galaxies point in a similar direction (Baes et al. Reference Baes2011; De Geyter et al. Reference De Geyter2015; Mosenkov et al. Reference Mosenkov2016). Getting the dust emissivity correct throughout the mid- to far-IR is essential to estimate extinctions at optical/UV wavelengths, which are key to derive stellar masses and SFRs. The uncertain emissivity calls into question the dust chemical composition in our Galaxy and its variation within galaxies (Fanciullo et al. Reference Fanciullo2015). Local conditions such as gas density or dust temperature may affect the dust emissivity (Mennella et al. Reference Mennella1998; Ysard et al. Reference Ysard2015), as suggested by apparent dust emissivity changes across galaxies (Smith et al. Reference Smith2012; Tabatabaei et al. Reference Tabatabaei2014). These results demonstrate the need for more reliable measurements to constrain dust models, also for the interpretation of high-redshift observations. Far-IR observations are especially crucial for low-metallicity galaxies, for which the dust emission peaks shortward of 100 μm and where free–free emission outshines dust at longer (ALMA) wavelengths.
Sensitive far-IR observations with SPICA would allow us to study dust in the diffuse ISM of nearby galaxies, which is useful because it is the phase that is the closest to uniform illumination, so that radiative transfer effects (temperature mixing, etc.) can be neglected. Since CO-dark gas and optically thick H i are negligible for this phase, the gas mass from H i 21 cm data can be used to calibrate the dust properties.
Understanding dust properties as a function of metallicity is an essential step toward accurately probing the dust masses of high-redshift galaxies, which tend to have metallicities well below solar. Dust at high redshift is a topic of great current interest (Watson et al. Reference Watson2015; Laporte et al. Reference Laporte2017), but results up to now have been very uncertain. Attempting to go into the lowest metallicity regime, Herschel surveys of the observed gas-to-dust (G/D) ratio in galaxies over 2 dex in metallicity range show a striking non-linear evolution, with little dust present in lower metallicity galaxies (Rémy-Ruyer et al. Reference Rémy-Ruyer2014). While supernovae are clearly a significant source of heavy elements, their dust destruction rates may exceed their dust-formation rates, so that supernovae may not be sufficient to account for observed dust masses at low metallicity. Chemical evolution models require grain growth by mantle accretion which is efficiently producing dust at $Z / \text{Z}_{\odot } {_>\atop {^\sim }}0.1$
(e.g., Asano et al. Reference Asano, Takeuchi, Hirashita and Inoue2013; Zhukovska Reference Zhukovska2014; Feldmann Reference Feldmann2015) to explain the observations. Lower metallicity environments require more time to accumulate metals for grain growth (Rémy-Ruyer et al. Reference Rémy-Ruyer2014; Zhukovska Reference Zhukovska2014). To develop these models into diagnostic prescriptions, the low metallicity part of parameter space must be well sampled observationally, for which Herschel lacked sensitivity. Detailed models are required to establish to which depth in metallicity the extreme sensitivity of SPICA will allow us to probe. By detecting and characterising the dust content of extremely low metallicity galaxies for the first time, SPICA would make a link with galaxy formation in the early Universe.
$Z / \text{Z}_{\odot } {_>\atop {^\sim }}0.1$
(e.g., Asano et al. Reference Asano, Takeuchi, Hirashita and Inoue2013; Zhukovska Reference Zhukovska2014; Feldmann Reference Feldmann2015) to explain the observations. Lower metallicity environments require more time to accumulate metals for grain growth (Rémy-Ruyer et al. Reference Rémy-Ruyer2014; Zhukovska Reference Zhukovska2014). To develop these models into diagnostic prescriptions, the low metallicity part of parameter space must be well sampled observationally, for which Herschel lacked sensitivity. Detailed models are required to establish to which depth in metallicity the extreme sensitivity of SPICA will allow us to probe. By detecting and characterising the dust content of extremely low metallicity galaxies for the first time, SPICA would make a link with galaxy formation in the early Universe.
5.2. Dust formation in supernovae and AGB stars
Major outstanding questions concerning dust in galaxies are the locations where dust grains are formed, and how much mass is formed by each dust source. Two major sources of the elements that make up dust exist: AGB stars and supernovae. In the Milky Way, AGB stars have been identified as an important dust source, but this result does not seem to hold across other types of galaxies. Recent estimates of the dust mass and composition in the Magellanic Clouds suggest that AGB stars are not dominant contributors to the present day dust reservoir (Matsuura et al. Reference Matsuura2009; Boyer et al. Reference Boyer2012; Kemper Reference Kemper2013). Other evidence suggests that a substantial part of the dust mass must have been formed in the ISM (Mattsson et al. Reference Mattsson2014; Rémy-Ruyer et al. Reference Rémy-Ruyer2015). Deep mid- and far-IR spectra of gas and dust for a wide range of local conditions in the ISM across many galaxies are required to constrain the local physical conditions (temperature and density) needed for particular dust processes to occur. For instance, De Vries et al. (Reference De Vries2012) have shown how the central position and the width of the 69 μm forsterite feature can be used to determine the iron content and the temperature of the dust grains, even at R = 300. Also, Planck Collaboration (2016) have found variations of dust properties with radiation field intensity, which has led to a new dust model by Jones et al. (Reference Jones2016).
As an alternative to AGB stars, there is growing evidence that the aftermaths of supernova explosions are major sites of dust formation (Rho et al. Reference Rho2009; Barlow et al. Reference Barlow2010; Matsuura et al. Reference Matsuura2011; Gomez et al. Reference Gomez2012; De Looze et al. Reference De Looze2017), and supernovae can be a major source of dust in galaxies (e.g., Dwek & Cherchneff Reference Dwek and Cherchneff2011; Rowlands et al. Reference Rowlands2014; Michałowski Reference Michałowski2015). Our current understanding of dust formation in SNe is presently hampered by the small sample size, limited wavelength coverage, and limited time frame. While changes from circumstellar dust to ejecta have been reported for various recent supernovae (e.g., Gall et al. Reference Gall2014), our only supernova example of long-term dust evolution is provided by SN 1987A (Wesson et al. Reference Wesson, Barlow, Matsuura and Ercolano2015; Bevan & Barlow Reference Bevan and Barlow2016). Its dust thermal emission was initially detected at near- and mid-IR wavelengths within 1 yr after the explosion, with an estimated dust mass of ~10−4 M⊙ (Wooden et al. Reference Wooden1993). The mid-IR emission disappeared in 2 yrs, while suddenly after 25 yrs thermal dust emission appeared in the far-IR, with an estimated mass of ~0.5 M⊙ (Matsuura et al. Reference Matsuura2015). Currently, we have no idea how the dust mass increased between 3 and 25 yrs, leaving a big gap in our understanding of dust formation in SNe. Wesson et al. (Reference Wesson, Barlow, Matsuura and Ercolano2015) suggested that the peak of the SED gradually shifted from short to long wavelengths over 25 yrs, with increasing dust mass. An alternative scenario is that a large mass was present from early days but emission was optically thick, and previous authors underestimated dust masses (Dwek & Arendt Reference Dwek and Arendt2015). Monitoring supernovae in Local Group galaxies at far-IR wavelengths is needed to settle this issue, with a time base of at least a few years. Besides sufficient sensitivity to detect supernova dust in external galaxies, a key requirement is the ability to resolve supernova dust from circumstellar and interstellar dust, which SPICA can only do for very local galaxies. Covering the full mid- to far-IR wavelength range is essential to measure the mass of warm dust produced in supernovae. Ultimately, we hope to understand if supernovae are a net source or sink of dust.
Based on current models (Figure 7), we predict SPICA/SMI to be able to take spectra of SNe exploding out to ~40 Mpc. The expected number of core collapse SNe within this distance is estimated to be ~40 yr−1, based on the observed rate in nearby galaxies (Smartt et al. Reference Smartt, Eldridge, Crockett and Maund2009). This amounts to ~200 SNe over the 5-yr mission lifetime, of which about 5 exploding within 5 Mpc can be followed-up with SAFARI.
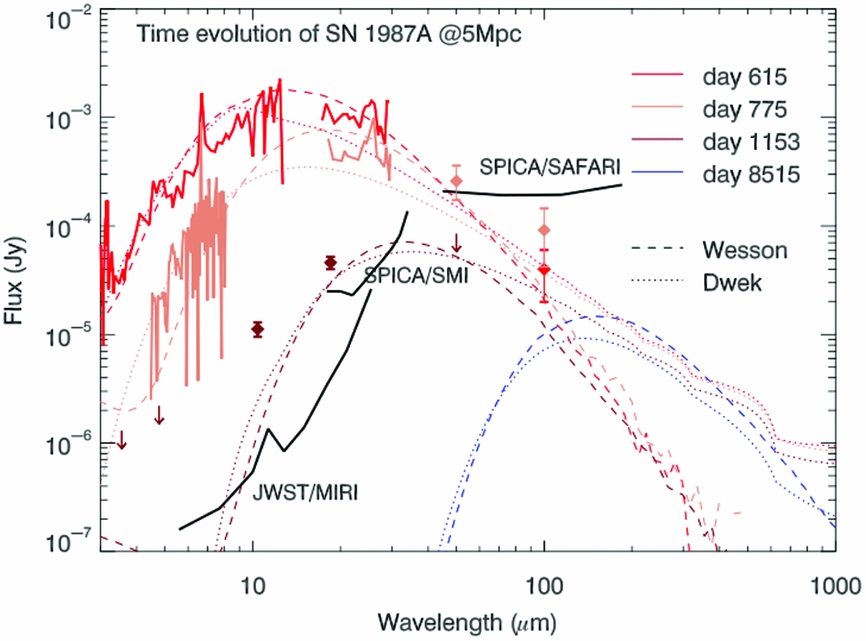
Figure 7. Time evolution of the SN 1987A ejecta, scaled to 5 Mpc. The SED of the dust emission has peaks shifting from the mid- to the far-IR in time. The observed data (histograms and points with error bars) are fitted with two different types of models: (i) an initially small dust mass (10−3 M⊙), increasing to 0.8 M⊙ over 20 yrs (Wesson et al. Reference Wesson, Barlow, Matsuura and Ercolano2015), and (ii) a large dust mass from the beginning (0.4 M⊙), with the optical depth changing in time, as the ejecta expand (Dwek & Arendt Reference Dwek and Arendt2015). Accurate photometry with SPICA/SMI has the potential to disentangle the two different models.
While detecting extragalactic supernovae in the mid- and far-IR remains a challenge even for SPICA, prospects are better for supernova remnants (SNRs), due to their larger sizes. Figure 8 shows the predicted spectral energy distributions of local SNRs, Cas A (~300-yrs old), Crab Nebula (~1 000-yrs old) and SN1987A at day ~10 000 scaled to a distance of 1 Mpc. The predicted SEDs for SNRs like the Crab, Cas A, and SN 1987A SNRs at 1 Mpc are shown in order of top to bottom: the Crab Nebula ( ~ 0.116 M⊙ including the cool T = 34 and warm 64 K components from Gomez et al. Reference Gomez2012); Cas A (Spitzer spectra from Rho et al. Reference Rho2008, warm and cold SN dust peaks from De Looze et al. Reference De Looze2017 at ~23 K and 70 K); and SN1987A (~0.2 M⊙, T = 26 K Matsuura et al. Reference Matsuura2011, Reference Matsuura2015). The figure shows that it is possible to detect the Crab and Cas A SNRs to ~1 Mpc distance with SAFARI (at least the peak of the emission) while SN1987A at 10 000 d is more difficult. However, SPICA will still provide crucial mid-IR detections of these objects with SMI. The sensitivity of this instrument (an order of magnitude better than JWST) has the potential to provide key mid-IR measurements of SNR dust. For example, Rho et al. (Reference Rho2008) used Spitzer spectra to reveal a new 21 μm dust feature as well as spectral lines from atomic species to reveal never-seen-before supernova dust freshly forming. Figure 8 demonstrates that SPICA also has the potential to reveal the composition of the mid-IR-emitting dust and gas within Cas A or Crab-like SNRs in external galaxies and provide a measurement of the mass of hot, freshly formed dust. The mid-IR holds the key dust features unique to particular compositions, such as SiO2 and FeO at 20 μm, and FeS at 30 μm.
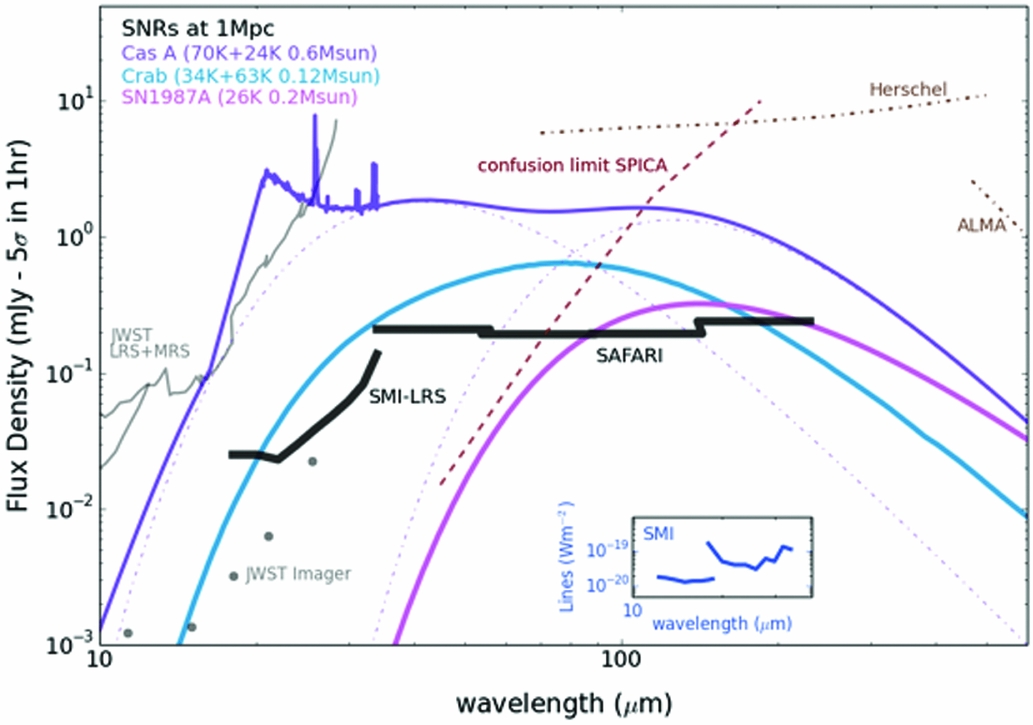
Figure 8. Sensitivity comparison for SPICA SAFARI and SMI (solid black lines) compared to Herschel, ALMA, and JWST in dot-dashed grey. The inset shows the 5-σ, 1 h levels, line sensitivities for SPICA SMI MRS and HRS spectrometers. The confusion limit is shown as a dashed line.
5.3. Grain processing and destruction
Besides dust formation, SPICA offers an opportunity to investigate the composition and evolution of interstellar dust in galaxies. Crystalline silicates in the warm circumstellar envelopes of evolved stars are readily detected in the 10–45 μm range, while crystalline silicates in colder ISM dust are better probed with the 69 μm feature (Table 1). In principle, the crystalline fraction of silicates in AGB stars can be measured using diagnostic tools, such as those proposed by Kemper et al. (Reference Kemper, Waters, de Koter and Tielens2001) and De Vries et al. (Reference De Vries, Min, Waters, Blommaert and Kemper2010). However, a systematic determination of the crystalline fraction of AGB stars observed with spectrographs on board of ISO and Spitzer is still missing, and determinations of crystalline fractions remain anecdotal. Estimates in common use place the crystallinity of the AGB silicates around 10%, however some extremely crystalline sources have been reported (Jiang et al. Reference Jiang, Zhang, Li and Lisse2013). Jones et al. (Reference Jones2012) has performed the most complete inventory into the presence of crystalline silicate features in AGB stars and Red Supergiants, in the Milky Way and both Magellanic Clouds, demonstrating a correlation with mass-loss rate; however, they did not measure the crystalline fractions.
In the ISM, cosmic-ray processing amorphitises these crystalline silicates, and the ratio between the crystalline fractions of circumstellar and interstellar silicates places constraints on the fluence of low-energy cosmic rays in galaxies (Kemper, Markwick, & Woods Reference Kemper, Markwick and Woods2011). Cosmic ray amorphisation is most efficient for heavy ions with energies around 30–60 keV. The cosmic ray flux at these relatively low energies cannot be measured directly, as the solar wind blocks such particles from entering our Solar System, which makes the measurement of silicate amorphisation an interesting alternative to constrain the low-energy cosmic ray flux. Furthermore, the shape of the 69 μm crystalline silicate feature changes with the composition of silicates. Magnesium-rich silicates have a peak at short wavelength, and shifts towards longer wavelengths are indicative of a high iron content (Blommaert et al. Reference Blommaert2014). Far-IR spectra can thus potentially determine the composition of silicate dust, which is a long standing issue.
Interstellar shocks, caused by supernova blast winds and active galactic nuclei, may destroy existing ISM dust (e.g., Jones et al. Reference Jones, Tielens, Hollenbach and McKee1994), but the efficiency of dust destruction is poorly measured by observations, especially for the carbonaceous dust component (Jones & Nuth Reference Jones and Nuth2011). To constrain these theories, determination of elemental abundances across the ISM of galaxies on ~kpc scales are required, including super bubbles and galactic outflows, which are triggered by SNe. Dust destruction would result in releasing refractory elements into their gas phase, thus elemental abundances will vary across galaxies (Lebouteiller et al. Reference Lebouteiller2008).
Observations with SPICA may contribute to our understanding of interstellar dust destruction in two ways. The dust continuum SED is a good probe of the dust size distribution in galaxies, which is indicative of dust destruction processes. In addition, mid- to far-IR spectroscopy provides us with the gas-phase metal abundance, which gives the amount of heavy elements returning to the gas phase by shock processing of dust. An example of the first approach exists for small areas on the sky (Arendt et al. Reference Arendt2010), and SPICA′s sensitivity would enable such studies across entire galaxies, as done in the SMC by Sandstrom et al. (Reference Sandstrom, Bolatto, Draine, Bot and Stanimirović2010), although further modelling efforts are needed. The second approach is interesting as a direct probe of the dust composition, as outlined in Fernández-Ontiveros et al. (Reference Fernández-Ontiveros2017). At present, we have Fe and Si abundances from Spitzer observations (Okada et al. Reference Okada2008), but a good reference is lacking. With SPICA, we can obtain the N abundance from [N iii] and [N ii] lines as a proxy for H, and also the O and C abundances, which are the major dust components. These results would give a complete picture of the cycling of metals from gas to dust and back.
6 MISSION REQUIREMENTS AND OBSERVING STRATEGY
By taking full advantage of the diagnostic power of gas-phase lines and solid-state features in the mid- to far-IR wavelength range (Table 1), a spectroscopic survey of nearby galaxies with SPICA would initiate a revolution in galaxy ISM science. A key feature of SPICA is that its spectrometers (SMI and SAFARI) provide full-band coverage with a single measurement. The SPICA mission is able to cover the entire known ranges in luminosity, metallicity, SFR, and morphological type, in a volume- or magnitude-limited sample of compact (~10 arcsec) galaxies at distances of 50–100 Mpc, so that the objects fit into a single pointing. Covering each of these parameters in ~5 bins would imply a sample size of about ~3 000. In addition, to resolve the inner workings of galaxies spatially, SPICA should observe 10–100 pointings in hundreds of nearby (~10 Mpc) galaxies to unravel the contributions of various components (nuclei, disks, spiral arms, etc.) to the mid- and far-IR spectrum. Progress will be especially outstanding for dwarf galaxies, both star-forming and irregular, where the EUCLID mission will increase the number of known objects by orders of magnitude. Equally exciting would be to probe the interstellar media of the recently discovered ‘ultra-diffuse’ galaxies (Van Dokkum et al. Reference Van Dokkum2015).
Whereas the current SPICA concept fulfils many of the above science requirements, several further improvements are desirable. Obviously, using the largest possible telescope mirror is vital to maximise both the sensitivity and the angular resolution. In the context of nearby galaxies, the higher sensitivity would especially help to probe further out into the halos of galaxies and trace the interaction with their surroundings. The smaller beam size would especially be helpful for the polarimetric imaging of star-forming regions with the POL instrument (André et al. in preparation), but also to resolve supernova dust from the galaxy background. To fit within the spacecraft, elliptical mirror shapes may have to be considered. The alternative of cooling the mirror below 8 K is lower priority, as this increases the sensitivity mainly at the longest wavelengths (>200 μm). To probe ISM physics, more useful would be to increase the number of pixels on the sky, so that the distribution of interstellar gas and dust could be mapped faster, especially for very nearby systems (Section 3.2). Extending the spectral coverage beyond 210 μm would allow observation of the C+ line beyond ~1 000 Mpc. Finally, extending the mission lifetime beyond 5 yrs would improve the monitoring timebase of supernovae and SNRs.
7 CONCLUSIONS
The SPICA mission will be a leap forward in our understanding of the baryon cycle of dust and gas in galaxies and the formation of stars. Herschel was only able to measure the 2–3 brightest far-IR lines in typical galaxies, leaving large uncertainties in global conditions resulting from model degeneracies. With SPICA, we will measure dozens of mid- and far-IR spectral features (gas-phase and dust), providing a full characterisation of the interstellar reservoirs and star-forming processes within galaxies. In addition, SPICA will be sensitive to all physical components of galaxies (disks, halos, spiral arms, etc.) and show us how they interact. But most importantly, SPICA will observe statistically significant samples of thousands of galaxies, which will give us an unbiased view of these building blocks of our Universe.
While these results are valuable in themselves, they also impact other studies. In particular, SPICA observations of nearby galaxies will be essential to understand the mid- and far-IR spectra of high-redshift galaxies (Spinoglio et al. Reference Spinoglio2017). Vice versa, SPICA observations of the ISM in local galaxies will inform studies of how such processes depend on the properties of the galaxies, and spatially resolved observations will characterise how these processes depend on the local environment.
ACKNOWLEDGEMENTS
This paper is dedicated to the memory of Bruce Swinyard, a major force behind the initial SPICA project, who died on 2015 May 22 at the age of 52. We remember him as ISO-LWS calibration scientist, Herschel-SPIRE instrument scientist, initial European PI of SPICA, and initial design lead of the SAFARI instrument.
We appreciate the helpful comments by an anonymous referee which have improved the paper. One of us (HG) acknowledges support from ERC Consolidator Grant CosmicDust.


