

Amidst the rapid industrialization and urbanization of the late nineteenth century, American governments, state and federal, passed scores of regulatory statutes aimed at preventing accidents and disease, combating fraud, and improving morality (Reference FriedmanFriedman 1974). The contemporary sociologist William Graham Sumner warned, however, that such mandated “law-ways” cannot change “folkways”—the deeply entrenched behavior patterns, normative beliefs, and related incentive systems that shape most private and business behavior (Reference SumnerSumner 1906). Sumner overstated his point, but his skepticism was not entirely unwarranted. Regulated business firms often are hostile to regulations that entail high compliance costs and reduce managerial autonomy. Standard economic theory holds that profit-seeking business firms will not take unprofitable actions to advance regulatory goals if those actions are not specifically required by law, and that firms will comply with regulations only when they believe that the compliance costs are exceeded by the cost of legal penalties for noncompliance, discounted by the probability that violations will be promptly detected and punished. And that discount rate can be high. For a variety of reasons, including the chronic understaffing of many regulatory enforcement agencies (Reference EdelmanEdelman 1964), the deterrent threat of legal sanctions often is weak or intermittent. Under those circumstances, one would expect that regulated business firms will be attentive primarily to the economics of compliance, and that their resistance to or evasion of regulatory values and requirements will be greater when compliance would be costly or would significantly limit opportunities for profit. It should not be surprising, therefore, that over the last century, a good many regulatory systems have failed to prevent harmful business practices, from overfishing to “overlending” by financial institutions, and serious violations are common in virtually all regulatory regimes.
On the other hand, it is not difficult to point to regulatory success stories, instances in which law has significantly changed established business practices or played a major role in doing so. Government regulation has improved the safety of dairy and meat products (Reference Bardach and KaganBardach & Kagan 2002); banished cigarette-smoking from millions of workplaces and restaurants (Reference Kagan, Skolnick, Rabin and SugarmanKagan & Skolnick 1993); stimulated steady declines in death rates from fires, motor vehicle accidents (Reference Grabowski and MorriseyGrabowski & Morrisey 2002), and underground coal mining (Reference Lewis-Beck and AlfordLewis-Beck & Alford 1980); and reduced many serious forms of air and water pollution (Reference ScruggsScruggs 1999), even in an era of rapid economic growth (Reference EasterbrookEasterbrook 1999). Moreover, many regulated firms routinely go “beyond compliance,” taking nonlegally required actions that advance regulatory goals. Some beyond compliance actions entail “overcompliance” with regulations, whereby regulated firms build in a margin of error, much as a motorist may take care to drive 5 mph below the legal speed limit. Other beyond compliance actions advance regulatory goals in the absence of specific regulatory mandates in order to increase the firm's short-term profits or its long-term viability (Reference VogelVogel 2005; Reference Porter and Van Der LindePorter & van der Linde 1995).
Seeking to explain the variation in regulatory success and failure, one strand of sociolegal scholarship has focused on regulatory agencies, examining the importance of different regulatory designs, enforcement tools, strategies, and decisionmaking styles (Reference Ayres and BraithwaiteAyres & Braithwaite 1992; Reference Coglianese and LazerCoglianese & Lazer 2003; Reference Bardach and KaganBardach & Kagan 2002; Reference ScholzScholz 1984). Another strand has focused on business firm behavior, seeking a more complete understanding of the motivations of regulated business firms than that provided by a simple fear-of-legal-sanctions model (Reference PrakashPrakash 2000; Reference MayMay 2005; Reference Howard-GrenvilleHoward-Grenville et al. 2008). Some studies do provide empirical support for the assumption that detection of violations and legal sanctions are crucial to regulatory compliance (Reference HarrisonHarrison 1995). Using agency-generated data sets, for example, Scholz and Gray have shown that violations of occupational safety and water pollution regulations are less frequent in firms that have recently been visited by regulatory inspectors and fined for violations (Reference Scholz and GrayScholz & Gray 1990; Reference Gray and ScholzGray & Scholz 1993).
Nevertheless, compliance often appears to be much more prevalent than the fear-of-legal-sanctions model would lead one to expect (Reference Mehta and HawkinsMehta & Hawkins 1998; Reference VandenberghVandenbergh 2003:119–22). Using data on 113 paper and pulp mills in the United States, Reference Gray and ShadbegianGray and Shadbegian (2005) found that each facility was inspected for pollution violations only about once a year, on average. Yet in only 16 percent of cases was the facility found “out of compliance” with a detailed, complex, and demanding set of water pollution requirements (Reference Gray and ShadbegianGray & Shadbegian 2005:247, 250). In a study of nursing homes in Australia, Braithwaite and his colleagues found that, except for a special subset of homes, there was virtually no correlation between facilities' regulatory compliance rates and their perception of the certainty and severity of punishment for violations (Reference Braithwaite and MakkaiBraithwaite & Makkai 1991:35). Studying 16 large pulp and paper mills, we found that notwithstanding the very high capital and operating costs of controlling harmful effluents, all had “overcomplied” with regulatory requirements, reducing pollutants in their effluent to levels well below the limits set in their regulatory permits. Moreover, several mills had gone “beyond compliance” in a different sense, having invested in costly methods of reducing unpleasant odors, even though that was not required by regulation at all (Reference KaganKagan et al. 2003; Reference Gunningham, Kagan and ThorntonGunningham, Kagan, et al. 2003).
These and other studies indicate that regulated enterprises are motivated to comply with regulations, and even to go beyond literal compliance, not only by fear of legal sanctions but also by social pressures and norms. Many businesses fear the adverse publicity that can arise from regulatory violations that cause observable harms. Adverse publicity can trigger negative reactions from societal actors such as neighbors, employees, customers, regulatory advocacy groups, politicians, journalists, and investors. Those negative reactions, in turn, can result in financial losses and tarnish the reputation of the company and of individual managers. Moreover, business owners, managers, and key professional employees, like other people, are motivated in various degrees of intensity by internalized social norms, felt obligations to (1) comply with “the law,” and (2) to comply as fully as feasible with aspirational standards such as environmental protection or concern for human health (Reference MayMay 2005). In a survey of 221 business managers responsible for environmental affairs, we found that their regulation-related practices were motivated by a complex blend of fear and duty—beliefs that serious violations eventually would be detected and punished, concerns about preventing damage to corporate reputational capital, and in many cases, ostensibly sincere commitments to minimizing environmental harm (Reference ThorntonThornton et al. 2005; Reference Gunningham, Thornton and KaganGunningham, Thornton, et al. 2005).
Under what circumstances do societal pressures and businesspeoples'normative beliefs play a significant role in pushing business firms to advance values such as environmental protection? When are societal norms and pressures ineffective? Under the best of circumstances, how powerful are such motivations, as compared with economic motivations and legal factors? Our pulp mill study found that with few exceptions, firms made large, very expensive improvements in environmental performance only in response to demanding current or pending regulatory requirements—although once initiated for those reasons, firms often did more than was legally necessary (Reference Gunningham, Kagan and ThorntonGunningham, Kagan, et al. 2003). Research suggests that large firms tend to respond more positively to environmental regulation than small firms—they are more visible to, and more closely scrutinized by, regulators, consumers, and advocacy groups. They are more concerned about building and protecting their social and political reputation. Large corporations are more likely to have in-house specialists in regulatory issues, have the capacity to finance or pass on the costs of expensive pollution control equipment, develop consistent compliance records, and engage in beyond-compliance behavior (Reference Kagan, Rosenbloom and SchwartzKagan 1994:397–8; Reference Shover, Hawkins and ThomasShover et al. 1984; Reference Gunningham, Thornton and KaganGunningham, Thornton, et al. 2005; Reference Borck and CoglianeseBorck & Coglianese 2008). Yet coping with many pressing current environmental problems—such as global warming, deforestation, overfishing, nonpoint source pollution—requires cooperation not only from large corporate actors but also from a large number of small firms whose aggregate actions have important environmental impacts.
With those concerns in mind, this article reports on a research project designed to understand variation in environmental performance in small and medium-sized companies that have not been subject to a great deal of environmental regulation or oversight. Our research focused on environmental performance in the heavy-duty trucking industry in the United States. Tailpipe emissions from heavy-duty diesel-powered trucks are important sources of greenhouse gas emissions and of particulate and nitrogen oxide (NOx) emissions, which can cause or aggravate lung disease, cardiovascular disease, and cancer.
In the absence of any regulatory mandate, companies with large truck fleets and widely recognizable names and consumer reputations at stake, such as Wal-Mart, UPS, and FedEx, have taken considerable beyond compliance actions. UPS, for example, recently purchased and field-tested 50 hybrid electric delivery trucks (UPS 2007). But most of the several million trucking firms in the nation are small or medium-sized companies. They operate in a highly competitive industry, typically with very limited profit margins. Compared to manufacturing companies such as pulp mills, small trucking firms are subject to much less intense social pressures from local communities and environmental activists.
Further, while trucking companies have been subjected to tight legal and regulatory license pressures relating to truck safety, for reasons to be noted later, they have not yet been subject to demanding regulations or tight scrutiny from environmental regulators regarding truck emissions. Unlike manufacturing companies that emit pollutants, truck companies are not currently subject to national legal obligations to use the best available control technology or best management practices—that is, they are not required to use late-model, much less-polluting diesel engines; retrofit older engines with pollution control equipment; or control idling or highway speeds. Moreover, such new-model trucks can cost $150,000 (and retrofits between $10,000 and $25,000 per truck)—which makes it very expensive, especially for small firms in an intensely competitive industry, to voluntarily adopt the best available pollution control technology. For all these reasons, we speculated that studying the trucking industry would illuminate the circumstances under which societal pressures, norms concerning environmental protection, and corporate concerns about preserving reputational capital are not likely to influence firm-level environmental performance.
Some small and medium-sized trucking companies do go beyond compliance. They buy and operate expensive, new-model, less-polluting vehicles and adopt other emissions-reducing strategies. Other trucking companies, however, do not. Estimated emissions of nitrogen oxides and particulate emissions from our sample of trucking companies varied more than twenty-fold. What explains such variation in environmental performance among trucking firms? To answer that question, we concluded it was necessary to obtain firm-level emissions-related data (which is not reliably ascertainable from government databases) and also to probe the thinking and attitudes of company officials via in-person, on-site interviews. We conducted 16 case studies of small and medium-sized trucking companies located in California and Texas (states with large trucking fleets but contrasting regulatory environments).
After a brief account of the hazards associated with emissions from diesel-powered heavy-duty trucks, this article summarizes the regulatory response by the federal government and by California and Texas. The succeeding sections discuss our research methodology and then our findings, the most prominent of which is that economic factors, rather than social pressures and norms, have the largest influence on the relative environmental performance of individual trucking firms.
The implication of these findings is that social and normative pressures for better environmental performance are likely to be minimal in highly competitive industries, like trucking, that (1) have many low-visibility small firms that are not subject to demanding legal or regulatory scrutiny, and (2) cannot afford to acquire advanced environmental control technologies. In such circumstances, firm-level environmental behavior is likely to be shaped by the firms' immediate economic incentives alone. In such circumstances, moreover, politicians shy away from enacting and enforcing technology-forcing regulations or taxes because such measures could drive thousands of small firms out of business (Reference ThorntonThornton et al. 2008). In such circumstances, law ways are less likely to change business folkways.
The Environmental Problem—Truck Emissions
In 2004, 2.7 million heavy-duty trucks and 3.5 million smaller (classes 3 through 7) trucks were used for business purposes in the United States (American Trucking Association 2005:2).These trucks transport most of the goods produced in, imported to, and exported from the United States. Unfortunately, durable, fuel-efficient diesel engines also emit particulate matter (PM), NOx (a precursor to ground-level ozone), and carbon dioxide (CO2, a greenhouse gas). Of greatest concern to public health are the particles small enough to be inhaled into the deepest parts of the lung, especially ultrafine particulates, which are 2.5 microns or smaller (PM2.5). California's Air Resources Board (CARB) concluded that the estimated 900,000 diesel-powered heavy-duty trucks and the diesel-powered buses that currently operate in the state account for 30 percent of statewide emissions of NOx and 40 percent of particulate emissions each year (CARB 2008). Exposure to ozone (for which NOx is a precursor) has been linked to inflammation and decreases in lung function, aggravation of lung diseases such as asthma, and increases in hospital admissions. The California Office of Environmental Health Hazard Assessment found that diesel PM posed the highest cancer risk of any air contaminant they had evaluated, accounting for some 70 percent of the risk the average Californian faced from breathing toxic air pollutants (http://www.oehha.ca.gov/public_info/facts/dieselfacts.html; accessed 20 Feb. 2009). A large-scale study of postmenopausal women found that living in areas with high levels of fine particulates in the air substantially increased the risk of death from cardiovascular problems (Reference MillerMiller et al. 2007). Individual exposures to diesel exhaust are intensified where large numbers of trucks sit idling their engines, such as near seaports' marine terminals, highway choke points, and large truck stops (Reference MengMeng et al. 2006). CARB estimates that emissions from diesel-fueled trucks in California currently cause 4,500 excess deaths per year, although this annual impact is slowly dropping as older trucks are gradually replaced by new, cleaner vehicles (http://www.arb.ca.gov/msprog/onrdiesel/documents/truckrulehealth.pdf; accessed 18 Dec. 2008).
The Legal/Regulatory Regime
Federal Actions
Pursuant to the 1990 Clean Air Act, EPA has compelled vehicle manufacturers to meet progressively more stringent emission standards for new model year engines, ultimately requiring 2010 model year engines to reduce NOx and PM emissions more than 90 percent from diesel engines produced in the late 1980s. Moreover, diesel fuel refiners have been required to change their diesel fuel formulations to lower emissions. On the other hand, owners and operators of trucks containing older, more-polluting engines have not been compelled to buy newer, less-polluting models, or retrofit existing engines, or implement best management practices. The basic structure of the Clean Air Act, in place since 1970, allowed EPA to regulate new model year vehicles and engines but not in-use vehicles, leaving that authority with state governments. Banning or mandatory phasing out of old diesel engines would have required a fundamental revision of that regulatory structure—something that was not mentioned in any of the leading proposals or political debates surrounding the major amendments to the act in 1977 and 1990. Nor was there any prominent consideration of legislating large tax breaks or high licensing fees on older-model trucks to create incentives to retrofit or trade them in for new, less-polluting trucks. The old, dirty trucks were simply grandfathered in. And because diesel engines last for years, grandfathering meant that it will take several decades before heavily polluting pre-1990 model year engines are off the road, and still longer for moderately polluting pre-2004 model year engines.
From a political standpoint, it is not difficult to see why. A large proportion of thinly capitalized, barely profitable small trucking companies simply cannot come up with the capital costs for the best available control technology or a new model year engine, or pass the cost on to their customers. Consequently, banning old dirty diesel trucks would destroy tens of thousands of small businesses, located in virtually every congressional district. It might also result in the consolidation of ownership into a smaller number of firms that could finance the new trucks, causing higher rates and shipping costs. Consequently, Congress was not interested in facing the political storm that would come from the mandatory, rapid phasing-out of older, more polluting trucks, and neither EPA nor environmental activists sought to persuade them to do so. Best management practices to limit idling, improve maintenance, and control highway speeds were also not considered.
Instead, the federal government passed the problem on to the states. In 2002, EPA implemented regulations tightening the National Ambient Air Quality Standards (NAAQS) for PM and ozone. Failure to achieve those standards threatens states, particularly those such as California with large “nonattainment areas,” with loss of federal highway funds and pressures them to find ways to reduce diesel emissions (Reference Eisinger and NiemeierEisinger & Niemeier 2004). In addition, the federal government offers states and localities funding for plans that provide financial subsidies to vehicle owners who purchase new cleaner engines.
State Regulation of Diesel Emissions: California and Texas
The state of Texas dutifully copies federal standards with respect to diesel truck emissions. At the time we conducted fieldwork in Texas (October 2006), the state did not regulate emissions by individual truck companies. By contrast, California (May 2006)—which has very large nonattainment areas—had developed independent regulatory programs that sometimes exceeded equivalent federal programs. Pursuant to its own toxics law, California identified diesel PM as a toxic air contaminant. CARB imposed restrictions on idling on school buses and, in November 2006, on all idling of commercial heavy-duty diesel vehicles. The agency also has an aggressive program for enforcing rules requiring engine maintenance. In September 2000, CARB designated certain populations of vehicles—first transit buses, then garbage trucks, then public fleet trucks, and most recently, private trucks—for mandatory phased retrofitting or replacement of older diesel vehicles. The rules imposing such requirements on the huge fleet of commercial trucks were promulgated in December 2008, but, with the exception of drayage vehicles in seaports, will not require retrofits or new truck purchases by small truckers until 2013, and it will be 2020 before all pre-2010 model trucks must be off the road.
Company-Level Variation in Environmental Performance—Field Research Methods
As we have noted, at the time this research was done, California had legally imposed best practices (limited idling restrictions and maintenance requirements) on most private truck companies, but Texas had not, and in both locations, no private trucking companies were legally obliged to buy the best available pollution control technology—recent model year engines. Progress in reducing harmful emissions from heavy-duty diesel-powered trucks, therefore, depends largely on individual firms' willingness to engage in what regulatory scholars have labeled “beyond compliance” behavior. Our research, however, focused on smaller trucking firms that are not in the public eye, seeking to determine why some trucking firms, but not others, had purchased newer, less-polluting engines and why some, but not others, had adopted day-to-day operating practices that reduce emissions (such as introducing controls on driving speeds and idling time, or superior engine maintenance).
A Framework for Analyzing Company-Level Variation
Our conceptual framework for explaining company-level variation in environmental performance draws on the “license model,” developed in our previous research (Reference Gunningham, Kagan and ThorntonGunningham, Kagan, et al. 2003), which views facility-level environmental performance as shaped first of all by the interaction of three facets of a firm's environment: (1) its economic license (the particular market-based imperatives and constraints that firm managers face), (2) its regulatory license (specific legal obligations and threats), and (3) its social license (normative expectations of employees, advocacy groups, neighbors, and local politicians). Societal actors can enforce social license expectations directly—via dramatic protests, boycotts, and efforts to get their complaints into the news—and also by calling for tougher regulatory action, threatening lawsuits, and opposing plans for plant expansion or permit renewals (Reference Gunningham, Kagan and ThorntonGunningham, Kagan, et al. 2004). In addition, our prior research and work by other scholars (Reference Howard-GrenvilleHoward-Grenville et al. 2008; Reference PrakashPrakash 2000) provides clear evidence that these external license pressures are interpreted, filtered, and negotiated by management attitudes and commitments, which vary from indifference to environmental concerns to higher levels of environmental awareness and engagement. In our study of pulp mills, we also found that business firms' “environmental management styles” had significant effects on how firms reacted to regulatory, economic, and social pressures, and hence on how managers interpreted and weighed these elements of their “license to operate.” We also found that facility-level environmental management style significantly affected the mill's relative environmental performance.
Applying this framework to trucking firms, we found, is complicated by the number of technical factors (and related company policy decisions) that affect each truck's (or fleet of trucks') environmental performance. Regulators' models of environmental performance posit that in broad terms, a trucking company's environmental performance (average emissions of NOx and PM) is shaped by six basic factors: (1) the type of fuel used (regular diesel, specially formulated “clean diesel,” or natural gas); (2) the age-distribution of the company's fleet (in terms of model year engine); (3) the quality of its maintenance program; (4) the average speed at which its trucks travel (which is significantly affected by the average time on highways versus city streets, and by electronic controls or strong policies that govern maximum speeds); (5) the amount of time its trucks, on average, spend idling (which can be reduced by a variety of technologies, tactics, and policies);Footnote 1 and (6) the number of miles its trucks travel.
Thus we conceptualized the six above-listed technical factors and operating policies as decisive in affecting firm environmental performance vis-à-vis truck emissions. We posited that the six technical/company policy factors are affected by the relative “tightness” of each firm's economic license, its regulatory license, and its social license, recognizing that those license terms may be filtered through company attitudes and policies. With that model in mind, we studied 16 small and medium-small trucking companies, focusing closely in each case on the relationship between the external license factors and the six intervening emissions-affecting variables.
Sampling Companies for Intensive Study
To obtain adequate data on environmental actions and motivations of individual companies, our research strategy was to conduct in-depth interviews with trucking company officials, in their offices. Due to this labor-intensive research strategy, our sample of firms to be interviewed was limited to 16—a sample size that may weaken the external validity of certain findings but increases the internal reliability of our report and is large enough to illuminate key points of behavioral variation and motivation within the industry.
We decided to select eight small and medium-sized firms headquartered in California and eight in Texas, which we hypothesized would provide some variation in social license pressures and in regulatory environment. Further, to ensure variation in company size and performance, we constructed a stratified sampling frame based on two variables: (1) company size (as measured by number of trucks), and (2) a rough proxy for company environmental performance. We defined “small” firms as having 7 to 27 trucks, and “large” as having 60 to 450 (although in the trucking industry context, firms with 60–450 trucks could more accurately be characterized as medium-sized enterprises). In Texas, Department of Motor Vehicles data enabled us to use average fleet age as a proxy indicator for environmental performance. In California, where comparable data were not available, we used company safety records as a proxy for environmental performance (for the purpose of sampling only). Based on prior research, we reasoned that management effort in promoting safety was a reasonable predictor of company environmental management style.
Based on this data, we grouped all trucking companies registered in California and Texas into four types: small/good proxy environmental score; large/good environmental score; small/mediocre environmental proxy score; large/mediocre environmental score). For each group, we selected a subgroup based on location—for California, the Los Angeles Basin and the Central Valley, and for Texas, the Houston-Galveston area and the Rio Grande Valley. We then telephoned companies at random until we gained the cooperation of four firms in each group. Refusals to cooperate were invariably based on the claim that the relevant company official simply could not afford to take time for an interview. Once in the field, we found that the proxy data used to group companies in terms of environmental performance were significantly out of date with respect to both company size and environmental performance proxy. We therefore compared companies based on the actual environmental performance data we collected and geographic location. We recruited 8 California companies: 4 large (44 to 363 trucks), 4 small (4 to 27 trucks), and 8 Texas companies: 6 large (77 to 193 trucks) and 2 small (10 and 11 trucks). Interviews ranged from 1 to 2.5 hours, typically lasting about an hour. Interviews in California and Texas were conducted in May and October 2006, respectively.
Information Sought
Because so many trucking firm choices that affect environmental performance also affect fuel economy, we asked participants how important fuel efficiency was to their company and asked them to describe specific policies or practices they had put in place in order to improve fuel economy. We asked participants how the company went about buying trucks, e.g., what criteria they considered when purchasing a truck. In order to assess general awareness of the trucking industries' environmental and health impacts, we asked participants what they saw as the industry's environmental and health impacts and how they had changed over time. We asked the company officials about the most important environmental regulations they operated under and the government regulations that had the biggest impact on the company. We asked about the most important constraints they experienced in improving their environmental performance, and the role (if any) that government subsidies had played in the company. We asked about their prior experience with environmental and safety regulators, and what role community groups and environmental groups had played in the life of the company.
In order to create a more precise estimate of company-level environmental performance, during our interviews with trucking company representatives we obtained detailed data on the age distribution of their truck fleet, the fuel they used (regular diesel, low-emissions diesel, or alternative), their maintenance practices, the amount of time their trucks idled, the policies the company had in place to decrease idling times, the miles per years their trucks traveled, the speed at which their trucks were electronically governed (or other policies the company had in place to influence truck speed), technologies the company had considered and/or adopted that would impact fuel efficiency and idling, and the average fuel economy of the fleet (miles per gallon).
We also asked the representatives to rate, separately, their own environmental and economic performance on a scale of 1 (worse than average) to 5 (excellent). All the firms we interviewed were privately held companies whose financial statements are not available. Hence self-assessment of economic performance, stated in rough categories, was the best available indicator of firms' financial condition and profitability. On this and some other issues, we had to rely on respondents' candor, although we cannot be sure that all respondents interpreted items that used a 1–5 scale in the same way.
For several reasons, our confidence in our respondents' candor was rather high. We promised company officials anonymity. Since they are not publicly traded companies, incentives to be untruthful were further diminished. In addition, one of us had prior experience working in the trucking industry, and by the time of the field research, we had accumulated sufficient knowledge about the environmental, technical, and financial issues companies faced (via interviews with regulators, pilot interviews with trucking officials, and reading extensive published material) to couch our questions very specifically and ask very specific follow-up questions that drew upon responses by other firms.
For example, we began interviews with inquiries about how the firm had improved or was unable to improve fuel efficiency (a topic very salient to most trucking companies, then struggling with historically very high diesel fuel costs). We could then relate their answers to environmental issues. For example, if a participant responded by saying that the company's trucks travelled long distances but, in answer to a separate question reported that its fleet had low idling times, we asked how they avoided overnight idling on long-haul trips. If a firm reported low idling times, we would inquire as to specific practices the company used to reduce idling. Similarly, the self-reported average “miles per gallon” of the fleet was triangulated with other answers to questions known to impact fuel efficiency. Larger firms referred to documentation when giving us age distributions of their fleets. Smaller fleets simply reported the age of their trucks. Since we could often see the trucks on the yard, we could tell if they were older or newer, though not the precise model year.
Research Findings
Environmental Performance by Company
The information gathered in these interviews is summarized in Table 1, which shows for each sampled enterprise (1) company economic characteristics, (2) its score on each of the six emissions-affecting operating factors, and (3) its environmental performance scores, based on our estimate of its total NOx and PM emissions and its fuel economy ranking. Companies are identified by number and nickname, and the table is sorted by average rank on the environmental performance indicators. The measures of environmental performance used and the average rank measure are described in the Appendix. For each of the operating factors, company scores associated with lower emissions are italicized. Scores associated with worse emissions are written in boldface.
Table 1. Company Economic Characteristics, Emissions-Affecting Operating Characteristics, and Environmental Performance

1 Numbers reported reflect only the diesel portion of the fleet (about a third of the fleet is alternatively fueled).
2 Does market niche encourage younger fleets and better maintenance?
3 Percent of a fleet with model year 1997 and older.
4 Percent of fleet with model year 2003 or newer.
Notes: Total NOx (100K) per truck=Total emissions per truck for a 100,000-mile year (onroad average g/mile × 100,000 miles per year+idling emissions) compares environmental performance for a standardized annual mileage, so that long-haul companies with high average annual mileage are not penalized in the performance measure. Italicized cells indicate scores associated with lower emissions. Scores in bold type are associated with higher emissions.
Only one participating company (16, nicknamed “Alternative”) used any alternatively fueled heavy-duty trucks as opposed to diesel-powered trucks. A company's maintenance program was rated excellent if preventive maintenance programs were highly emphasized, if maintenance procedures above and beyond those required for warranty purposes were described, and if companies saw excellent maintenance as an integral part of doing business. Otherwise the company's maintenance program was rated average. All miles for a California company (as identified by registration) were assumed to use California fuel formulations and hence entail lower emissions. The maximum speed at which a company's trucks were electronically governed, or the speed at which they were said to cruise on the highways, was also reported.Footnote 2 Idling was described as low (10 hours per week or less) or high (25 hours per week or more). The number of miles traveled per truck per year was described as average (100,000 miles), low, or high.
Emissions of NOx and PM varied among firms by orders of magnitude (see Table 1). This variation depended on the six operating factors that affect emissions levels. However, the relationship between environmental performance and the six operating factors was complicated. Moving from the lowest to the highest ranked average environmental performance in Table 1, the highest ranked companies had more of the operating characteristics associated with lower emissions and fewer scores associated with worse emissions. However, the precise combination of emissions-affecting operating characteristics varied for each company, and companies that ranked high on some characteristics were average or low on others. Thus companies that go beyond compliance with respect to vehicle age are not always among the best environmental performers (see the companies “Cross,”“Struggling,” and “Security”).
Explaining Firm-Level Variation in Environmental Performance
This section discusses the impact of various strands of the license to operate on the intervening “operating” variables, and thus on company-level environmental performance. Overall, it shows that state-level regulations impact all the emissions-affecting operating characteristics, but less profoundly than does each firm's particular “economic license.” Economic incentives are the chief driver of trucking companies' choice of alternative versus diesel fuel, the age-distribution of their fleets, their maintenance practices (to a limited extent), highway speed, and idling practices (again to a limited extent). And social license pressures have little if any effect.
Regulatory License and Firm-Level Environmental Performance
State policies can affect all the determinants of truck company environmental performance. State law, for example, determines the availability and environmental characteristics of both alternative fuels and specialty diesel formulations. California's low-sulfur diesel formulation was available earlier and more widely, and has a greater positive environmental impact, than the federal low-sulfur diesel formulation used in Texas. Trucking companies are also affected by state laws unrelated to environmental protection: labor laws, workers' compensation costs and requirements, vehicle registration fees, etc.—all of which are more demanding in California. The resulting higher cost of doing business in California might have slowed down turnover of the truck fleet in California, which in the aggregate is older (hence marginally more polluting) than the Texas-registered truck fleet, according to databases assembled by both state departments of motor vehicles.
California also has more restrictive speed limits than Texas,Footnote 3 which, along with higher fuel costs, may help explain why the average governing speed of the California firms in our sample is considerably lower than for our Texas companies; this should have an emission-reducing effect for California firms. Moreover, California more aggressively enforces regulations requiring regular truck maintenance to reduce excessive diesel emissions,Footnote 4 and California also has enacted anti-idling regulations—although the impact of the latter at the time of our study was limited.Footnote 5
All in all, however, our interviews and company-level data suggest that as compared to the market-based operating factors discussed below, the state of registration has had a relatively small effect in shaping the environmental performance of the firms in our sample.
Social License and Environmental Performance
The low level of environmental consciousness among the trucking firm managers we interviewed is one important indicator that the firms did not face intense social license pressures. The truckers knew that oil spills and diesel emissions are “bad for the environment” in general, but by and large, they had little specific knowledge of the pollutants of concern and their adverse health impacts. Only two of the 16 company representatives mentioned respiratory illness, and only one mentioned cancer. A third of the companies had no significant knowledge of their vehicles' environmental impacts. Typical responses among this group to the question of what the environmental or health impacts of the trucking industry are shown below.
Oil or diesel spillage. [Anything else?] Maybe a tire blows up and leaves the rubber on the road.
Nothing comes to mind. The length of time drivers drive—driving can be a difficult task. Also idling—all our exhaust is routed away from the berthing, but there could be leaks.
On the other hand, all company officials that did have general environmental knowledge also had specific knowledge about the links between their operational practices and their emissions. Among this group, the following response to the question of environmental and health impacts is typical:
Pollution, exhaust, and idling. The figures speak for themselves. Where there is no place for the drivers to park and they are just sitting waiting to get out of the docks in 92-degree heat they need to keep their air conditioning on. This causes emissions. With the recirculation, the efficiency of engines will drop. There will be too much pressure to come up with alternative technology [e.g., tailpipe filters for PM], but will it work? The [2007 model year] engine is cadmium plated steel. It won't resist corrosion and water will get in and the result may be to blow the engine. I don't think the 2007 engines will last the way they think. The technology—you have this big canister that you empty out every 200,000 miles. But the extra weight reduces efficiency. If they want new technology why don't they consider electric brakes which would get rid of the air compressor which is very heavy?
Another indicator of weak social license pressures is that none of the companies in our sample had had any experience of being individually targeted by community members, community groups, or environmental groups concerning their environmental impacts or practices. The complaints they received were generally about noise, or trucks throwing up stones and breaking windshields.
Trucking companies have been affected by organized and sustained social pressures at the Ports of Los Angeles and Long Beach, where hundreds of older trucks often sit idling, but the protests have been directed largely at the Ports rather than directly at the trucking companies. Although serious pressure began mounting in the late 1980s, the Ports did not draft proposed rules for reducing emissions until May 2006; the resulting ban on 1989 and older trucks on Port property came into effect only on October 1, 2008, as Port officials realized that due to opposition by local and national environmental groups, any further Port expansions would require addressing truck emissions (Los Angeles Times, 2 Nov. 2007, p. B1).Footnote 6
Economic License and Environmental Performance
Economic license pressures on trucking companies operate on three levels: (1) the general market—how well the economy is doing, the price of fuel, and the price of labor where the company operates; (2) the particular firm's market niche—the kinds of goods that are being hauled, for what distances, and specific customer demands; and (3) company-level financial condition. Table 2 summarizes the general direction in which these three sets of economic constraints affect trucking companies' fleets and their emissions.
Table 2. The Impact of Economic License Pressures on Company-Level Fleet Characteristics That Determine Truck Fleet Emissions
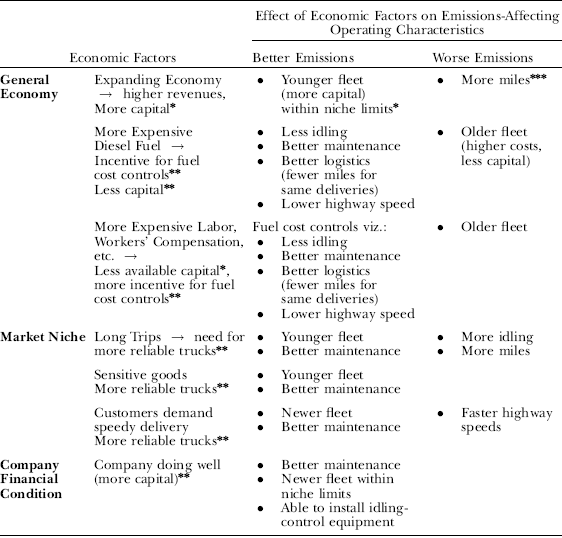
* based on inference;
** based on interview evidence;
*** based on literature.
Table 2 shows that most economic factors have both positive and negative effects on emissions. Moreover, it is difficult to estimate the net effect of each factor, particularly at the level of individual firm emissions. Each company's “scores” on the sets of economic license factors are shown in Table 1. A company's individual financial condition score reflected its self-rated company economic performance. If the company's market niche encouraged trucking firms to purchase a younger fleet and institute better maintenance practices, then a “yes” was entered into the niche column. State of registration was used as a proxy for the general economy in which the company operates; California generally has more expensive fuel, labor, workers' compensation, and other costs than Texas. But because of the large number of operating factors affecting firm-level emissions and the small size of the sample, the impact of each of the economic variables is unclear and probably not decisive. The following subsections explore how each strand of the economic license affects firm-level variation in various operating characteristics and environmental performance. Since incentives created by economic factors were such prominent influences overall, it is important to “unpack” precisely which elements of the economic environment mattered most, and why.
Economic License Pressures and Fuel Choice. Only one company participating in our study (“Alternative”) used alternatively fueled (natural gas) heavy-duty trucks. Another (“Tulane”) had seriously looked into the idea, but rejected it due to several reliability and other operating concerns. All other companies had quickly dismissed alternatively fueled vehicles as economically infeasible. Alternative's owner had invested in alternatively fueled trucks and an onsite fueling station both because of his environmental beliefs and because a government/environment consortium that was trying to increase the number of alternative fueling stations available in California had funded 50 percent of the station. More recently, however, Alternative, while committed to the technology, had been unable to update its alternative fleet because truck manufacturing companies have stopped making heavy-duty alternative-fuel truck engines, as their engineering resources have gone toward meeting the new diesel engine standards and toward the larger alternative-fuel bus market.
In terms of diesel fuel formulation, all companies bought the cheapest fuel it was legal for them to purchase. Thus California companies bought California's cleaner diesel more often than Texas companies. None of our participating Texas companies had made use of Texas's incentive program to subsidize the cost of buying diesel fuel. Thus whereas regulatory factors determined the distribution of cleaner diesel fuel formulations—statewide in California and in very limited distribution in Texas—economic license pressures led companies to avoid the more expensive, cleaner diesel whenever it was feasible and legal to do so.
Economic License Pressures (Market Niche) and Fleet Age Distribution. The age distribution of trucking companies' fleets is dominated by the market niche in which the company operates. In our sample, there was a strong and significant correlation (0.7, p=0.0026) between (1) the percentage of company trips that were long-haul, and (2) the percentage of the company's fleet with engine model years of 2003 or later. If a firm regularly participates in the long-haul market, en route breakdowns are especially costly because the load still has to be taken care of, the truck itself hauled to a repair shop, and non-contract maintenance services employed. The same economic incentives operate for truckers engaged in the transportation of goods that will deteriorate if en route breakdowns occur.
Economic License and Idling. While longer trips drive trucking companies toward quicker vehicle turnover and newer vehicles, longer trips also push long-haul companies to longer idling times, as drivers sleep in the tractors at night and keep the engine idling to power air conditioning, heating, television, and other accessories. In addition, safety regulations require drivers to rest after specified numbers of hours on the road, and during such rest times engines are often left to idle. Thus in our sample, the length of trip in days was associated with higher idling (and hence higher emissions). But there were notable exceptions. The company “Police” had low idling numbers despite the fact that 50 percent of its trips were long (14 days) haul. The company purchased a prepaid subscription for a network of truck stops that provide high-speed Internet, phone, television, air conditioning, and heating for $23/day. Police also installed alternative power units in a number of its trucks because it delivered in California (where lengthy idling from the main engine was about to be outlawed, in November 2006). Other companies, however, could not afford the initial capital expenditure for costly (and heavy) alternative power units, or could not find enough specially equipped truck stops on their routes.
Economic License and Maintenance Practices, Highway Speeds, and Fuel Economy. Good preventive maintenance entails immediate direct and opportunity costs, but it reduces harmful emissions by sustaining efficient combustion. However, that was not the salient goal of the firms in our study that had excellent preventive maintenance programs. Their motives were wholly to reduce fuel costs, or to increase reliability in market niches that demanded it, or to extend the longevity of their older vehicles (which increases emissions by postponing the purchase of new model trucks).
Similarly, for most companies that had electronic governing systems to ensure lower highway speeds, the goal was not to improve environmental emissions (which lower speeds do) but to improve fuel economy. Indeed, for some companies, ontime delivery was more important to the company than the added fuel savings, and in those cases, vehicles were governed at higher speeds. Fuel costs in California are considerably higher than in Texas. The average price of diesel in 2006 was $2.92 in California and $2.64 along the Gulf Coast. Not surprisingly, governing speeds in California were lower than in Texas, and lowest among those companies with an excellent maintenance program.Footnote 7
For similar reasons, the fuel economy of the California participants was considerably better than that of our Texas participants. Interestingly, when we calculated the average transportation cost ($ per mile) for our Texas and California companies, we found that transportation costs were almost identical (49 cents per mile in California versus 48 cents per mile in Texas). It seems likely that the higher market price of diesel in California induces California companies to work harder to improve their fuel efficiency. In this respect, regulation, by mandating “cleaner” and more expensive fuel, combined with economic license pressure to shape environmental outcomes.On the other hand, while similar economic incentives applied to all companies—improved maintenance improves fuel economy, lower speeds improve fuel economy—other economic factors sometimes trumped these for some truckers. In still other cases, companies did not have the management or technical sophistication to implement these programs.
The Effect of Size and Profitability on Environmental Performance. Some companies in our sample that rated their financial condition as “excellent” were only middling environmental performers. Similarly, when we used state of registration as a proxy for the constraints imposed by the “general economy,” we found that some companies in each state were excellent environmental performers and others were weak performers. Similarly, although some market niches, as noted above, encouraged younger fleets and better maintenance, we found that the “market niche” variable was not consistently associated with better overall environmental performance.
All the companies in our sample with more than 100 vehicles described their economic performance as “doing well” or “excellent.” Only half the companies with fewer than 100 trucks made the same claim. Larger companies tend to have a higher proportion of modern (2003+) vehicles than do smaller companies (although Cross and Struggling, two very small companies engaged in nationwide, long-long-haul transportation, had newer trucks). In general, therefore, it appears that size is an important factor in enabling companies to acquire the capital necessary to turn over their fleets—and thereby reduce emissions. On the other hand, fleet size and economic performance do not appear to be related to highway speed, mileage, idle time, or maintenance practices.
Smallness, Competition, Regulation, and Environmental Behavior
At the time of our field research in 2006, diesel engine manufacturers had long been subject to technology-forcing regulations that demanded progressive reductions of hazardous particulate and NOx emissions from new-model heavy-duty trucks. Individual trucking firms, however, were not required by law to use “best available technologies” or to employ other emissions-reducing best management practices, such as controlling idling or reducing driving speeds. Nevertheless, some of the small or medium-sized trucking firms in our sample did so. Others did not. That variation in environmental performance, our data showed, was explained primarily by aspects of each firm's economic license, and not by variation in regulation or social license pressures. In terms of influencing environmental performance, the most significant aspect of a trucking firm's economic license was its particular market niche—the kinds of goods hauled, how far, and what service and price package its customers wanted most. A firm's market niche influenced, among other things, a trucking firm's inclination to purchase new model year trucks, which are very expensive but by and large are more reliable.
More generally, these findings show that differences in environmental performance among firms in the same industry are often influenced by subtle differences in the operational demands of various market niches. Attention to those market niche differences, industry by industry, and within each industry, is important both for understanding business response to regulatory norms and for crafting regulatory designs that are sensitive to the complex range of economic incentives that business firms face.
Cross-state differences in environmental regulations and business law (tax and labor law, for example) did affect the general market conditions that trucking companies faced, making operating costs and diesel fuel costs higher in California. But there was too little variation in individual firms' direct regulatory licenses in our sample to produce a discernible impact on environmental performance.Footnote 8 Nor did social pressures or managers' commitment to environmental norms compel firms to buy newer model engines, control idling, or take other actions to reduce emissions. Officials in these small- or medium-sized companies were not particularly knowledgeable about the adverse consequences of diesel emissions. Their firms had not been targeted by environmental activists or the mass media. And they had not been pressured by customers to take emissions-reducing actions.
Despite the lack of regulatory mandates and social pressures, it should be emphasized that quite a few small truck companies had bought new, greener trucks or engines, or had developed practices to greatly reducing idling. But for these small companies, such beyond compliance actions were stimulated only by economic incentives, rather than by a managerial or cultural commitment to being a good environmental citizen or to improving environmental reputation and performance. And perhaps because these beyond compliance actions were driven by specific economic incentives, the relationship between beyond compliance behavior and overall environmental performance is not tightly coupled. For example, firms with newer beyond compliance truck fleets are not always the best environmental performers (often because they idle more). By contrast, in the pulp and paper manufacturing industry, we found that firms' beyond compliance behavior stemmed from a more general commitment to reputational enhancement or to good citizenship, and that those firms' actions were more coordinated so as to improve overall environmental performance (Reference Gunningham, Kagan and ThorntonGunningham, Kagan, et al. 2003).
Reflecting on this contrast between the trucking and pulp mill stories raises and enables us to explore two broad issues. First, in explaining company-level environmental behavior, and particularly willingness to engage in beyond compliance behavior, a number of variables related to industry structure are important: size of firms, number of firms, competitiveness, average firm capacity to finance harm-reducing technologies, and capacity to coordinate price increases that pass on to customers the costs of expensive or efficiency-reducing technologies. But what is the relative importance of each factor? Second, how important are official regulatory standards and the publicity that attends regulatory regimes in generating social and normative pressures for compliance and beyond compliance behavior by business firms?
The Role of Industry Structure
The pulp and paper companies we studied were large firms, in a highly competitive market; most engaged in beyond compliance behavior, in varying degrees. Truck companies operate in an intensely competitive market populated by many small firms, yet there too, some beyond compliance behavior is common. Since both some large and some small firms take beyond compliance environmental actions, it is clear that such behavior is not driven simply by the size of the firm. Moreover, intense competition, far from discouraging environmental improvement, pushes both small and large companies to search for money-saving or money-making opportunities, some of which may improve environmental performance.
Large and small companies differ, however, in the degree of scrutiny they experience and the resources they have available, which affects the incidence, magnitude, and nature of beyond compliance behavior. As the pulp study showed, many larger companies, particularly their environmental staff, tend to scan their environment for “win-wins”—investments or measures that both improve environmental performance and save (or make) money. Small companies, the trucking study indicated, scan for economic “wins” alone, at least in the absence of regulatory mandates. Large firms often are more closely scrutinized by politicians, news media, investors, other companies, and environmental actors. They fear the adverse publicity that often follows in the wake of obvious environmental failures. Hence it is riskier for them to search for economic wins alone.
In addition, large firms' greater financial resources enable them to afford the initial cost of fairly expensive win-wins. Small firms in very competitive markets often cannot finance such investments. One of the small truckers we studied, for example, had determined that installing a ∼$6,000 auxiliary power unit on a truck would save enough fuel in reduced idling time to pay for itself within 18 months. However, he could not afford such a unit's upfront capital costs, and the added weight of the unit would have reduced the size of the load he could carry.
In this regard, the absence of direct governmental regulations requiring all firms to reduce idling time may have been crucial. Regulation implicitly promises that all firms will have to comply with a demanding rule. This increases the odds (although it does not guarantee) that investments in environmental improvements can be “financed” by semi-coordinated price increases, enabling most firms to pass compliance costs on to their customers. We saw that dynamic at work in the pulp industry, where regulation drove all the companies we studied to make multimillion-dollar investments in reduction of elemental chlorine in their effluent (Reference Gunningham, Kagan and ThorntonGunningham, Kagan, et al. 2003). But those companies were large, and the number of pulp mills is relatively small.
Moreover, even if regulatory mandates are present, size still matters. In the trucking industry, if government required wholesale, rapid upgrading to new-model diesel engines, hundreds of thousands of thinly capitalized firms would find it extremely difficult to comply, because they could not afford the upfront capital costs. Evasion, huge numbers of bankruptcies, or political resistance would be likely, absent a massively expensive subsidy program. Not surprisingly, therefore, when policy makers confront markets like trucking, with a great many small firms that cannot afford the necessary compliance measures, governments tend to delay regulation. They grandfather in existing technologies for significant periods of time. Although new truck engines were subjected to demanding regulation in the 1990s, even in California, where regulatory officials and social pressures for emissions reduction are most aggressive, governments did not enact demanding regulations requiring modernization of private onroad truck fleets until December 2008. And even then, the rules provided a substantial lead time, except for port drayage trucks, for which a special source of subsidies could be tapped.
The overall message, therefore, is that in small-firm, highly competitive markets, one cannot expect social norms and pressures to push firms to accelerate their movement in beyond compliance directions, unless those firms' economic licenses induce them to do so. And in just such markets, politicians may shy away from enacting demanding regulatory requirements (Reference ThorntonThornton et al. 2008).
Regulatory Standards and Social License Pressures
This study confirms our initial speculation that social license pressures for environmental performance are likely to be minimal in industries that include many low-visibility smaller firms that are not subject to demanding legal or regulatory scrutiny. In such circumstances, environmental behavior, particularly if environmental measures entail high initial costs, is likely to be shaped by the firms' immediate economic incentives.
This does not imply that social license pressures will never matter for small firms. One can imagine that trucking firms would have higher levels of environmental consciousness, and that they would work harder to reduce harmful diesel emissions as an end in itself, if trucking terminals and traffic chokepoints such as ports were regularly picketed by environmental groups, if highway billboards linked children with asthma to diesel trucks, and if news media regularly reported on the aggregate adverse health effects of diesel emissions. Explaining why some environmental harms but not others are subject to a great deal of social attention is beyond the scope of this article. But comparing the pulp mill and trucking industry studies, along with other research, suggests that for several reasons, social license pressures and managerial commitment to environmental goals are likely to be much more prominent when business firms also face demanding regulatory legal requirements.
First, regulatory rules and scrutiny give employees, neighbors, advocacy groups, and news media a clear and authoritative benchmark for criticizing company environmental behavior. The pulp mill managers we interviewed were concerned that local communities would refer to regulatory violations in public hearings required by any planned expansion of the mill and by periodic permit renewals. Many regulatory regimes require companies to measure and report their emissions, enabling journalists and activist groups to publish comparative environmental scorecards (Reference Gunningham, Kagan and ThorntonGunningham, Kagan, et al. 2003).
Second, regulatory rules and scrutiny raise the consciousness of regulated enterprise officials and employees about the social purposes and norms that underlie the regulatory requirements. For example, Reference Johnston, Coglianese and NashJohnston (2006) found substantial evidence that environmental performance among electroplaters—an industry with thousands of small low-visibility firms operating on thin profit margins due to foreign competition—had been vastly improved by direct governmental regulation. “Command and control regulation,” Johnston wrote, “had driven metal finishers to either dramatically improve their environmental performance, or else shut down.” (2006:168). Similarly, Reference Gunningham, Thornton and KaganGunningham, Thornton, et al. (2005:312) reported that electroplaters they interviewed generally believed that “If you violate the regulations, you will eventually get caught, the penalty could put you out of business, and resistance is futile.”Reference Gunningham, Thornton and KaganGunningham, Thornton, et al. concluded that “sustained inspection and enforcement activity seems to have inculcated a ‘culture of compliance’” (2005:312).
The trucking industry has a similar history with respect to maintenance operations, which have received a good deal of scrutiny as a consequence of hazardous waste laws and their impact on real estate values. Phase I Site Assessments of real estate, usually required by mortgage lenders, treat onsite vehicle maintenance operations as a source of potential hazardous waste contamination, which can reduce the value of the property enormously. Consequently, in order to meet lease agreement requirements, or in order to ensure the continued value of the property, truck maintenance operations have vastly improved over the last 30 years, thereby improving environmental performance. Nowadays, many firms do not conduct any onsite maintenance. Those that do no longer dump used oil and other wastes in sumps that simply drain to the ground and groundwater. Instead, as required by law, wastes are carefully recycled or disposed of. Every mechanic we spoke to at truck companies with maintenance operations described how dramatically maintenance practices had improved.
Finally, regulatory rules and scrutiny can generate publicity and raise the consciousness of the general public about the social problem the rules are designed to address. This can increase social activism to address the problem and increase the social license pressures experienced by an industry and its member companies.
Conclusion
The research we report regarding control of emissions from heavy-duty diesel trucks indicates that in the absence of regulatory requirements, small low-visibility firms tend to take economic actions (including some that improve environmental performance) without regard to their environmental impact. Put another way, environmental concerns are unlikely to enter into the economic, social, or normative calculus of small businesses unless they are subject to regulatory regimes that induce significant fear of punishment for noncompliance—and thereby assure firms that not only they but their competitors will be compelled to invest in compliance (Reference ThorntonThornton et al. 2005). Moreover, in highly competitive markets populated by small firms, a majority of firms are not likely to invest in beyond compliance environmental measures in the absence of economic pressures or regulatory regimes and rules that raise firms' environmental awareness and intensify public concern about the social costs of the industry's environmental impacts.
Appendix
Using data obtained from interviews and from California's EMFAC 2007 model, we initially calculated five measures of each company's environmental performance. EMFAC is the EMission FACtors model developed by CARB and used to calculate emission rates from onroad heavy-duty trucks that operate on highways, freeways, and local roads in California. EMFAC 2007 is the most recent version of this model. From EMFAC 2007 documentation, we obtained the following estimates:
• zero-mile (new vehicle) emissions rates in grams per mile for each model year
• deterioration rates over time—the amount of additional grams/mile emitted for each 10,000 miles added to the engine
• the influence of fuel formulation on emissions rates
• the influence of highway speed on emissions rates for each model year
• idle emissions rates in grams per hour
We assumed that a truck spent 80 percent of its miles at highway speeds for long-haul trips, and 50 percent of its time at highway speeds for short-haul trips.
Measures of environmental performance:
1 Total NOx (100K). Total emissions per truck for a 100,000-mile year (onroad average grams/mile × 100,000 miles per year+idling emissions) compares environmental performance for a standardized annual mileage, so that long-haul companies with high average annual mileage are not penalized in the performance measure.
2 Total PM (100K). Total emissions per truck for a 100,000-mile year (onroad average grams/mile × 100,000 miles per year+idling emissions) compares environmental performance for a standardized annual mileage, so that long-haul companies with high average annual mileage are not penalized in the performance measure.
3 Fuel economy (miles per gallon), which can be thought of as a proxy for CO2 (a greenhouse gas) emissions.Footnote 9
Table 1 shows company characteristics and the determinants of environmental performance for each of our subject companies. In addition, the rank of each company for each environmental performance outcome measure is shown (best performer=1, worst performer=16). The table is sorted by the average rank. There is tremendous variation at a company level in environmental impact: the best environmental performers can have emissions 20 times lower for NOx and 70 times lower for PM than the worst environmental performers. However, this average rank measure obscures the lack of correspondence between the three measures. Correlation rates vary from 0.44 between NOx and PM to a low of 0.23 between PM and Fuel Economy.


