


Malnutrition is a range of deficiency states, from mild to severe, defined as a range of pathological conditions arising from coincident deficiency of protein and energy content in varying proportions, being a prevalent clinical condition in many hospitalised patients( Reference Oshikoya, Sammons and Choonara 1 ). It is estimated that 50 % of adult patients admitted to hospitals have malnutrition, making it one of the most prevalent comorbidities in this population( Reference da Silva Fink, Daniel de Mello and Daniel de Mello 2 ). Malnutrition derives from clinical, social and cultural factors, and its association with higher morbidity and mortality rates, longer length of stay and higher hospital costs has been widely demonstrated in the literature( Reference Correia and Waitzberg 3 – Reference Lim, Lee and Chan 5 ).
Individuals with protein–energy undernutrition have both reduced adipose and lean tissue, reductions in cardiac output with reduced hepatic blood flow and glomerular filtration rate( Reference Chesney, Han and Patters 6 ). Considering the wide range of pathophysiological derangements in patients with undernutrition (UN), the pharmacokinetics of many of the drugs used for their treatment is likely to be affected, which may require dose modifications( Reference Lazzerini and Tickell 7 – Reference Lykke, Hother and Hansen 9 ).
Taurine (2-aminoethylsulphonic acid) is a conditionally essential sulphur-amino acid. A balanced diet provides most taurine either directly or by synthesis in the liver and brain from methionine or cysteine in the presence of vitamin B6. This amino acid is eliminated in urine. As it can be formed in vivo from the metabolism of other sulphur-containing nutrients, its excretion may exceed the daily dietary intake( Reference Sved, Godsey and Ledyard 10 ). In pathophysiological status, the endogenous production of taurine from its precursors is limited and the excretion can be incremented( Reference Chiarla, Giovannini and Siegel 11 ), and thus the intake of taurine should be increased to maintain physiological levels.
Taurine is involved in numerous biological and physiological processes, including the regulation of the osmotic balance. Taurine participates, for instance, in bile acid formation and neuronal development, as well as function( Reference Li, Gao and Liu 12 ). It exerts antioxidant and anti-inflammatory actions, as well as anti-arrhythmic/ionotropic/chronotropic ones, besides constituting a central nervous system neuromodulator. The positive effects of taurine on thyroid dysfunction and renal oxidative damage( Reference Adedara, Ojuade and Olabiyi 13 ), epilepsy( Reference Oja and Saransaari 14 ), ischaemia( Reference Sukhotnik, Aranovich and Ben Shahar 15 ), obesity( Reference Murakami 16 ), hypercholesterolaemia( Reference Murakami, Fujita and Nakamura 17 ), diabetes( Reference Ito, Yoshikawa and Ito 18 ), hypertension( Reference Rosca, Stoian and Badiu 19 ), myocardial infarction( Reference Yang, Han and Chen 20 ), hepatic inflammatory diseases( Reference Abdel-Moneim, Al-Kahtani and El-Kersh 21 ) and neurotoxicity( Reference Ananchaipatana-Auitragoon, Ananchaipatana-Auitragoon and Siripornpanich 22 ) have also been reported. Hence, taurine is widely used as a nutriceutic and it is occasionally used as a drug.
Thus far, little is known about the pharmacokinetics of taurine after oral administration. Such information is essential if a regimen for administration of this agent as a nutraceutic in enteral diets or as therapeutic substance is designed – for example in treating the adverse effects of nickel in the nervous system( Reference Xu, He and Zhong 23 ) or after paracetamol poisoning( Reference Das, Ghosh and Manna 24 , Reference Acharya and Lau-Cam 25 ). A review of the literature revealed only very few reports concerning the pharmacokinetics of taurine. One study performed by Rakotoambinina et al. was carried out using a constant intravenous (IV) infusion of labelled taurine at rates of either 2 or 3 μmol/kg per h with or without a priming dose in six healthy patients( Reference Rakotoambinina, Marks and Badran 26 ), and in another study by Ghandforoush-Sattari et al.( Reference Ghandforoush-Sattari, Mashayekhi and Krishna 27 ) 4 g of taurine was orally administered to eight healthy volunteers. Only scarce information was found on oral administration of taurine in undernutrition( Reference Batista, da Silva and Amaral 28 ), and no records were found about taurine pharmacokinetics in malnutrition.
The present study was undertaken to determine the preclinical pharmacokinetic model of taurine after oral and intravenous administration and to investigate the influence of nutritional status on the pharmacokinetics of this amino acid.
Methods
Protocol, animals and experimental procedures
Male Wistar rats were used in accordance with 2010/63/EU directive of 22 September 2010 regarding the protection of animals used for scientific experimentation. All the assays described in the present study adhered to the Principles of Animal Care and were approved by the Institutional Ethics Committee of University of Valencia (Spain) according to RD 1201/2005 (code A1326906234491).
A parallel study was designed in which a single dose of taurine was administered either IV or orally to each group of rats. A total of sixty-four male Wistar rats, 8–9 weeks of age, with a mean weight of 235·5 (sd 7·9) g, a mean serum albumin of 34·6 (sd 6·5) g/l and a mean serum cholesterol of 1·29 (sd 0·324) g/l were used. Animals were placed in individual polyethylene cages (22×22×16 cm) in a controlled room (22–23°C, 50–60 % humidity) under a 12 h light–12 h dark cycle. Subjects were randomly assigned to one of two groups: well-nourished (WN) (regular nutrition diet/WN, n 32) and UN (protein–energy restricted diet/UN, n 32). Both groups were allowed free access to water, but their food intake was controlled. The WN group was subjected to a standard pellet diet (2014 from Harlan laboratory) that fulfilled the normal daily requirements of a rat (14 % proteins, dose of diet intake per d: 20 g/251·9 kJ) during an adaptation period that lasted 23–25 d. The UN group received a diet that was altered in protein, carbohydrate and fat content (TD 99168 from Harlan laboratory; 5 % proteins, dose of diet intake per d: 10 g/159 kJ) for the same period of time.
The rats of both groups (WN and UN) were weighed on a daily basis and serum albumin and serum total cholesterol were quantified once a week using standard commercial kits (QCA Laboratory).
The main biometrical parameters used for the assessment of the nutritional status were weight and serum albumin( Reference Omran and Morley 29 ). Animals of the UN group were considered malnourished if, at the end of the adaptation period, the weight was below 80 % of the weight reached in the WN animal group and serum albumin was below 23 g/l. Serum total cholesterol values were also recorded.
The pharmacokinetic study was performed at the end of the adaptation period. For this purpose, rats from both nutritional status (WN or UN) were randomly allocated into different groups based on the dose and route of taurine administration (IV or oral). This protocol resulted in a total of twelve groups, consisting of between four and six animals (Table 1).
Table 1 Experimental design
WN, well-nourished; UN, undernourished.
The day before administration, rats were subjected to jugular vein cannulation with a 12-cm-long fragment of medical-grade silicone tubing (Silastic, inner diameter: 0·6 mm; outer diameter: 0·94 mm; Dow Corning Co.). Anaesthesia and analgesia were induced before surgery with intraperitoneal thiopental Na solution 10 % (w/v) at a dose of 30 mg/kg (Dolethal®; Vétoquinol) and subcutaneous butorfanol tartrate (Torbugesic®; Pfizer). Under anaesthesia, a 3·4-cm section of the cannula was introduced into the jugular vein in the direction of the heart and the free end was subcutaneously conducted to the dorsal base of the neck, at which point the cannula emerged. The exteriorised end was then closed with a polyethylene plug. The cannula was filled with heparinised (0·2 g/l) saline solution. After surgery, animals were maintained in non-fasting conditions overnight with water freely available.
Taurine administration and blood sample collection
Taurine was purchased from Sigma-Aldrich® (Welwyn Garden City). A total of sixty-four animals was used in the study. Solutions were prepared by dissolving the corresponding amount of the amino acid in saline solution.
To facilitate the blood sampling of conscious rats, a 15-cm-long silicon tube (bridge-tubing) was connected to the free end of the cannula. For oral administration, rats were subjected to gastric intubation with all the groups receiving 1 ml of their assigned preparation.
After IV or oral administration, blood samples were taken using heparinised syringes from the jugular vein cannula at the scheduled time. After each sampling time, the blood volume was replaced with the same volume of saline solution. After collection, each blood sample was centrifuged at 5000 rpm for 5 min and the plasma was transferred to polypropylene tubes and stored at −20°C until taurine quantification. To achieve the deproteinisation of samples, 5-sulfosalicylic acid was used as previously described( Reference Teerlink and Houdijk 30 ). Samples stored in these conditions remained stable for at least one month (the remaining taurine concentration at this time was above 95 %).
Analytical procedures
Plasma samples were assayed for taurine content by HPLC, with fluorimetric detection taking place after derivatisation with OPA-MPA (λ ex=230 nm, λ em=389 nm)( Reference Teerlink and Houdijk 30 ). The buffer used to prepare the mobile phase consisted of 9 mm potassium dihydrogen phosphate and 0·5 ml/l triethylamine, adjusted to pH 6·9 with KOH. The mobile phase was prepared by mixing this buffer with a mixture of organic solvents (methanol–acetonitrile, 90:10) in 55/45 (v/v). A reversed-phase column was used (UltraBase C18 3 μm 100×4·6 mm). A flow rate of 0·9 ml/min was used, and 50 µl of the clear supernatants was injected into the chromatograph. Calibration curves covering the whole range of taurine concentrations in the plasma samples (from 50 to 750 µm) were prepared in triplicate. The taurine peak area was measured in each sample and correlated with the amino acid concentration. Excellent plots correlating the peak areas and amino acid concentrations were obtained (r>0·999). The accuracy and precision of the method were confirmed using four concentrations covering the range of those to be analysed. They were evaluated by calculating the relative error and CV, which were always below 7 %. The limit of quantification was 57·11 µm for taurine samples. The results obtained were considered fully acceptable( Reference Karnes 31 ).
Pharmacokinetic modelling and statistical analysis
A stepwise population pharmacokinetic approach was followed by using a non-linear mixed effects model and the first-order estimation method, implemented with NONMEM, version VI( Reference Beal and Sheiner 32 ), in conjunction with a G77 FORTRAN compiler and Wings for NONMEM. Different subroutines were used, namely ADVAN 3, 11 and 9. The experimental data used to build the model were total plasma concentration of taurine.
As the taurine concentration in plasma is owing to both internal regulation and external particular uptake, for the modelling, two input constants were considered: a zero order (Q 0 (mg/h)) as representative of an internal equilibrium of synthesis and degradation, and a second input constant to characterise the uptake from oral administration, modelled considering a passive or an active process.
Pharmacokinetic modelling was performed from an empiric and mechanistic perspective. The empiric approach allowed deciding whether the pharmacokinetic parameters depend on the dose administered and the mechanistic approach was performed to select the kinetics of each ADME process. The model was developed sequentially, so that whenever modifications had to be made to the base structure of the model a backwards procedure was performed. Data were also incorporated in a sequential manner. The analysis consisted of the following steps:
-
(1) Step 1: TAU IV data from groups 1, 2 and 3 (WN).
-
(2) Step 2: TAU IV data from groups 7, 8 and 9 (UN).
-
(3) Step 3: TAU IV data from groups 1, 2, 3, 7, 8 and 9 (WN and UN).
-
(4) Step 4: TAU IV data from groups 1, 2, 3, 7, 8, 9 and oral data from groups 4, 5, 6 and 10, 11 and 12 (WN and UN).
In steps 1 and 2, the selection of the compartmental model (one compartment or two compartments) was made and non-linearity in the distribution or elimination processes was assayed. Step 3 was implemented to optimise the model characterising the non-linear processes detected in previous steps and also evaluating the influence of the nutritional status on the pharmacokinetic parameters (distribution and excretion). In the last stage of model development (step 4), the values for disposition parameters were fixed at those obtained in step 3, as the addition of oral data did not affect them. Then, the oral absorption process was studied and the influence of the nutritional status on taurine absorption and bioavailability was tested.
Inter-individual variability (IIV) in pharmacokinetic parameters and residual error in plasma concentration was modelled with exponential equations (Equations (1) and (2), respectively):
 $$\theta _{i} \,{\equals}\,\bar{\theta }\,\cdote.\, e\,^{{\eta _{i} }} {\rm }\;\;\;\eta _{i} {\!}\sim {\!}N(0,\omega ^{2} )$$
 $$y_{{ij}} {\equals}f\left( {\theta _{i} ,D_{i} ,x_{{ij}} } \right) \,\cdote.\,e\,^{\epsilon_{j} }} ;{\rm }\;{\rm }\epsilon _{j} {\!}\sim {\!}N(0,\sigma _{1}^{2} )$$
In Equation (1), θ
i
is the pharmacokinetic parameter θ of the individual, $\bar{\theta }$
the mean population value of this pharmacokinetic parameter and η
i
the IIV of a population (N) with a mean randomly distributed around zero and an estimated variance of ω
2. The need to include inter-IIV terms was evaluated for all parameters.
$\bar{\theta }$
the mean population value of this pharmacokinetic parameter and η
i
the IIV of a population (N) with a mean randomly distributed around zero and an estimated variance of ω
2. The need to include inter-IIV terms was evaluated for all parameters.
For the residual error calculation, Equation (2), f(θ
i
, D
i
, x
ij
) represents the individual predicted concentration by means of a particular pharmacokinetic model f, with individual pharmacokinetic parameters, θ
i
, dose, D
i
, and time, j, at which concentrations of the amino acid were evaluated (dependent variable, x
ij
) and were modelled in terms of epsilon (ε) variables. Each ε variable was assumed to have a mean of zero and an estimated variance $\sigma _{1}^{2} $
. A slope-intercept error model was used where the residual variability (σ) of the exponential term was interpreted as a CV and the added component as standard deviation.
$\sigma _{1}^{2} $
. A slope-intercept error model was used where the residual variability (σ) of the exponential term was interpreted as a CV and the added component as standard deviation.
In the selection of the best model, the minimum value of objective function (MOFV) provided by NONMEM was adopted. For hierarchical models, the difference between objective function values is distributed as χ 2, which allows the best model to be selected. A P level of 0·01 was chosen for accepting a more complex model over a reduced one. For hierarchical models differing by one or two parameters, the corresponding differences in the objective function values are 6·63 and 9·21, respectively. Precision in the estimation of the parameter values, quantified as the relative standard error (%) and residual error, were also evaluated in order to select the final model. The graphical goodness of fit analysis was evaluated through the use of SPlus for Windows, version 7.0 (Insightful) and R (version R-3.1.2).
Model evaluation was performed by means of a visual predictive check and the bootstrap resampling technique. For Visual predictive check, simulations of taurine concentration–time profiles for 200 simulated populations were performed using the final model, and each model parameter was estimated including IIV. For each group, the concentration–time profiles corresponding to the 5th, 50th and 95th quartiles were represented together with the corresponding observations( Reference Karlsson and Holford 33 ). Similarly, the bootstrap resampling technique was used as an internal method to validate the final model. From the original data set, 1000 replicates were generated by sampling randomly with replacement, and the final population pharmacokinetic model was fitted repeatedly to each replicate using the bootstrap option of Wings for NONMEM V package (Holford, version 222, May 2001). The mean and median parameter estimates and their 95 % CI were obtained from the bootstrap replicates and compared with the population pharmacokinetic parameters obtained from the original data set.
Results
Table 2 shows mean values, standard deviation and 95 % CI of serum albumin, total cholesterol and body weight at the beginning and the end of adaptation period for WN and UN animals. The nutritional assessment according to serum albumin and body weight is also shown. There were no differences between body weight, serum albumin or total serum cholesterol before the adaptation period. However, at the end of the adaptation period statistical differences were found in body weight and serum albumin between WN and UN animals (P<0·0001). As previously reported, the weight evolution of UN animals was best described by linear weight gain and a decline module characterised by exponential weight loss, where the weight loss rate constant is an exponential function of time( Reference Merino-Sanjuan, Catalan-Latorre and Nacher 34 ). Total serum cholesterol showed a non-statistical decrease. The nutritional assessment revealed that 81 % (n 26) of the animals in the UN group developed moderate to severe undernutrition.
Table 2 Biochemical and biometric parameters and values obtained for classifying the degree of undernutrition (Mean values and standard deviations and 95 % confidence intervals)
No statistical differences between basal taurine plasma concentration obtained in WN and UN animals were found (WN (50·97 (sd 14·54) mg/l) and UN (48·86 (sd 22·11) mg/l) (P>0·05)).
Taurine plasma concentration–time profiles obtained after IV and oral administration are shown in Fig. 1. The experimental data used in the model development were taurine plasma concentration v. time.
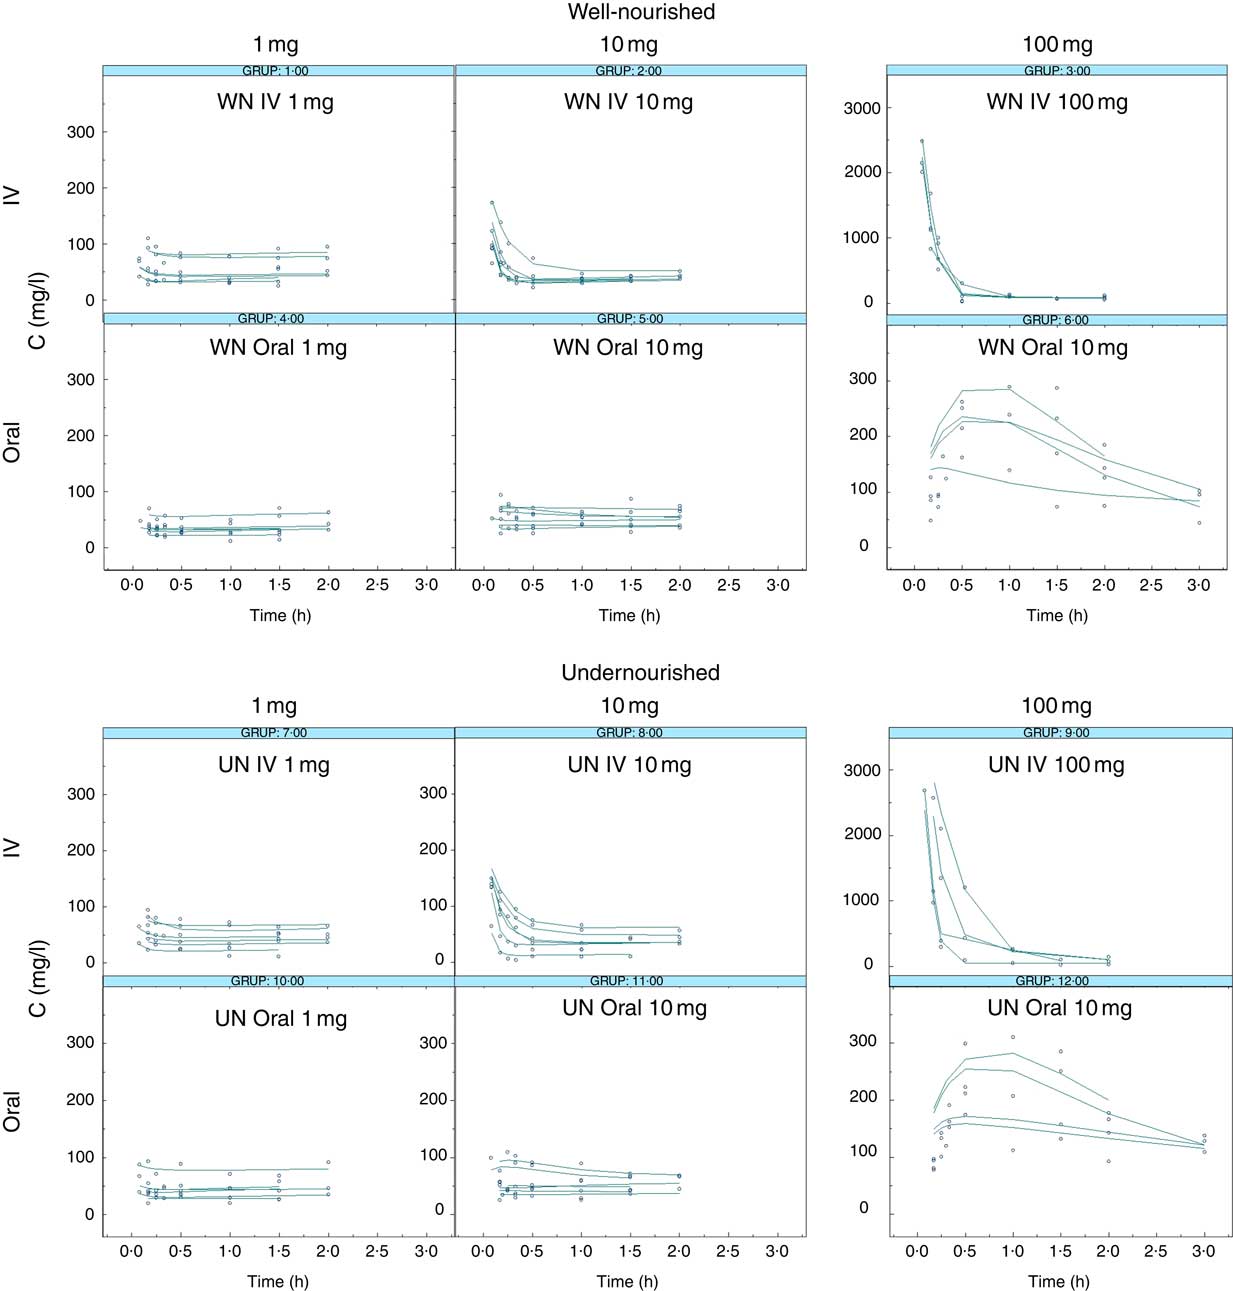
Fig. 1 Taurine levels: observed v. predicted. Observed taurine concentrations (mg/l, dots) and individual predicted taurine concentrations (IPREDV, mg/l, lines) v. time (h) according to the final model (model 150) obtained after the administration of 1, 10 or 100 mg of taurine. WN, well-nourished animals; UN, undernourished animals; IV, intravenous.
A Michaelis–Menten process was fit to identify the kinetics of distribution and elimination processes (disposition phase, steps 1 and 2). The empirical model revealed non-linear excretion phenomena, but failed to provide any relevant information. Taking into account that taurine is mainly excreted in urine with high variations, a saturable renal tubular secretion and reabsorption process was tested( Reference Campos Moreno, Merino Sanjuan and Merino 35 ). The model with active renal excretion and reabsorption was chosen in this step. When a mechanistic approach was considered, using data from WN and UN animals (Step 3), the influence of nutritional status on Vms, Kms, Vmr and Kmr parameters was evaluated. This step showed that the active secretion process of taurine was decreased in undernutrition status; Vms was 10 % lower in UN animals.
In the final step (Step 4), disposition parameters were fixed to those obtained in the previous steps and oral administration data of UN and WN animals were added. The absorption process is best described by passive diffusion kinetics. Oral bioavailability was also incorporated in the model as a function of the oral dose administered and nutritional status. In all cases, results were very similar to 1 (100 % bioavailability).
Fig. 2 illustrates the schematic structure of the model and the corresponding equation (Equation (3)) that best defined the pharmacokinetic profile of taurine:
 $$\eqalignno{{{{\rm d}C(1)} \over {{\rm dt}}}{\equals}&Q_{0} {\plus}k_{{\rm a}} C\left( 3 \right){\minus}k_{{12}} C\left( 1 \right){\plus}k_{{21}} C\left( 2 \right){\minus}{{{\rm Vms}\cdot(F_{{{\rm UN}}} )^{{NUT}} C\left( 1 \right)} \over {{\rm Kms}{\plus}C\left( 1 \right)}}\cr &{\plus}{{{\rm Vmr}\cdotC(4)} \over {{\rm Kmr}{\plus}C(4)}}$$
where k a is the oral absorption rate, Q 0 the basal level of taurine, K 12 and K 21 the inter-compartmental distribution constants, Vmr and Kmr the reabsorption Michaelis–Menten constants, Vms and Kms the elimination Michaelis–Menten constants, F UN the reduction of Vms calculated in UN animals compared with WN animals. NUT=0 in WN or 1 in UN.
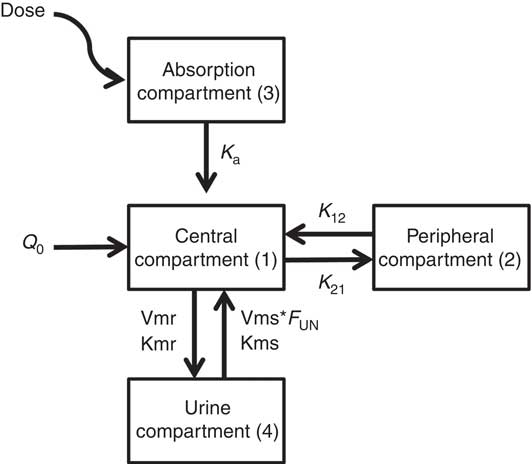
Fig. 2 Final model diagram of the final model describing the pharmacokinetic profile of taurine after oral administration. D, dose; k a , oral absorption rate; Q 0, basal level of taurine; K 12 and K21, inter-compartmental distribution constants; Vmr and Kmr, reabsorption Michaelis–Menten constants; Vms and Kms, elimination Michaelis–Menten constants; F UN, reduction of Vms calculated in UN animals compared with WN animals. NUT=0 in WN or 1 in UN.
Table 3 shows the estimated values for the pharmacokinetic parameters of the final model (covariance step aborted). Individual taurine plasma concentration values predicted with the selected model are also shown in Fig. 1 as a line. Individual and population predicted v. observed taurine plasma concentrations are plotted in Fig. 3. Weighted residuals (WRES) v. time and absolute individual weighted residuals |IWRES| v. individual predictions are also shown in Fig. 3, whereas Fig. 4 shows the results of the visual predictive check.
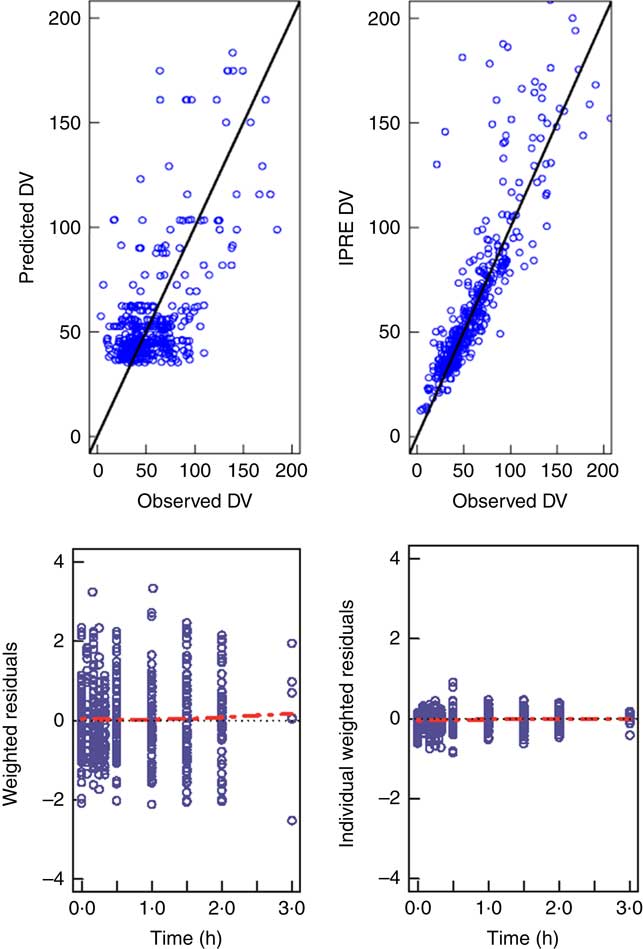
Fig. 3 Goodness of fit plots. The upper panels show observed concentrations v. predicted concentrations for the typical individual on the left (predicted dependent variable; DV) v. predictions for each individual on the right (IPRED), together with the identity line (![]() ). The lower panels show the weighted residuals for the typical individual (WRES) v. time and the individual weighted residuals IWRES v. predictions for each individual with smooth spline (
). The lower panels show the weighted residuals for the typical individual (WRES) v. time and the individual weighted residuals IWRES v. predictions for each individual with smooth spline (![]() ).
). ![]() , Reference.
, Reference.
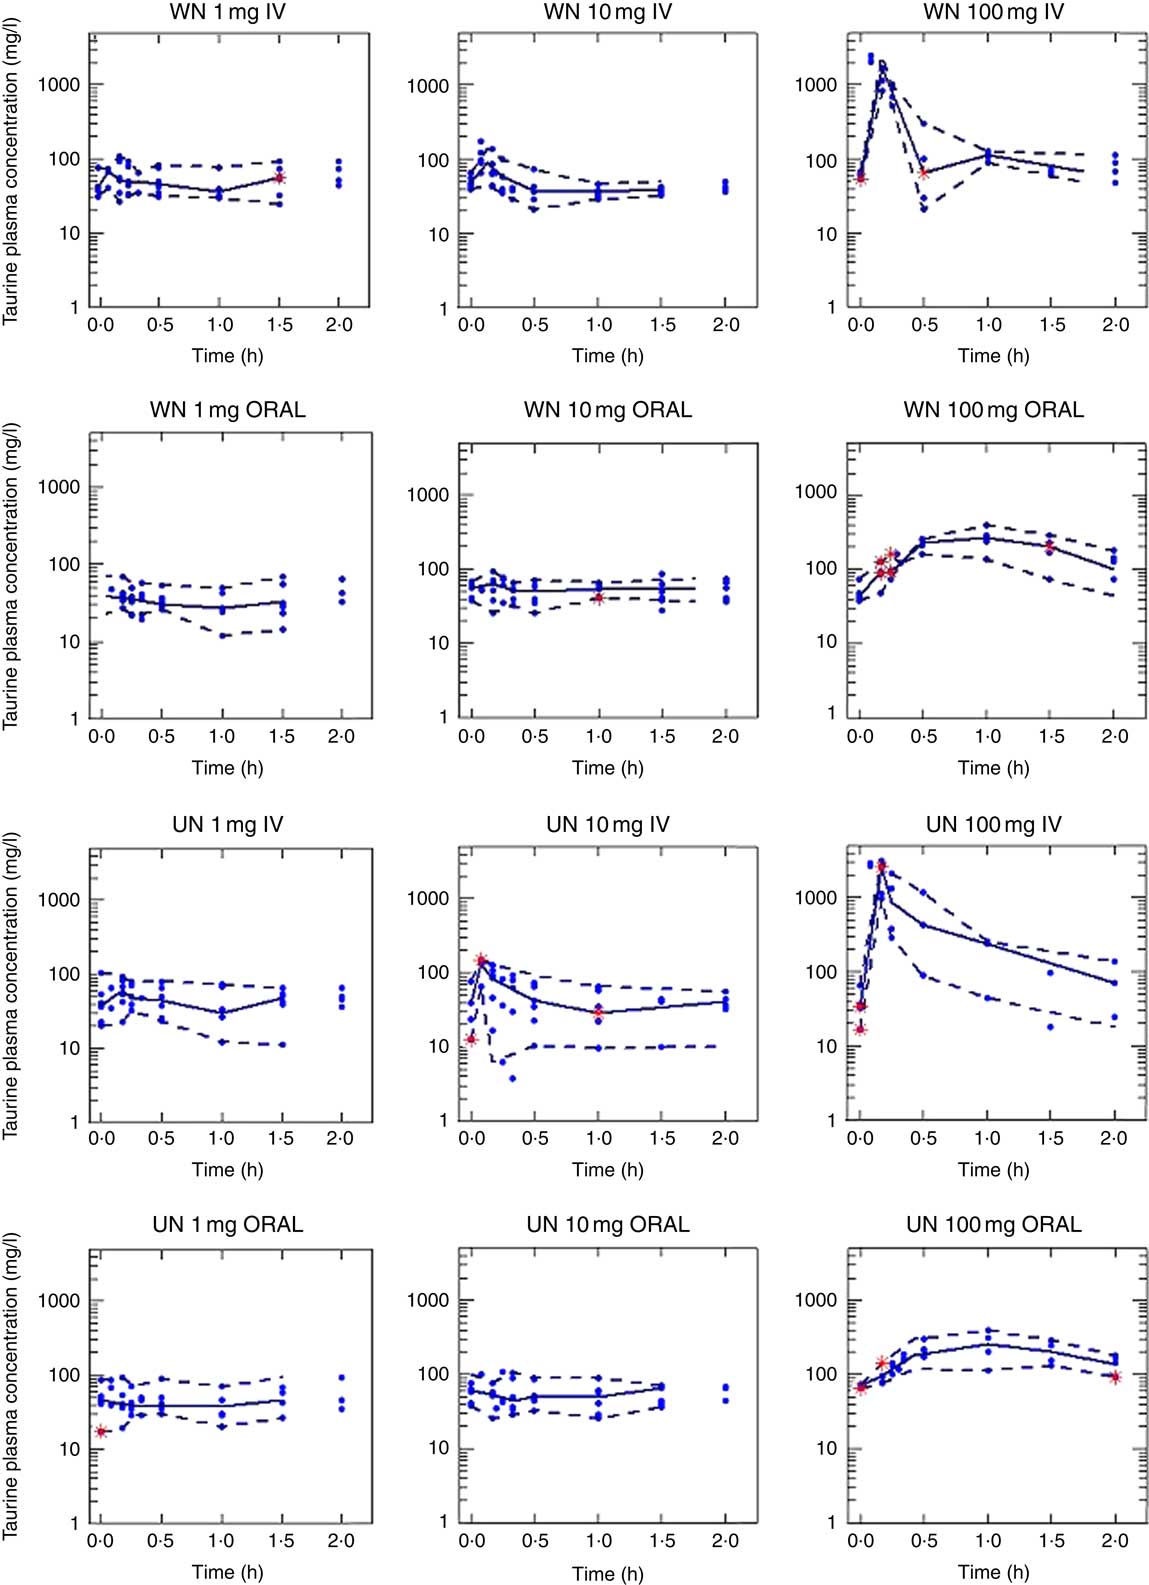
Fig. 4 Taurine plasma concentrations. Results of the model exploration exercise (visual predictive check), in which total plasma concentration–time profiles of taurine were simulated 200 times. Experimental plasma concentration of taurine (∙). Lines represent 5th, 50th and 95th percentiles. WN, well-nourished animals; UN, undernourished animals; IV, intravenous.
Table 3 Pharmacokinetic taurine parameters for the population of the well-nourished and undernourished animals studied obtained from the original data set (left) and mean results from bootstrap analysis (1000 replicates, 811 minimisation successful, right)
Discussion
Malnutrition is associated with variations in drug absorption and drug disposition owing to changes in protein binging, hepatic metabolism and renal elimination( Reference Lykke, Hother and Hansen 9 , Reference Winter, O’Keefe and Callanan 36 , Reference Saunders and Smith 37 ). As a consequence, drug toxicity increases and the response to treatment is altered. In such a situation, conditionally essential nutrients, such as taurine, that are mainly provided by dietary intake may have altered body levels. However, only a few studies have, thus far, evaluated the influence of malnutrition on the pharmacokinetics of nutrients, such as taurine, in malnourished patients( Reference Miralles-Arnau, Nacher and Jimenez 38 ).
The present study was undertaken to determine the preclinical pharmacokinetic model of taurine after oral, as well as IV, administration and to investigate the influence of nutritional status on the pharmacokinetics of this amino acid. To detect possible non-linearity, three doses of the amino acid were administered. Such information is essential when a regimen for administration of this agent to patients is designed.
The empirical models in steps 1 and 2 were fit in order to determine the compartmental model suitable for taurine and to detect possible non-linearity in the disposition processes. Both steps revealed that the model that best fitted the data was a bicompartmental model with non-linear phenomena in the elimination process, which agrees with the literature, where it has been described that taurine transport undergoes an adaptive response to changes in taurine availability and body requirements( Reference Han, Patters and Jones 39 ). Contrary to most amino acids, taurine is not metabolised and does not bind to protein but remains free in the intracellular water. Most amino acids are reabsorbed at rates of 98–99 %. Reabsorption of taurine, however, may range from 0·5 to 99·5 %, suggesting an adaptive regulation of transport in the kidney( Reference Chesney, Han and Patters 6 ). In step 3, the effect of covariates, final body weight, final serum albumin, final serum cholesterol and degree of undernutrition in those parameters, was checked to detect the influence of nutritional status on the pharmacokinetic parameters. Linear, exponential and potential equations were explored. As these analyses failed, nutritional status was introduced in the fitting as a factor. The best fit was obtained with the bicompartmental model with non-linear elimination, depending on both the administered dose and nutritional status.
Given the small molecular size of taurine, a passive diffusion elimination process was first evaluated. However, during the mathematical modelling of data, the successful models showed that passive renal filtration was very low (<0·52×10−9 l/h per g), indicating that active elimination processes (saturable renal tubular secretion and reabsorption) are significantly more relevant than passive diffusion (P<0·01). Thus, renal filtration was not incorporated in the final model. The model selected in step 3 incorporates saturable renal tubular secretion and reabsorption, thus being in agreement with previous findings. As an endogenous compound, its renal clearance is modulated according to body requirements determined by uptake and pathophysiological changes. It has been described that its elimination is because of a process sensitive to the presence of Na and Cl ions and that it is partially reabsorbed by the TauT transporter located in the proximal tubules( Reference Han, Patters and Jones 39 ).
In this scenario, after administration of a 10-mg dose, active tubular reabsorption would be saturated, which would encourage elimination, and clearance would be higher than that observed with the 1-mg dose. Similarly, with the 100-mg dose, active tubular secretion and tubular reabsorption processes could both be saturated, so that clearance would be lower than in the case of the 1-mg dose, both in WN and UN. The influence of nutritional status on Vms, Kms, Vmr and Kmr parameters was also evaluated in this step. The saturation of the secretion process will first occur in UN animals, which showed a 10 % lower Vms than WN animals; therefore, elimination in UN animals would be lower than in WN animals. This change in clearance, which was statistically significant (P<0·01), may not have clinical relevance in higher dietary supplementation but may be of relevance in patients with normal or low taurine intake (1–10 mg each meal (or 3–30 mg/d) in rats equivalent to 6–60 mg/meal (or 18–120 mg/d) in humans)( Reference Sung and Chang 40 ).
In the final step, step 4, oral data from WN and UN animals were added. Results showed that the oral absorption of taurine can be better described by a passive diffusion model that is not altered by the nutritional status. The model selected to describe taurine absorption differs from other publications. Intestinal transporters for taurine (TauT) that have low capacity and high specificity have been described( Reference Han, Patters and Jones 39 , Reference Broer 41 , Reference Moll-Navarro, Merino and Casabo 42 ). The differences found may be owing to the range of doses administered. The selection of the doses administered in our study was made according to the taurine doses granted in enteral diets designed for human patients (equivalent to 1 and 10 mg in rats), whereas the higher dose (100 mg) was chosen owing to its negligible toxicity. Doses of 1 mg and 10 mg of taurine orally administered did not significantly increase the plasma levels of the amino acid from the basal levels, whereas a dose of 100 mg of taurine could (Fig. 1). Data obtained from the 100-mg administration might not have been sufficient to characterise the non-linearity in the absorption process. Moreover, it cannot be ruled out that if the transporter has low capacity it can be saturated at all doses administered. Finally, it has been described that this transporter activity seems to be higher in young subjects than in the elderly; although differences in absorption were not observed, nutritional status is likely to have a higher impact in young people( Reference Warskulat, Heller-Stilb and Oermann 43 ).
The CI of some of the model parameters, which cannot be strictly considered quantitatively, is very high. Taking into account the complexity of the model, the number of available plasma determinations and that taurine is an endogenous compound, the model can be considered a good approach to describe the pharmacokinetics of taurine. Its main usefulness resides in the fact that it reveals that undernutrition impairs the ADME process of taurine. Further studies need to be conducted in order to identify more accurately the precise mechanism responsible (i.e. renal reabsorption impairment, transporters reduction and so on) in order to extrapolate these results to other species, including humans.
Two conclusions can be drawn from the results obtained in this work: the taurine absorption process at the usual range of doses apparently is passive and levels of taurine plasma concentrations obtained in this study highlight the need for augmented taurine supplementation in enteral commercial formulations to increase taurine plasma levels (usual concentrations in enteral diets: 8–15 mg/100 ml)( 44 , 45 ).
Overall, the selected model describes taurine pharmacokinetics in WN and UN rats at the usual doses used in clinical practice and gives an approximation about what happens when this amino acid is administered in UN conditions.
Conclusions
Data analysis showed linear absorption and distribution, and non-linear elimination processes for taurine, with active processes, renal secretion and reabsorption implied. Elimination of taurine was reduced in UN animals, suggesting that the secretion transporter was significantly modified in this group. The taurine absorption process at the usual range of doses behaves as a passive process that is not altered in undernutrition.
Acknowledgements
The authors would like to honour Professor NV Jiménez Torres for his involvement in pharmaceutical science during his lifetime. His main concern was approximating basic research to clinics in order to increase the quality and safety in patient care.
The research was financed by the University of Valencia.
The contributions of the authors were as follows: A. C. L. carried out the animal experiments and was responsible for the collection of data. A. N. contributed to data collection, the presentation and interpretation of the results and the preparation of the manuscript. V. M. participated in its design, contributed to the interpretation of the results and critically reviewed the paper. O. D. participated in the design of the study. M. M. S. conceived the study, participated in the design of the study, contributed to the presentation and interpretation of the results and coordination and critically reviewed the paper. All the authors have approved the final manuscript.
The authors have no conflicts of interest that might be relevant to the content of this paper.


