


Introduction
Madagascar is renowned for its high level of biotic endemism (Mittermeier et al., Reference Mittermeier, Konstant, Hawkins, Louis, Langrand and Ratsimbazafy2006). The distinctive flora and fauna have evolved during the island’s long separation from continental land masses, an isolation punctuated with rare and taxonomically biased colonization events (Yoder & Nowack, Reference Yoder and Nowack2006; Warren et al., Reference Warren, Strasberg, Bruggemann, Prys-Jones and Thébaud2010). With diverse habitat types and climate conditions Madagascar continues to maintain high overall biodiversity (Lowry et al., Reference Lowry, Schatz, Phillipson, Goodman and Patterson1997; Dewar & Richard, Reference Dewar and Richard2007). However, the landscape has been transformed dramatically since the arrival of humans c. 2,000 years ago (Burney, Reference Burney, MacPhee and Sues1999) and much of the native biota face extinction risks. Three of the eight families of lemurs, the endemic primates of Madagascar, have gone extinct in the past 2 millennia (Godfrey & Irwin, Reference Godfrey and Irwin2007). The greatest ongoing threats to extant lemurs are habitat loss and fragmentation (Mittermeier et al., Reference Mittermeier, Konstant, Hawkins, Louis, Langrand and Ratsimbazafy2006), where populations become more susceptible because of declining numbers (Lehman et al., Reference Lehman, Ratsimbazafy, Rajaonson and Day2006b) and the potential loss of genetic diversity (Olivieri et al., Reference Olivieri, Sousa, Chikhi and Radespiel2008; Radespiel et al., Reference Radespiel, Rakotondravony and Chikhi2008).
The grey-headed lemur Eulemur cinereiceps, categorized as Endangered on the IUCN Red List (IUCN, 2009), is of immediate conservation concern (Mittermeier et al., Reference Mittermeier, Ratsimbazafy, Rylands, Williamson, Oates and Mbora2007) and is limited to a highly restricted range in south-east Madagascar that includes a largely continuous inland forest block and small coastal fragments (Irwin et al., Reference Irwin, Johnson and Wright2005). Subjected to habitat loss and hunting, these remaining populations of E. cinereiceps occur at relatively low densities (Johnson & Overdorff, Reference Johnson and Overdorff1999; Irwin et al., Reference Irwin, Johnson and Wright2005). These patterns contrast with those in other species in the genus, which are often locally abundant (Irwin et al., Reference Irwin, Johnson and Wright2005) and generally at lower risk of extinction (IUCN, 2009).
Frequent tropical cyclones have produced significant modifications to coastal habitats in the range of E. cinereiceps (Ratsimbazafy, Reference Ratsimbazafy2002) but, unlike other sympatric lemurs, E. cinereiceps appears to be relatively resilient to such stochastic events. Category 4 Cyclone Gretelle struck in this region on 24–25 January 1997. There was a significant impact on forest structure and animal populations, including an estimated 50% decline in lemur populations (Ratsimbazafy et al., Reference Ratsimbazafy, Ramarosandratana and Zaonarivelo2002). Yet Johnson et al. (Reference Johnson, Ingraldi, Ralainasolo, Andriamaharoa, Ludovic and Birkinshaw2011) documented population densities of E. cinereiceps similar to pre-cyclone levels in 2007 (this population was also exposed to ongoing human disturbance during this time). However, it is not known if these populations fluctuated significantly either historically or during the 10-year post-cyclone period or if any such changes could have affected genetic diversity (e.g. by producing a bottleneck effect).
Abundance and genetic diversity are both essential to assessing conservation status yet only a few studies of primates (e.g. Bergl et al., Reference Bergl, Bradley, Nsubuga and Vigilant2008) have presented combined data on these two elements of population structure. It is important to investigate abundance and population genetics concurrently to help elucidate how multiple natural and anthropogenic factors may affect a species. Here we report data on population density, total estimated population size, and genetic diversity in three populations of E. cinereiceps in south-east Madagascar.
Study area
Our research was conducted in the forest blocks in south-east Madagascar harbouring the only known populations of E. cinereiceps: Manombo and Agnalazaha on the coast and Vevembe in the interior (Fig. 1). These three sites contain all the major habitat types of the south-eastern lowland to mid elevation humid forests. Manombo is divided into two administrative units: Manombo Special Reserve and Classified Forest (0–137 m altitude). This site includes a larger block of lowland wet forest (4,484 ha) and several smaller fragments of lowland and littoral wet forest. We surveyed in the main block only, which spans both the Special Reserve (Parcel I) and Classified Forest, connected by two narrow corridors (c. 50 and 175 m wide). Manombo has a long history of fragmentation and human disturbance. Topographic maps from 1957–1958 depict the area in its current configuration, isolated from other forest blocks. Illegal logging and hunting continue to occur but have reportedly diminished in the past 20 years (Ratsimbazafy, Reference Ratsimbazafy2002).

Fig. 1 The location of the three study sites. In Manombo the administrative units, the Classified Forest (MCF) and Parcels I and II of the Special Reserve (MSR), are indicated. Shaded areas indicate forest and lines are river systems. The shaded rectangle on the inset indicates the location of the main map in south-east Madagascar.
Agnalazaha (0–18 m altitude) is a system of littoral wet forest fragments separated from Manombo by the Menatsimba River (> 40 m wide). The 1957–1958 maps also indicate isolation from interior forests for > 50 years. There are two main fragments, Inland and Coastal, divided by a ≥ 125 m wide band of marshes and agricultural clearings. The habitat has been affected by selective but intensive cutting and occasional fires but clearing and hunting are currently controlled.
Vevembe (570–615 m altitude) is an unclassified low–mid elevation wet forest. Although formerly under logging concessions it has been less disturbed than the coastal sites. Vevembe is part of the main interior forest corridor, a continuous block of lowland–high elevation wet forest that spans most of the eastern escarpment of Madagascar.
Methods
Forest area
Estimates of forest area in Manombo and Agnalazaha were based on Landscape 7 data acquired on 22 March 2001 (path 158 row 76), obtained from GLCF (2010). A K-means unsupervised classification was performed using six colour bands (1–5, 7) in PCI Geomatica v.10.01 (PCI Geomatica, Toronto, Canada). The classification resulted in 13 pixel clusters, which were aggregated into eight final classes. Polygons representing the dense forest class (areas > 10 ha) were retained and imported into ArcGIS v. 9.1 (ESRI, Redlands, USA). The last step was to remove lacunae of < 2 ha, which were probably the result of pixel mixing during the automated classification procedure. Because of the possibility of separate lemur populations within sites (see below), we calculated areas for individual isolated or semi-isolated forest blocks, along with total area estimates, for Manombo and Agnalazaha.
The interior forest corridor (including Vevembe) layer was obtained as per Irwin et al. (Reference Irwin, Johnson and Wright2005). Vevembe is part of a larger continuous forest, which extends beyond the potential limits of the E. cinereiceps breeding population. We therefore estimated area by fitting a minimum convex polygon to coordinates of the trail network and off-trail observations of E. cinereiceps, obtained with a global positioning system (Johnson, Reference Johnson2002), including additional sections of habitat adjacent to forest limits (< 500 m from trail and observation points). As this forest is not a discrete fragment the area of the site was determined only to facilitate comparisons of population size across localities. The breeding population may extend beyond the boundary of the site as delimited here, and thus the total abundance of this population may be higher (see below).
Population size
We surveyed E. cinereiceps at Manombo in June–October 2007, Agnalazaha in June–October 2007 and Vevembe in May–September 2000. Estimates of population density were obtained from line-transect surveys. Transects were 1.2–3.5 km long and total survey effort per site was 87.2–92 km. Transects were established to sample across fragments, microhabitats and elevation zones at each site. We used the histogram inspection method (Whitesides et al., Reference Whitesides, Oates, Green and Kluberdanz1988) to estimate transect width from perpendicular animal-transect distances; as E. cinereiceps is rare, sample sizes were lower than recommended for other methods. Density was calculated by multiplying site-specific mean group size by the number of groups sighted and dividing by survey area (total transect length by width). Error estimates were obtained from replicates on individual transects. We used a pairwise non-parametric randomization test to compare actual mean differences between sites to a randomized distribution of mean differences based on 10,000 resampled values from both sites. To calculate total population size at each site we multiplied mean density across transects by forest area. We also obtained population sizes for isolated and semi-isolated forest blocks at Agnalazaha and Manombo using mean density for transects within these blocks.
Sampling and genotyping
Survey dates and sample sizes of lemurs captured are presented in Table 1. Study animals were immobilized with a DanInject (DanInject, Kolmården, Sweden) Mod JM dart rifle propelling Type P disposable darts (Pneu-Dart, Williamsport, USA) loaded with 10 mg kg-1 (estimated target weight) of Telazol (Fort Dodge Animal Health, Overland Park, USA). Sedated study animals were carried to a base camp where morphological data and biological samples were taken. Post recovery, the animals were returned to the capture location and/or the social group. Biological samples are cryo-banked (-80°C) at Omaha’s Henry Doorly Zoo’s Genetics Department laboratory. All captures, handling, collections, and export/import were conducted according to procedures approved in Malagasy government, IACUC (Omaha’s Henry Doorly Zoo), ACC (University of Calgary), CITES, and US Fish & Wildlife Service permits. To conform to research ethics for studies of threatened primates we restricted sampling to at or near minimum sample sizes required to perform statistical analyses for each study site; in some cases, this sampling exceeded 10% of the estimated total population size.
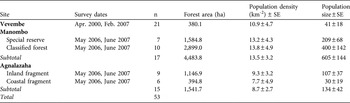
Table 1 Survey dates, number of captures (n) for genetic analyses, forest area estimated from analysis of satellite data, and mean population density and size estimated from transect surveys for the grey-headed lemur Eulemur cinereiceps at the three sites in south-east Madagascar (Fig. 1).
DNA was extracted from 2.0-mm ear punch biopsies using proteinase k digestion followed by standard phenol-chloroform extraction (Sambrook et al., Reference Sambrook, Fritch and Maniatus1989). Forty-two microsatellite loci were initially screened across the sample set. Eighteen loci were derived from the E. cinereiceps genome (Tokiniaina et al., Reference Tokiniaina, Bailey, Shore, Delmore, Johnson, Louis and Brenneman2009), 13 were generated from the red-bellied lemur E. rubriventer genome (Andriantompohavana et al., Reference Andriantompohavana, Morelli, Behncke, Engberg, Brenneman and Louis2007), 11 from the red-fronted lemur E. rufifrons (= E. fulvus rufus) genome (Jekielek & Strobeck, Reference Jekielek and Strobeck1999) and presented here (Appendix 1) following the methodology described in Tokiniaina et al. (Reference Tokiniaina, Bailey, Shore, Delmore, Johnson, Louis and Brenneman2009). Genotypes were generated by polymerase chain reaction, scored and assigned in accordance with the protocols described in their respective primer notes. The genotype file was checked for errors with Microsatellite Analyser (Dieringer & Schlötterer, Reference Dieringer and Schlötterer2003) and MICRO-CHECKER (Van Oosterhaut et al., Reference Van Oosterhaut, Hutchinson, Wills and Shipley2004) and then tested for null allele frequencies in Cervus v. 2.0 (Slate et al., Reference Slate, Marshall and Pemberton2000). Sixteen loci with null allele frequency estimates > 0.10 were removed from the data set. While all loci were independent in their respective primer notes, the combined marker suite was again tested for linkage disequilibrium in FSTAT v. 2.9.3 (Goudet, Reference Goudet2002). Two loci, 44HDZ91 and 104HDZ127, were found to be potentially in linkage disequilibrium (P = 0.05) after Bonferroni correction. These loci were developed from different Eulemur genomes (E. rubriventer and E. cinereiceps) and were both included in the analysis.
Statistical analysis
Genetic diversity was measured using rarefacted allelic richness (AR), observed and expected heterozygosity (HO and HE) using FSTAT and Genepop v. 3.4 (Raymond & Rousset, Reference Raymond and Rousset1995). Departure from Hardy–Weinberg equilibrium (HWE) was performed in Genepop using the exact test of Guo & Thompson (Reference Guo and Thompson1992). Wright’s F-statistics were used to estimate within population departure from HWE (FIS) and to estimate between population diversity (FST), according to the calculations of Weir & Cockerham (Reference Weir and Cockerham1984), in FSTAT. A Mantel test was performed, regressing a transformation of FST (FST/[1−FST]) on the logarithm of the Euclidean distance to determine the effect of isolation by distance. The number of effective migrants per generation (Nm) was calculated with the standard equation FST = (1/Nm−1)/4 (Slatkin, Reference Slatkin1985). To ensure possible population divergence was not due to biased sampling within family groups, we used SPAGeDi v. 1.2 (Hardy & Vekemans, Reference Hardy and Vekemans2002) to estimate relationship coefficients for every dyad within each population. The relationship coefficient distributions were overlaid on the distributions produced by the Queller & Goodnight (Reference Queller and Goodnight1989) method in a simulation of 10,000 individuals of known multilocus genotypes and pedigree relationships.
To test for recent population declines we used Bottleneck v. 2.1 (Cornuet & Luikart, Reference Cornuet and Luikart1996; Piry et al., Reference Piry, Luikart and Cornuet1999), which detects a past reduction in the estimated effective population size as an excess of HWE expected heterozygotes above what would be found if the population was in a state of mutation-drift equilibrium. The expected equilibrium heterozygosity (HEeq) is generated from the number of alleles and the sample size and compared to the estimated HWE heterozygosity (HE) under the Infinite Alleles Model (IAM), the Stepwise Mutation Model (SMM), or the Two Phase Model (TPM), allowing for variable proportions of the IAM and SMM used to describe the mutation events (Di Rienzo et al., Reference Di Rienzo, Peterson, Garza, Valdes, Slatkin and Freimer1994). The TPM approach may be the most realistic and its values fall between those calculated with IAM and SMM (Di Rienzo et al., Reference Di Rienzo, Peterson, Garza, Valdes, Slatkin and Freimer1994). The Wilcoxon sign-rank test was used to estimate the significance of the difference between HE and HEeq. The temporal window of testing for a recent bottleneck event is limited by a theoretical estimate of 0.25–2.5 × 2Ne (effective population size; Cornuet & Luikart, Reference Cornuet and Luikart1996) × generation interval. In the absence of data on E. cinereiceps the minimum generation interval was estimated to be 3.5 years based on a closely related species, E. rufifrons (Overdorff et al., Reference Overdorff, Merenlender, Talata, Telo and Forward1999). We estimated the respective effective population sizes using the more conservative linkage disequilibrium model (Hill, Reference Hill1981; Waples, Reference Waples and Hoelzel1991) rather than the heterozygote excess method, which often overestimates the number of effective breeders (Pudovkin et al., Reference Pudovkin, Zaykin and Hedgecock1996) in NeEstimator (Peel et al., Reference Peel, Ovenden and Peel2004).
Results
Forest area, population density and population size
Total forest area and areas of isolated and semi-isolated fragments, and population densities and estimated population sizes of E. cinereiceps are presented in Table 1. There is more remaining habitat at Manombo than at Agnalazaha. Although smaller than the coastal forests, the Vevembe study area does not correspond with forest limits (it is within a larger continuous block), nor necessarily with E. cinereiceps population boundaries. We found no significant differences in density among sites (Randomization test, Manombo vs Agnalazaha: mean difference = -4.937, P = 0.264; Manombo vs Vevembe: mean difference = 3.327, P = 0.527; Agnalazaha vs Vevembe: mean difference = -1.610, P = 0.745).
Marker suite evaluation
The 26 microsatellite loci used are listed, with descriptive characteristics of each locus, in Appendix 2. Two loci, 104HDZ127 (P < 0.05) and EFR37 (P < 0.01), deviated from HWE because of the significant departure of a single population in each case and were retained in the analysis. Polymorphic information content of the marker suite was a mean of 0.566 (0.150 ≤ PIC ≤ 0.762).
Population genetics
The sample sites were initially analysed by location. Subdividing samples from Coastal and Inland fragments of Agnalazaha did not reveal evidence of a Wahlund effect identifying subpopulations and thus this area was analysed as a single unit. Separate analysis of the Manombo Special Reserve and Classified Forest indicated a Wahlund effect, suggesting two subpopulations in Hardy–Weinberg equilibrium (Table 2). The distribution of estimated pairwise relationships among all individuals in each population is most similar to the relationship coefficient distribution simulated for unrelated individuals (Fig. 2). Therefore, we found no evidence that samples were biased by oversampling close kin.
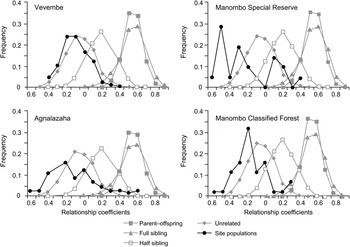
Fig. 2 Relatedness distributions of each dyad in each of the four populations (Fig. 1) overlaid on a simulation of 10,000 individuals of known pedigree relationships and multilocus genotype data, showing the greatest relationship similarities between the populations studied and the simulated distributions of unrelated individuals.
Table 2 Genetic structure of E. cinereiceps populations, with number of alleles (k), rarefacted allelic richness (AR), Hardy–Weinberg estimated P-values (HW), observed (HO) and expected heterozygosities (HE), and effective population size (Ne) calculated by the linkage disequilibrium method with the 95% confidence interval (CI), and bottleneck probability values under the infinite alleles model (IAM), default two-phase model (TPM70), stepwise mutation model (SMM), and the limit of bottleneck detection in generations and years.
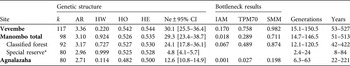
* With n = 7 did not meet the minimum threshold for bottleneck analysis (n = 10)
Genetic differentiation measured as FST (Table 3) was significant among the study sites after Bonferroni corrections (P < 0.01; with one exception, which was the FST between Manombo Special Reserve and Classified Forest, P > 0.05). Populations showed a trend of increasing levels of genetic diversity (measured as the number of alleles, rarefacted allelic richness, and heterozygosity levels) as the sampling moved from the spatially fragmented coastal populations to the continuous Vevembe Forest. These trends were not, however, statistically significant (G-Tests for k, AR, HO and HE, P > 0.05). The number of effective migrants per generation ranged from 3.389 (between Vevembe and Manombo Special Reserve) to 12.126 (between Manombo Classified Forest and Special Reserve; Table 3). The Mantel test for isolation by distance (Fig. 3) showed a moderate correlation (Spearman r = 0.5951) although, with only four degrees of freedom, the probability could not be determined.

Fig. 3 Isolation by distance regression of FST/(1−FST) on the logarithm of the Euclidean distance between sampling locations showing that more geographically isolated populations are also more genetically differentiated.
Table 3 Genetic differentiation expressed as FST (below the diagonal), number of effective migrants per generation (above the diagonal), and within population departure from Hardy–Weinberg equilibrium (FIS, diagonal and bold), for the four populations (Fig. 1).
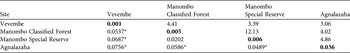
* P < 0.01
Past demographic events
Using Bottleneck we found some evidence in the Manombo and Agnalazaha forests of past reductions in the effective population sizes using the IAM (Table 2). Agnalazaha was the only population that showed a bottleneck event which was significant under the IAM and the TPM up to 77% single-step mutations. There was no significant evidence for population bottlenecks in the Vevembe Forest or the Manombo Classified Forest under any model. In the combined Manombo forest complex the population may have undergone a genetic bottleneck but with relatively weak significance (P < 0.05) and only under the IAM, the least conservative test. The bottleneck could be reliably detected as far back as only 22–250 years for Agnalazaha (Table 2).
The coastal sites had effective population sizes of 20.6, 4.9 and 11.9 individuals in the Manombo Classified Forest, Manombo Special Reserve and Agnalazaha forests, respectively. These are the number of breeding individuals estimated from population genetics parameters, and are independent of the population size estimates from the transect surveys. The population sampled in Vevembe had a higher effective population size of 25.0. Differences in effective population sizes were significant across these four areas (G-Test: G = 17.242, P < 0.001).
Discussion
Habitat, population density and total abundance of E. cinereiceps
In addition to the differences among the three study sites in the amount of habitat available to lemurs, previous studies have described variable impacts of anthropogenic disturbance and stochastic climate events in these forests. Ratsimbazafy (Reference Ratsimbazafy2002) noted habitat changes in the wake of Cyclone Gretelle in 1997 at Manombo, a site already affected by hunting and selective logging. These changes included severe damage to the majority of canopy trees (either felled or snapped), leading to an overall reduction in tree size for several years and probably to altered food availability for lemurs (Ratsimbazafy, Reference Ratsimbazafy2002; Johnson et al., Reference Johnson, Ingraldi, Ralainasolo, Andriamaharoa, Ludovic and Birkinshaw2011). Less is known of the disturbance history of Agnalazaha but its close proximity to Manombo suggests there would also have been widespread effects from Cyclone Gretelle in this disturbed littoral forest (also reported by local conservation managers). In contrast, the interior continuous forest at Vevembe was not strongly affected by this cyclone and there is less human encroachment at this site (Johnson, Reference Johnson2002, unpubl. data).
Notwithstanding these habitat differences, the density of E. cinereiceps did not vary between the three sites. The densities are within the range previously reported for this species and low relative to congeners in the region (Johnson & Overdorff, Reference Johnson and Overdorff1999; Irwin et al., Reference Irwin, Johnson and Wright2005). These findings suggest that E. cinereiceps does not maintain lower densities (e.g. Estrada & Coates-Estrada, Reference Estrada and Coates-Estrada1996), nor are they crowded (e.g. Irwin, Reference Irwin2008) in smaller fragments. However, because the densities are comparatively low it is plausible that all three populations are equally depressed, albeit via different mechanisms given the varied disturbance regimes across sites. The differences in estimated population size among the three sites may correspond to the differences in underlying genetic diversity (see below). There is generally a positive correlation between population size and overall genetic variation (e.g. Lande, Reference Lande1988; Caughley, Reference Caughley1994; but see Bazin et al., Reference Bazin, Glémin and Galtier2006), the maintenance of which is crucial for adaptive responses to changing environments and to avoid deleterious effects from inbreeding.
Genetic differentiation
Our findings reveal significant genetic differentiation among the populations of E. cinereiceps, with a high correlation coefficient of the isolation-by-distance regressions (i.e. that differentiation is greater between than within geographical regions). Similar results have been obtained for mouse lemur (Microcebus spp.; Olivieri et al., Reference Olivieri, Sousa, Chikhi and Radespiel2008) and Bornean Pongo pygmaeus and Sumatran Pongo abelii orang-utan populations (Kanthaswamy & Smith, Reference Kanthaswamy and Smith2002). The estimation of migrants per generation provides evidence of gene flow in the recent past between the coastal forest populations and the inland forest population, despite the > 40 km of anthropogenic grassland now separating these sites.
Among the coastal forests, the Manombo Special Reserve and Classified Forest population FST fell within the range of subpopulation divergence in other fragmented primate populations (Goosens et al., Reference Goosens, Chikhi, Jalil, Ancrenaz, Lackman-Ancrenaz and Mohamed2005). The estimates of FST between Agnalazaha and the Manombo complex populations were higher, which may be attributed to the separation of the forest fragments by the Menatsimba River. However, the effective migrant analysis suggests that historic gene flow may have occurred among all of the sampled forests and fragments. This indicates that the anthropogenic grasslands and the Menatsimba River may not be, or have only recently become, barriers separating the Agnalazaha forest fragments from the Manombo forest complex. These patterns do not correspond well with the current boundaries or administration of the protected areas.
Reduction in genetic diversity
We detected trends, albeit lacking statistical significance, in the coastal populations that could indicate lower genetic diversity, providing some support for the expected relationship between population or habitat size and genetic diversity (Hedrick, Reference Hedrick2005; DiBatista, Reference DiBatista2008). In the coastal populations allelic richness and observed and expected heterozygosities were lower than those in the inland Vevembe population. A similar reduction in genetic diversity in discrete fragmented populations has also been described in the golden lion tamarin Leontopithecus rosalia (Gravitol et al., Reference Gravitol, Ballou and Fleischer2001) and golden-brown mouse lemur Microcebus ravelobensis (Radespiel et al., Reference Radespiel, Rakotondravony and Chikhi2008). Despite the lack of significance this trend of declining genetic diversity is of concern given the recent modification of these forest habitats by anthropogenic disturbance and natural stochastic events. We recommend further sampling but note that we genotyped > 10% of the estimated total population at Agnalazaha, for example, and thus the trends may be indicative of overall population characteristics.
In this study the FIS estimates did not differ significantly from zero although the estimate for the inland population was lower than for the fragmented coastal populations. Cyclone Gretelle struck these forest fragments less than three generations before the samples were collected, and one could expect recruitment problems in at least the first generation following the cyclone. Unexpectedly, we found that the lemurs sampled were not substantially more related than would be expected in a random sample of unrelated individuals. Assuming that any initial population reduction (e.g. Ratsimbazafy et al., Reference Ratsimbazafy, Ramarosandratana and Zaonarivelo2002) was random (as expected if caused by large-scale stochastic events) then, allowing a period of time for groups to either re-form or form for the first time, it is reasonable to consider that the youngest individuals in the population at the time of our sampling were second but not likely more than third generation offspring from the survivors of the event. This could certainly explain why routine mating among related individuals was not detected by either relatedness or inbreeding tests. However, mating among relatives should not be ruled out as a potential risk for future generations given the low estimated effective population sizes relative to the estimates of the population sizes from the surveys (Kalinowski & Waples, Reference Kalinowski and Waples2002) at Manombo and Agnalazaha compared to the estimate of effective population size of the larger and continuous Vevembe forest.
Genetic bottleneck effects
Only the coastal Agnalazaha population tested significantly for a genetic bottleneck under both the IAM and TPM models. This generally supports the expected relationship between past demographic events and habitat area or abundance (Agnalazaha is the smallest forest network in this study). Reduction in a genetic bottleneck signal can be lost rapidly in only a few generations (Luikart & Cornuet, Reference Luikart and Cornuet1998). This suggests that either the event that caused the bottleneck was isolated to the coastal forest population, was more recent within the estimated temporal window, or resulted in a more severe reduction in the effective population size than experienced by the other forest populations. Similar trends were observed in the Cross River gorilla Gorilla gorilla diehli (Bergl et al., Reference Bergl, Bradley, Nsubuga and Vigilant2008). In the early stages of a bottleneck alleles are lost more rapidly than heterozygosity (Kawamoto et al., Reference Kawamoto, Tomari, Kawai and Kawamoto2008), which is what we may be detecting in our study. Populations in fragmented forests are more susceptible to stochastic events, whereas populations in continuous forests generally have more habitat available and thus temporary dispersal or refuge options. The significant habitat modification and reduction in population size attributed to Cyclone Gretelle (Ratsimbazafy, Reference Ratsimbazafy2002) could have contributed to the bottleneck signal detected in the Agnalazaha population. However, there are other scenarios preceding or coinciding with the cyclone that should not be ruled out. For instance, the fragmentation of these coastal habitats may be associated with an absence of key ecological resources (Chiarello, Reference Chiarello2000), more intense human encroachment (Razakamaharavo et al., Reference Razakamaharavo, McGuire, Louis and Brenneman2009), or edge effects (Lehman et al., Reference Lehman, Rajaonson and Day2006a).
Small and finite populations are susceptible to genetic drift. This is critical when considering the fixation of deleterious alleles and the consequences for the population’s survival (Lande, Reference Lande1995). Small effective population sizes suggest that genetic representation is from only a limited number of individuals and thus there is less genetic variation (Whitlock, Reference Whitlock2000). In the coastal forest fragments the effective population sizes of E. cinereiceps were small relative to the populations sizes estimated from the transect surveys. The higher ratio of effective population size to survey population size in the interior forest of Vevembe may be due in part to the breeding population extending beyond the limits of the trail system. If a population has a low number of effective breeders then one should find elevated estimates for relatedness and inbreeding (Mills & Smouse, Reference Mills and Smouse1994). Hence, few ancestors are represented in the larger current population indicating a rapid expansion in a short time and a large number of alleles shared by common descent (Caballero, Reference Caballero1994). The substantial difference between the effective population size and total abundance estimated from the transect surveys at Manombo and Agnalazaha suggests rapid growth in a population where diversity has been recently depleted, the opposite of that in the Cross River gorilla populations (Bergl et al., Reference Bergl, Bradley, Nsubuga and Vigilant2008). Despite the reported initial decline, there appears to have been growth in E. cinereiceps populations at Manombo in the decade following Cyclone Gretelle (Johnson et al., Reference Johnson, Ingraldi, Ralainasolo, Andriamaharoa, Ludovic and Birkinshaw2011). However, the coastal populations remain at risk because of the low number of effective breeders and loss of genetic diversity. The inland Vevembe population is probably at a lesser risk of extinction as the effective population size is larger and appears to have remained stable over multiple generations.
Conservation implications
The inland Vevembe population has a relatively high estimated number of effective breeders and genetic diversity, and relatively low likelihood of a recent bottleneck event. Thus, the interior forest is a reservoir of diversity for E. cinereiceps. There are currently no protected areas in this region but this inland corridor has received consideration for higher conservation status under the recently proposed protected area system in Madagascar. Despite differences in habitat size, and probably quality, no significant differences in population density were detected between the inland forest and coastal forest fragments. However, the trend of diminishing genetic diversity in contiguous areas in the fragmented coastal populations is of potential concern. The subdivision in the Manombo population between the Special Reserve and Classified Forest could arise from natural substructure within the Classified Forest or from a refuge effect following forest damage in neighbouring fragments (Razakamaharavo et al., Reference Razakamaharavo, McGuire, Louis and Brenneman2009).
Nevertheless, the coastal populations show enough similarity and recent connectivity that all could be managed as a single population, with re-establishment of forest corridors to minimize the effects of genetic drift. This would increase the time to allelic fixation in the more fragmented subpopulations (Ezard & Travis, Reference Ezard and Travis2006). Similarly, given the evidence of past gene flow among inland and coastal habitats, conservation planners could consider all populations as a single metapopulation. This would be an effective means of maintaining overall genetic diversity of the species, including the distinct contributions from the coastal fragments.
In this study the combination of information on ecology and population density and abundance with population genetics has elucidated conservation concerns regarding declining genetic diversity and low effective population sizes in E. cinereiceps. A similar synthetic approach could be used to investigate population processes in other threatened primate species.
Acknowledgements
We thank two anonymous reviewers for useful comments. We are grateful to CAFF/CORE for permission to conduct this research in Madagascar. RAB, CAB and EEL wish to acknowledge the generosity of Bill and Berniece Grewcock for their support of student interns, and the Theodore F. and Claire M. Hubbard Family Foundation for their support of the Henry Doorly Zoo/Madagascar Biodiversity and Biogeography Project. Research was also supported by the Ahmanson Foundation (EEL), Primate Conservation (CI), Primate Action Fund (CI, SEJ), Conservation International (HEA), European Association of Zoos and Aquaria (FBR, JHR), Mulhouse Zoo (FBR, JHR), SeaWorld & Busch Gardens Conservation Fund (FBR, JHR), and the University of Calgary (CI, SEJ). This project was aided by the staff of the Institute for Conservation of Tropical Environments, Madagascar, Centre ValBio and Missouri Botanical Garden.
Appendices 1–2
The appendices for this article are available online at http://journals.cambridge.org
Biographical sketches
Rick Brenneman researches causes of population declines in threatened species using evaluation of population genetics. Steig Johnson specializes in ecology, biogeography, and conservation of lemurs in Madagascar. Carolyn Bailey provides molecular genetics, laboratory and writing support. Christina Ingraldi researches behavioural ecology, conservation and the effects of forest fragmentation on strepsirhine primates. Kira Delmore is interested in the maintenance of stability in a hybrid zone between two species of brown lemur. Tracy Wyman uses spatial analysis in epidemiology and climate change research. Hubert Andriamaharoa researches the feeding ecology and ranging behaviour of the grey-headed lemur. Fidy Ralainasolo researches the ecology of lemurs and collaborates with local village associations assisting in sustainable management of local forests. Jonah Ratsimbazafy researches the lemurs of Madagascar, with a special interest in the response of black and white ruffed lemurs to habitat disturbance. Edward Louis Jr leads research in systematics and biogeography of Malagasy primates, carnivores, bats, reptiles, amphibians and orchids.


