


Introduction
An understanding of the spatial variability and of the factors controlling the distribution of ions is essential for the interpretation of ion chemistry records from deep ice cores drilled at a single site. Snow-pit studies are a useful tool for the study of the spatial variability since we can directly compare variations in the snow chemistry with meteorological measurements and thus interpret variations in sources, transport and deposition processes. A number of different traverses and studies have been conducted to map the trends in chemistry over the Antarctic continent. Reference Mulvaney and WolffMulvaney and Wolff (1994) compiled the spatial variability of concentrations of major anions (Cl−, NO3-, SO4 2-) in Antarctic snow and firn. This study shows that there are still large areas of the continent where data are lacking.
In order to improve the coverage ofdata, a Swedish expedition visited the coastal area and the polar plateau in western Dronning Maud Land (DML) during the austral summer of 1993 94 (Fig. 1). This area of DML is of particular interest because it has been selected as a potential deep-drilling site by the European Project for Ice Coring in Antarctica. The traverse was performed as a part of the International Trans-Antarctic Scientific Expedition, The major objectives of the program include study of the spatial variability of ions, stable oxygen isotopes and snow accumulation and also the climate variability during the last 100-200 years using shallow firn cores. Both firn cores and snow samples from pils were collected during the expedition, and

Fig. 1. Map showing locations if the snow pits in western Dronning Maud Land, Antarctica.
in this paper we repon the results from the snow pits. The aims of the snow-pit study were to investigate the spatial variability of ions (Na+, K+, Mg2+, Ca2+, Cl−, NO3-, SO4 −, CH3SO3 −) and oxygen isotopes and to study the influence of different parameters such as altitude, distance from sources, temperature, snow-accumulation rate and aerosol properties on the spatial variability of the different ions. The spatial variability is particularly important when looking at different ratios such as the ratio between CH3SO3 − and SO4 2-.
Only a few studies of snow chemistry have been conducted in western DML. Major ions were measured from the coast to 120 km inland on the Riiser-Larsenisen ice shelf (Reference GjessingGjessing, 1984). One 20 m long firn core from the high-altitude plateau (75° S, 2°E) has been analyzed for major anions and cations (Isaksson, 1994). At a few stations along the coast of Antarctica, air samples of major chemical components have been measured in order to study seasonal cycles. At the German coastal station Georg von Neumayer in DML (Fig. 1) year-round measurements have been conducted since 1983 (Reference Wagenbach, Görlach, Moser and MiinnichWagenbach and others, 1988).
Site Description
The traverse starled in the coastal area on the Hat Riiser Larsenisen ice shelf (Fig. 1) and continued over the undulating ice surface northwest of the mountain range Heimefront-fjclla. There is an increase in altitude at Heimefronlljella of about 1000 m up to the high-altitude plateau, Amundsenisen. At Amundsenisen the surface topography is relatively Hal, and in part oflhis area sastrugi, typically a few meters long and 10-50 cm high, are frequent.
Table. 1. Site locations and general field data
The coring sites were chosen to cover as much distance as possible between the coast and the polar plateau in order to determine the spatial variability of ions and oxygen isotopes. Altogether, 14 cores were drilled to a depth of 10-30 m, and 1-2 m deep snow pits were dug at each drilling site. in this paper we present data from the 11 snow pits that have been analyzed so far, from 800 up to 3000 m a.s.l. distributed over a distance of about 700 km (Fig. 1; Table 11. Sin-altitudes vs distance from the coast are shown in Figure 2.
Previous glaciological studies in this coastal area have shown that the snow-accumulation rate decreases rapidly with increasing distance from the sea. from about 40 cm w.e. a−1 on the Riiser-Larsenisen ice shelf to >8 cm w.e.a−1 at 3000 m a.s.l. (Isaksson and Karlen, 1994a, b; Isaksson and others, 1996). Continuous snow radar measurements made along the same traverse route have revealed a large spatial variability in snow accumulation rate (Reference Richardson., Aarholt, Hamran, Holmlund and IsakssonRichardson and others, 1997). The radar surveys showed thai the accumulation rale varies considerably in the coastal region, which has an undulating topography. Even larger variations can be found in areas with a large altitudinal gradient, such as the grounding line and around Heimefronttjella. On the flat, high-altitude plateau the variations in accumulation are less pronounced (Richardson and others, 1997), The seasonal variation and frequency of precipitation is of importance for the snow record of wet scavenged atmospheric components. Accumulation rates from stake measurements in this area have indicated that only 3-23% of the total accumulation can be attributed to the summer season from December to February (Näslund and others, 1991).
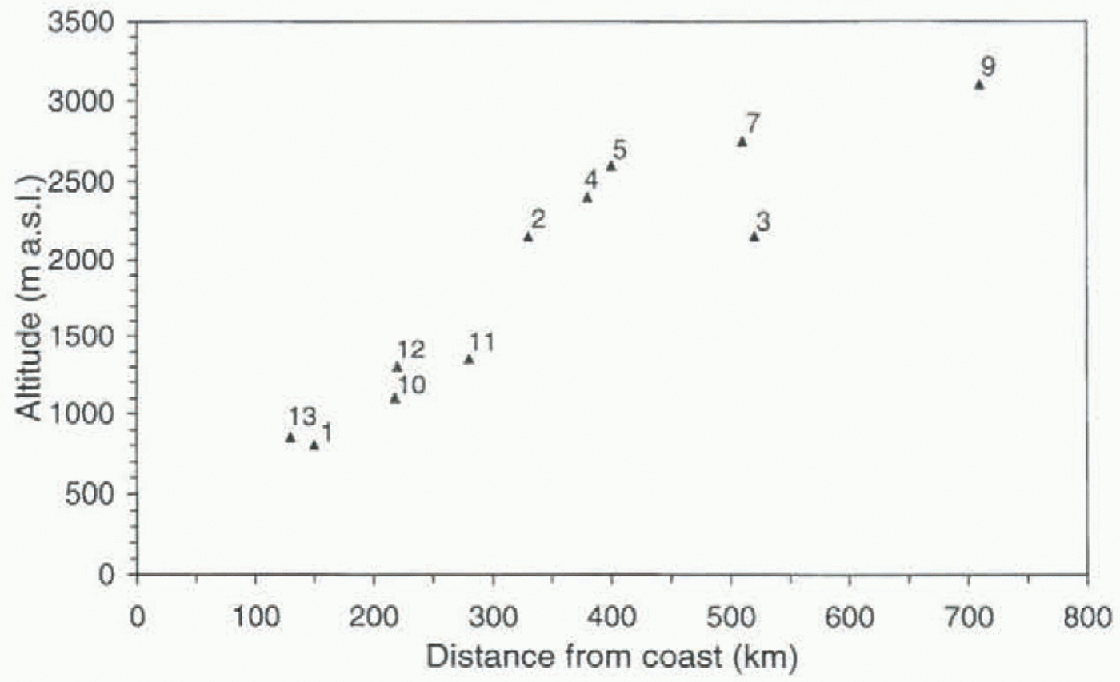
Fig. 2. Site altitudes (m a.s.l.) vs distance from coast (km). Locations of sites are given in Figure 1.
Sampling
At each coring site a shallow (1-2 m) snow pit was dug 100 m upwind from local contamination sources. The spoils were dumped in the downwind direction in order to avoid direct contamination. The sampling wall, al the upwind side of the pit, was cleaned by removing 15-20 cm with a shovel and an additional 4-5 cm with a scraper. The sampling was performed by personnel wearing clean suits, polyethylene gloves and face masks. All tools used for digging and sampling were made of Plexiglas or polyethylene, and were thoroughly washed with doublc-deionizcd water (resistivity >18MΩ) from a Milli-Q,system. Samples for ion analysis and stable oxygen isotope analysis wen- taken at 2 cm intervals, and for density measurements at 3 cm intervals. Samples for chemical analyses were collected in pre-cleaned (double-deionized water) 60 ml polypropylene bottles (Nalgene). The bottles were stored in a freezer (—15°C) during subsequent transport by ship to the freeze room (-25° C) at the Department of Meteorology, Stockholm University. Some of the samples for ion analysis were flown directly from Cape Town to the University of New Hampshire. All samples were kept frozen during transport and were melted just prior to analysis.
Analytical Methods
Ion concentrations were measured by ion chromatography (Dionex). Samples from snow pits 1 4 were analyzed at the University of New Hampshire, and samples from snow pits 5-13 were analyzed at the Department of Meteorology, Storkholm University. Comparisons were made between the two laboratories, and the results showed good agreement. Separator columns (AS4A), eluent 1.8 mM Na2CO3 and 1.7 mM NaHCO3, were used for analyses of anions (Cl−1, NO3- , SO4 2-), and CS12 columns with eluent 20 mM methane sulfonic acid were used for analyses of cations (Na+, K+, Mg2+, Ca2+). Methane sulfonate (CH3SO3 −, also commonly abbreviated MSA−) was analyzed separately on AS4 columns with eluent 7 mM NaOH and 100 mM NaOH or 0.5 m M NaHCO3. The average analytical error was estimated to be less than +10% for all ions reported.
Potassium concentrations are not reported for snow pits 5-13 due to insufficient separation from an unknown peak in the chromatogram. Neither are Ca2+ values reported for those pits, due to too high background concentrations.
The stable oxygen isotope analysis was performed by mass spectroscopy at the Department of Geophysics, University of Copenhagen. The ![]() value, expressed in ‰, describes the relative deviation of δl8O in the precipitation compared to Standard Mean Ocean Water (Reference DansgaardDansgaard, 1964). The measuring accuracy is better than 0.1‰.
value, expressed in ‰, describes the relative deviation of δl8O in the precipitation compared to Standard Mean Ocean Water (Reference DansgaardDansgaard, 1964). The measuring accuracy is better than 0.1‰.
Results and Discussion
General information for each snow pit is presented in Table 1, and chemical data for eight ions and ![]() are given in Table 2. Dating of the snow stratigraphy was performed using all available data on seasonal chemical variations. The depth of the snow pits varied between 1 and 2 m. At the coast 2 m of snow accumulate in about 2-3 years, while at high-altitude sites 2 m of snow accumulate in about 10-14 years. Thus, the mean concentrations represent snow accumulated over 2-14 years. in order to compare data from the same time period, a mean value for the two most recent years was calculated for each snow pit (in parentheses in Table 2). This 2 year mean value was found not to deviate more than 30% from the overall mean value, except for elevated mean values for NO3
− , SO4
2- and GH3SO3 in the snow pits from the high-altitude plateau (pits 2 5, 7 and 9). For NO3
− this is in accordance with suggested post-deposi-lional losses of HNO3 (Reference Neubauer and HeumannNeubauer and Heitmann, 1988) which lead to an increase of the NO3 concentration toward the surface. The elevated concentrations of SO4
2- in the upper snow layers can be attributed to the eruption of Mount Pinatubo in 1991, which greatly increased the stratospheric loading of SO4
2- aerosols over Antarctica during 1991-93 (e.g. Caccianni and others, 1993; Reference Hoffmann, Oltmans, Lathrop, Harris and VömelHoffmann and others, 1994; Reference Saxena, Anderson and LinSaxena and others, 1995), or to the change in circulation pattern during the 1991-93 El Niño event. The elevated concentrations of CH3SO3 can be attributed to the El Niño event. This connection between elevated CH3SO3 concentrations in Antarctic snow and El Niño circulation pattern was first suggesled by Reference Legrand and Fenict-SaigneLegrand and Feniet-Saigne (1991) based on a record from the South Pole. Both the volcanic signal and the signal attributed to the 1991-93 El Niño event have been observed in snow pits at the South Pole (Reference Dibb and WhitlowDibb and Whitlow, 1996).
are given in Table 2. Dating of the snow stratigraphy was performed using all available data on seasonal chemical variations. The depth of the snow pits varied between 1 and 2 m. At the coast 2 m of snow accumulate in about 2-3 years, while at high-altitude sites 2 m of snow accumulate in about 10-14 years. Thus, the mean concentrations represent snow accumulated over 2-14 years. in order to compare data from the same time period, a mean value for the two most recent years was calculated for each snow pit (in parentheses in Table 2). This 2 year mean value was found not to deviate more than 30% from the overall mean value, except for elevated mean values for NO3
− , SO4
2- and GH3SO3 in the snow pits from the high-altitude plateau (pits 2 5, 7 and 9). For NO3
− this is in accordance with suggested post-deposi-lional losses of HNO3 (Reference Neubauer and HeumannNeubauer and Heitmann, 1988) which lead to an increase of the NO3 concentration toward the surface. The elevated concentrations of SO4
2- in the upper snow layers can be attributed to the eruption of Mount Pinatubo in 1991, which greatly increased the stratospheric loading of SO4
2- aerosols over Antarctica during 1991-93 (e.g. Caccianni and others, 1993; Reference Hoffmann, Oltmans, Lathrop, Harris and VömelHoffmann and others, 1994; Reference Saxena, Anderson and LinSaxena and others, 1995), or to the change in circulation pattern during the 1991-93 El Niño event. The elevated concentrations of CH3SO3 can be attributed to the El Niño event. This connection between elevated CH3SO3 concentrations in Antarctic snow and El Niño circulation pattern was first suggesled by Reference Legrand and Fenict-SaigneLegrand and Feniet-Saigne (1991) based on a record from the South Pole. Both the volcanic signal and the signal attributed to the 1991-93 El Niño event have been observed in snow pits at the South Pole (Reference Dibb and WhitlowDibb and Whitlow, 1996).
The ratio between Cl− and Na+ (Fig. 3) varies from a minimum of 1.16, close to the sea-water molar ratio, up to single maximum values of 14 at some sites. No surplus of Na compared to Cl− is noted in any sample. We chose to use Na+, in accordance with most other investigators of Antarctic snow and ice chemistry, as the sea-salt indicator for calculation oft he non-sea-salt (nss) fraction of the total concentrations of K+ Mg2+, Ca2+ Cl− and SO4 2-. The non-sea-salt fraction for each ion is calculated by assuming a mean sea-water molar ratio of 0.022 for K+/Na+, 0.23 for Mg2+/Na+, 0.044 for Ca2+/Na+, 1.16 for Cl−/Na+ and 0.12 for SO4 2+/Na+. The ratio is multiplied by the actual Na+ concentration in each sample, and the product is then subtracted from the total concentration of the specific ion (with all concentrations expressed in μeql−1), yielding the nss fraction of the specific ion. The calculated average sea-salt fraction at sites northeast of Heimcfronlfjclla is 80% for K+. Mg2+, Ca2+ and Cl− and 15% for SO4 2-. At sites on the polar plateau the calculated sea-salt fraction is less, on average 50% for K+ and Ca2+, 80% for Mg2+, 70% for Cl− and 5% for SO4 2-. This implies that other sources than sea spray may be important not only for SO4 2- but also for K+, Mg2+, Ca2+ and Cl−, or that fractionation of sea-salt aerosol occurs during transport inland (Mulvaney and others, 1993). A reaction between acid aerosols and sea salt producing gaseous HCl, combined with more efficient transport and deposition of HCl gas to the snow, has been suggested as the major source of nss-CT in Antarctica (Legrand and Delmas, 1988).
Table. 2. Chemical data with mean ion concentrations (in μeql−1) and δ18O (in ‰). R is the molar ratio of (CH3SO3 − / CH3SO3 −+ nssSO4 2-). This ratio and the Cl−/Na+ molar ratio are given as mean values of individual ratios. in parentheses are the mean values for the years 1992 and 1993

Fig. 3. Cl−/Na+ molar ratio vs depth for a coastal site (I) and a high-altitude plateau site (4). The summer .seasons in the oxygen isotope record are marked with vertical lines.
Oxygen isotopes and snow accumulation rates
Annual dating of the snow stratigraphy with the help oi the δ18O profiles was performed by counting the less negative tive amounts of the different stable oxygen isotopes in the snow are to a large degree dependent on the temperature during formation of the precipitation (Dansgaard and others, 1973), the mean δ18O value for each pit is an indicator of the mean annual temperature at that site. The mean δ18O and the 10 m borehole temperature at each site are plotted vs altitude in Figure 4. The significant correlation (r2 = 0.98, σ = 9.22) between the mean δ18O and the 10 m borehole temperature suggests that the δ18O mean values from this area are suitable as proxy-temperature indicators.
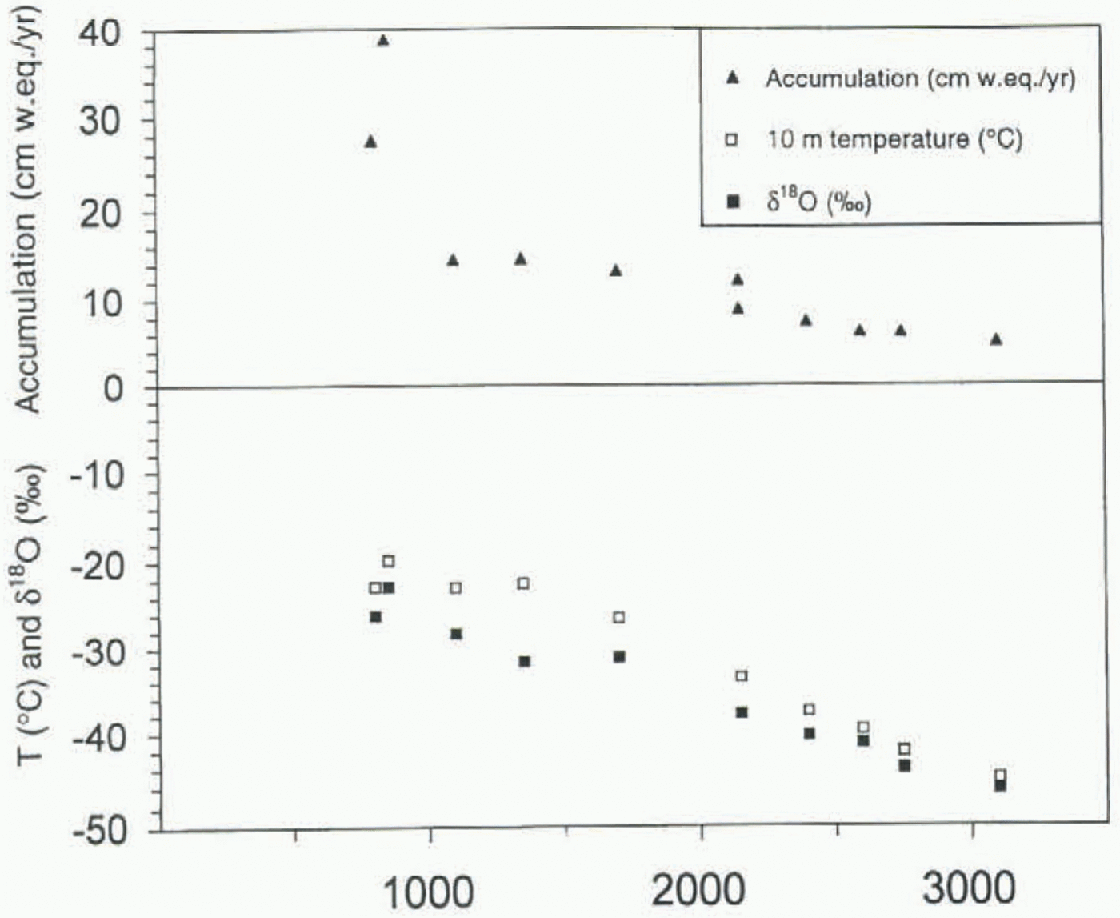
Fig. 4. The 10 m depth temperature (°C mean δ18O ‰) and mean accumulation late (cm w.e. a−1) at each site vs altitude.
The mean δ18O/10 m temperature gradient for this data-set is 0.91‰ C−1. in another dataset using 10m firn cores from the Riiser-Larsenisen ice shelf and up to Amundsenisen, the gradient was 1.16‰°C−1 (Isaksson and Karlen, 1994a, b). This is higher than the 0.75‰ C −1 gradient thai is generally used in East Antarctica (Reference Lorius and MerlivatLorius and Mcrlivat, 1977). If only the sites above 2000 m are used, the mean δ18O/10m temperature gradient becomes 0.74‰ °C−1 (r2 = 0.98, σ=3.11). in agreement with our previous studies in the area, we lind the better-defined 10 m temperature/mean δ18O relationship at high-altitude sites the result of a more stable (i.e. belter-mixed) moisture source than at more coastal sites (Isaksson and Karlen, 1994a, b; Isaksson and others, 1996). in a study by Reference Qin, Petit, Jouzel and StievenardQin Dahe and others (1994) it was also observed that on the polar plateau the gradient of the mean δ18O/10 m temperature regression line could shift. These studies show that it is important to be aware of the regional character of the mean δ18O/10m temperature gradient when using δ18O mean values as proxy-temperature indicators.
Calculation of the annual accumulation was done using the summer peaks in the δ18O record or, when this was indistinct, the seasonal variation in the ion records.There was a large variation (60%) in accumulation between years. However, the mean accumulation for each pit (table 1) was in agreement with previous accumulation measurements in the area Isaksson and Karlen. 1991a, b; Isaksson and others, 1996). The spatial trend shows decreasing values with increasing altitude I Fig. 4).
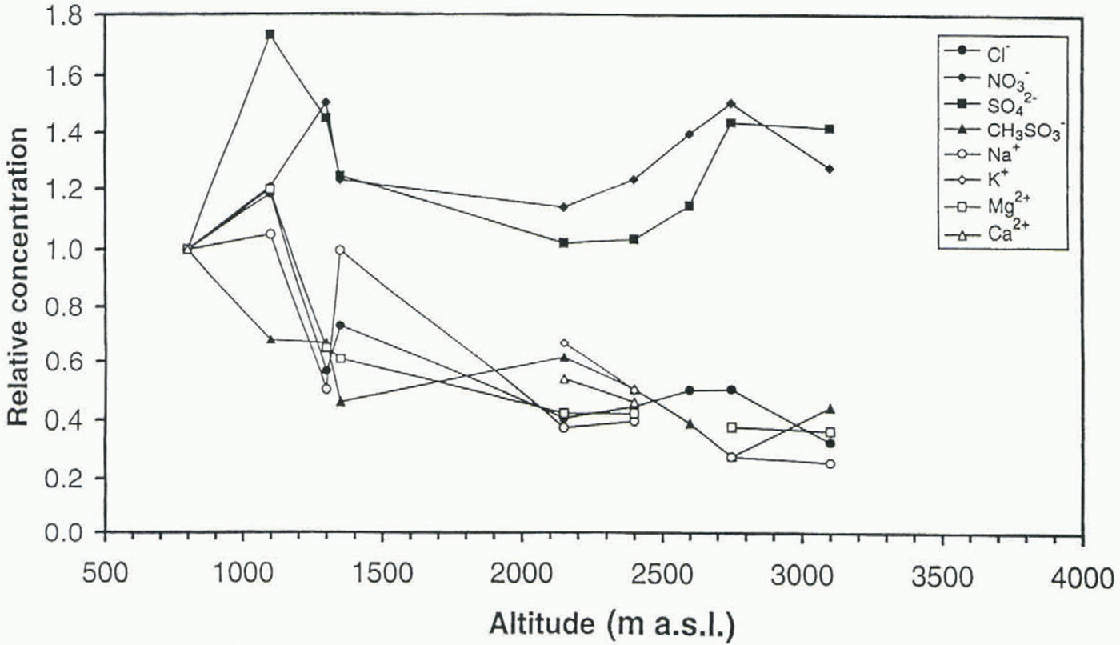
Fig. 5. Relative concentrations of ions at each site vs altitude.
Spatial variability of ions
Spatial variability of the ion concentrations in the snow are, except for post-dcpositional processes, determined by the relationship between different parameters such as altitude, distance from coast, temperature, accumulation rate and aerosol properties. in this area the distance from the coast and the altitude are positively correlated, as shown in Figure 2. The relationship between temperature (and δ18O), ac-cumulation rate and altitude is evident from Figure 4. The higher the altitude, the lower the temperature and the lower the accumulation rate. Thus, the parameters are not independent of each other.
The different ions have very different absolute concentrations and they have therefore been plotted as relative concentrations and deposition fluxes in order to compare the spatial trends. The deposition fluxes were calculated based on the accumulation rate at each site. The concentrations have been normalized (cone, at site X/conc. at site 1) to the most coastal site. Relative mean concentration against altitude for each snow pit and ion is shown in Figure 5. The ions can be divided into two different groups, the sca-salt elements (Na+, K+, Mg2+, Ca2+, Cl−) and CH3SO3 in one group, and NO3 − and SO4 2- in the other group. The sea-salt elements and CH3SO3 − show a decreasing trend in concentration towards the high-altitude plateau, with a more rapid decline at the mountain range Heimefronlfjella (Fig. 5), which most likely acts as an abrupt barrier for the maritime air masses. Nitrate and sulfate show a constant or slightly increasing trend with increasing altitude. The same division into two groups of ions is evident when looking at the relative deposition fluxes (Fig. fi). Because of the almost
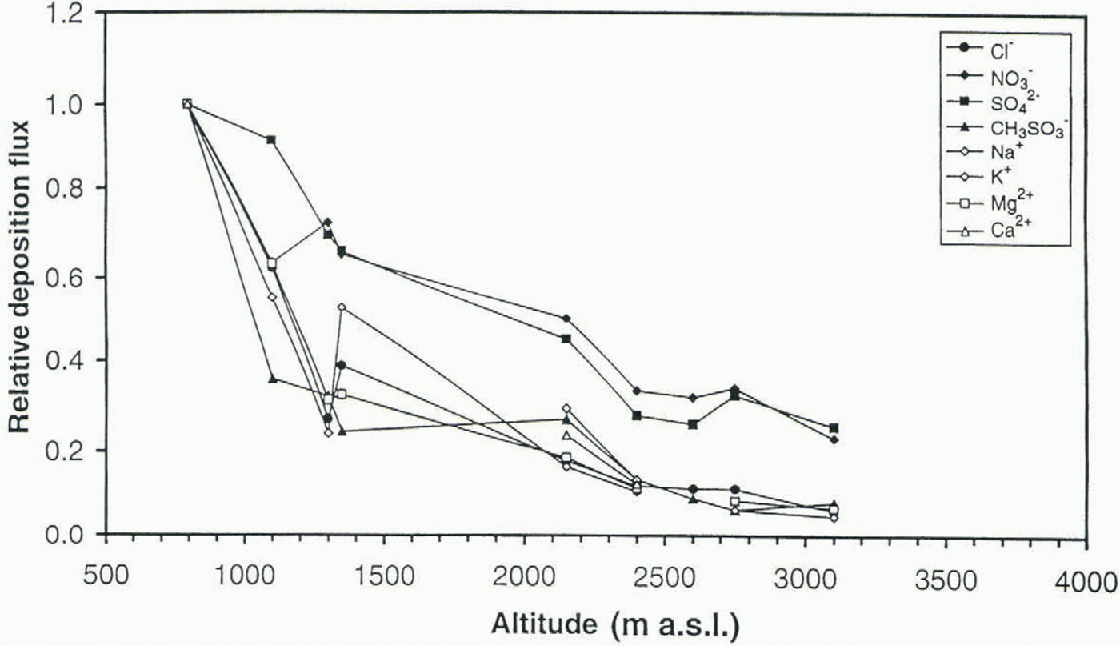
Fig. 6. Relative deposition fluxes of ions at each site vs altitude.
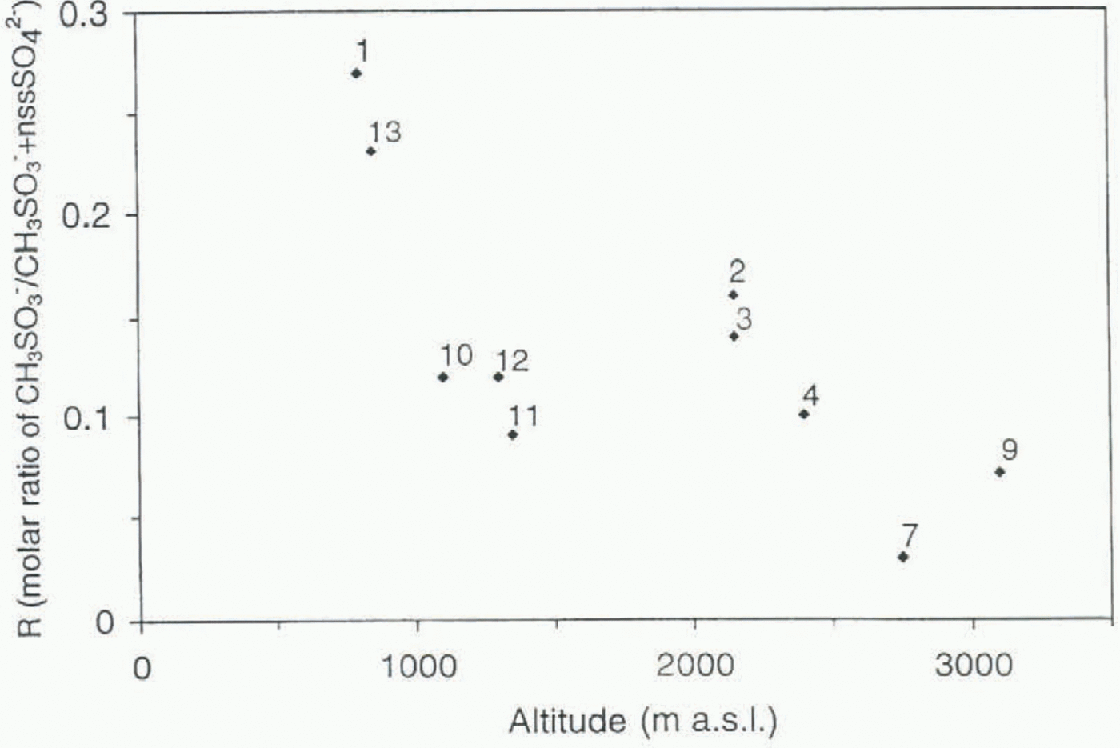
Fig. 7. Mean value of the molar ratio R(CH3SO3 −/(CH3SO−+nssSO4 2-)) at each site vs altitude.
linear relationship in this area between the altitude and the distance from the sea (Fig. 2), the same pattern is obtained when plotting the concentrations against the distance from the sea. Mulvaney and Wolff (1994) found a more rapid decrease in concentrations with distance from the sea in an area with steep coastal topography compared to an area with open topography as on an open ice shelf. This indicates thai the altitude has more influence on the concent ral ions of ions in the snow than the distance from the sea, which can be interpreted as meaning that different air masses are influencing different altitudes. The local marine air masses are only reaching a certain altitude, while long-range transported air masses are influencing the liigh-aliilude plateau.
Both SO4 2- and CH3SO3 are products of marine biogenic production through the oxidation of dimethyl sulfide (DMS) released from phytoplankton. Sulfate may also originate from sea spray, volcanic emissions and stratospheric input, while CH3SO3 − only originates from DMS oxidation. The CH3SO3 − fraction of the sulfur species, commonly denoted R (defined as CH3SO3 −/(CH3SO3 − + nssSO4 2-) (Reference Whung, Saltzman, Spencer, Mayewski and GundestrupWhung and others, 1994)) varies within a range of 0.04-0.9 on the coast, and of 0.01 -0.5 on the high-altitude plateau. The value of R in Antarctic snow has been suggested (Saigne and Legrand, 1987; Legrand and others, 1992) to indícale the location for the influencing marine source area at each site. The partitioning between CH3SO3 − and SO4 2- during DMS oxidation is inferred (Reference Berresheim.Berresheim, 1987) to be temperature-dependent from laboratory oxidation studies (Reference Hynes., Wine and SeminesHynes and others, 1986). This temperature dependency is thought to be responsible for the observed latitudinal gradient R (Reference Bates, Lamb, Guenther, Dignon and StoiberBates and 01 hers, 1992), with higher A values found at higher latitudes.
The highest mean values for R are found at the most coastal sites, with a maximum during summer, and the lowest furthest inland (Fig. 7; Table 2). This is in accordance with a local source for coastal sites, a high-latitude source which gives rise to a high R value and a maximum during summer. The iniensity of the sunlight is probably more important than a complete disappearance of the sea ice, which explains why the peak season is earlier than for the sea-salt elements. The high-altitude plateau is influenced by long-range transport, and thus the lower R value could be explained by a marine biogenic source at lower latitudes. However, a lower R value could also be due to a larger influence of other sources for sulfate, like volcanic and anthropogenic sources at lower latitudes. The effect on the R value of the Mount Pinatubo eruption is clearly seen in the dataset. However, one should he aware of the total dominance of the 1991-93 El Niño event in the coastal records, which could bias our interpretation of spatial differences.
Conclusions
We have presented depth profiles of eight ions and δ18'O from 11 snow pits (1-2 m deep) in western Dronning Maud Land to reveal spatial variations in snow chemistry for this part of Antarctica where data are sparse. The depth profiles span 2-14 years. The δ18O values from this area are found to be suitable as proxy-temperature indicators with a δ18O/T gradient of 0.91‰ °C−1 (r2 = 0.98).
The spatial variability of the ions can be divided into two groups: one with sea-salt elements (Na+, K+, Mg2+, Ca2+, Cl−) and methane sulfonate, and the oilier with nitrate and sulfate. For the first group the concentrations decrease, and for the second group the concentrations are constant or increase with increasing altitude and increasing distance from the coast, as well as with decreasing temperature and decreasing accumulation rate.
This pattern suggests that the sources for sea-salt elements and methane sulfonate are more local, whereas the sources for nitrate and sulfate are a mixture of local and long range transport. Although methane sulfonate and sulfate have one source in common, DMS oxidation, they show different spatial variability. This means that the ratio between methane sulfonate and sulfate should be used with caution to describe the location of the DMS source.
Acknowledgements
This traverse in the field was supported by SWEDARP. E. Huss assisted with drilling and sampling activities. The project was financed by the Swedish Natural Science Research Council. Grants for analyzing snow samples were received from Carl Mannerfelts fond, Lillcmor och Hans Wison Ahlmanns fond for geografisk forskning, Stiftelsen Ymer-80 and the Swedish Society for Anthropology and Geography (SSAG). Valuable comments on the manuscript were made by C. Richardson andJ.-O. Näslund.


