


I. INTRODUCTION
Dimethyl carbonate (DMC) is an important chemical for the chemical industry, used as a methylating agent and as a volatile organic compound (VOC) exempt solvent. Its high dielectric constant, chemical stability and ability to dissolve ethylene carbonate made it one of the more common solvents used in commercial lithium-ion battery electrolytes. It has a relatively high melting point of 277 K and even when in a eutectic mixture with ethylene carbonate freezes out around 266 K (Ding et al., Reference Ding, Xu and Jow2000). This has obvious implications for the conductivity of the electrolyte at low temperature and subsequent impact on the operation of any battery using such a DMC-containing electrolyte in a cold climate. Consequently, the structure and phase behavior of solid dimethyl carbonate are of particular interest when studying low-temperature performance of electrolytes. A literature calorimetry study (Ding et al., Reference Ding, Xu, Zhang and Jow2001) identified a solid–solid phase transition at around 210 K, so a diffraction study of crystalline DMC is expected to reveal at least one phase transition.
A study of DMC using a custom liquid nitrogen cryostream cooler between 90 K and room temperature with a laboratory X-ray powder diffractometer (Whitfield and Davidson, Reference Whitfield and Davidson2010) did indeed find a phase transition in the temperature region identified by Ding et al. (Reference Ding, Xu, Zhang and Jow2001). Despite the addition of ground quartz inside the 1 mm quartz capillary as additional nucleating sites, data from repeated crystallizations were not reproducible and appeared to exhibit severe preferred orientation. Indexing could be carried out and a potential structure subsequently identified from the data collected at 90 K, but attempts using data above the phase transition were not successful.
Even with prior studies of other systems where data were reproducible (Whitfield et al., Reference Whitfield, Le Page, Abouimrane and Davidson2008), the preferred orientation induced via in situ crystallization with the laboratory instrumentation was significant. The co-axial cooling and subsequent temperature gradient was a likely contributing factor. The large sample volumes and differing sample environments at neutron facilities offered a potential way to manage such problems. The increased thermal mass of a larger sample could adversely affect the achievable cooling rate, leading to larger crystallites, but it was felt the improved particle statistics may lead to an overall improvement in data quality. A fully deuterated sample of DMC was chosen for the neutron experiment in order to avoid the data-degrading, incoherent scattering from a hydrogenous sample. Neutron facilities routinely make use of cryogenic sample environments, so the sample temperatures achievable are much lower than those via a liquid nitrogen cryostream cooler.
II. EXPERIMENTAL
The data were collected using the POWGEN time-of-flight (TOF) neutron powder diffractometer at the Spallation Neutron Source, Oak Ridge National Laboratory, USA (Huq et al., Reference Huq, Kirkham, Peterson, Hodges, Whitfield, Page and Hügle2019). The 2 g sample of 99 atom% enriched d6-DMC (CDN isotopes, Quebec, Canada) inside a helium-backfilled 6 mm vanadium can was crystallized in situ with silica aerogel as a nucleating agent dispersed in the liquid. The PAC 24-position sample changer was utilized with an accessible design temperature range of 8–300 K. A 1 Å wide band centered on 1.5 Å yielded an accessible d-spacing range of 0.49–14.5 Å. Non-isothermal data were collected using a 1 K per minute ramp rate utilizing neutron event-mode temperature-binning (Granroth et al., Reference Granroth, An, Smith, Whitfield, Neuefeind, Lee and Zhou2018) to map the phase transitions. Isothermal datasets were collected at selected temperatures for improved statistics for refinement and to minimize thermal gradients.
The analyses of the diffraction data were carried out using TOPAS version 6 (Coelho et al., Reference Coelho, Evans, Evans, Kern and Parsons2011). Indexing of the raw data was done using iterative least-squares LSI-index (Coelho, Reference Coelho2003). Simulated annealing using a z-matrix rigid body with idealized bond angles was used to find the starting structure model for refinement. A preferred orientation correction was applied during the simulated annealing as previously described by Whitfield (Reference Whitfield2009). Refinements maintained the z-matrix description with the addition of bond rotations where they were desirable for the particular structure. Refinement fits are displayed using the pdCIFplotter program (Rowles, Reference Rowles2022) from generated pdCIF files. Refined parameters included the scale factor, cell parameters, peak broadening, background, D/H ratio (ordered phases only), symmetry-allowed distortions, sample displacement (DIFA), and isotropic displacement parameters. Element B iso values were restrained following the overall C 2v symmetry of the DMC molecule. A number of single peaks were used to assist in modeling the elevated background of the disordered Ibam phase.
Density functional theory (DFT) fixed unit cell optimization of the ordered structures were carried out using version 7 of the Quantum Espresso (Giannozzi et al., Reference Giannozzi, Andreussi, Brumme, Bunau, Buongirno, Calandra and Car2017) plane-wave code with the B3LYP hybrid functional with DFT-D3 dispersion correction (Grimme et al., Reference Grimme, Antony, Ehrlich and Krieg2010). Final refinements of the DFT-optimized structures described as z-matrices were carried out versus the experimental diffraction data. The DFT-optimized molecular conformation was utilized for the z-matrix rigid bodies for all the other refinements with that specific space-group. The refinement for the disordered Ibam structure used the DFT-optimized z-matrix conformation from the ordered Pbam structure.
III. RESULTS AND DISCUSSION
The sample crystallized immediately upon loading into the sample environment. On examination of the final data (Figure 1), it became apparent that there was an additional, previously unreported phase transition at a lower temperature than accessible with a liquid nitrogen cryostream. The candidate space-groups for each phase with increasing temperature were Pbca, Pbcm, and Ibam. Pawley refinements of the binned non-isothermal data showed a progressive increase in normalized cell volume with increasing temperature (Figure 2). The space groups are related by group–subgroup relationships so both 1st and 2nd order transitions are allowed via Landau theory (Landau, Reference Landau2008).

Figure 1. Stacked plot showing isothermal TOF data at different indicated temperatures for d6-dimethyl carbonate. The different color labels designate the different structures to highlight the transitions. * marks a reflection that disappears in the Pbca → Pbcm phase transition, and # marks a corresponding reflection for the Pbcm → Ibam phase transition.
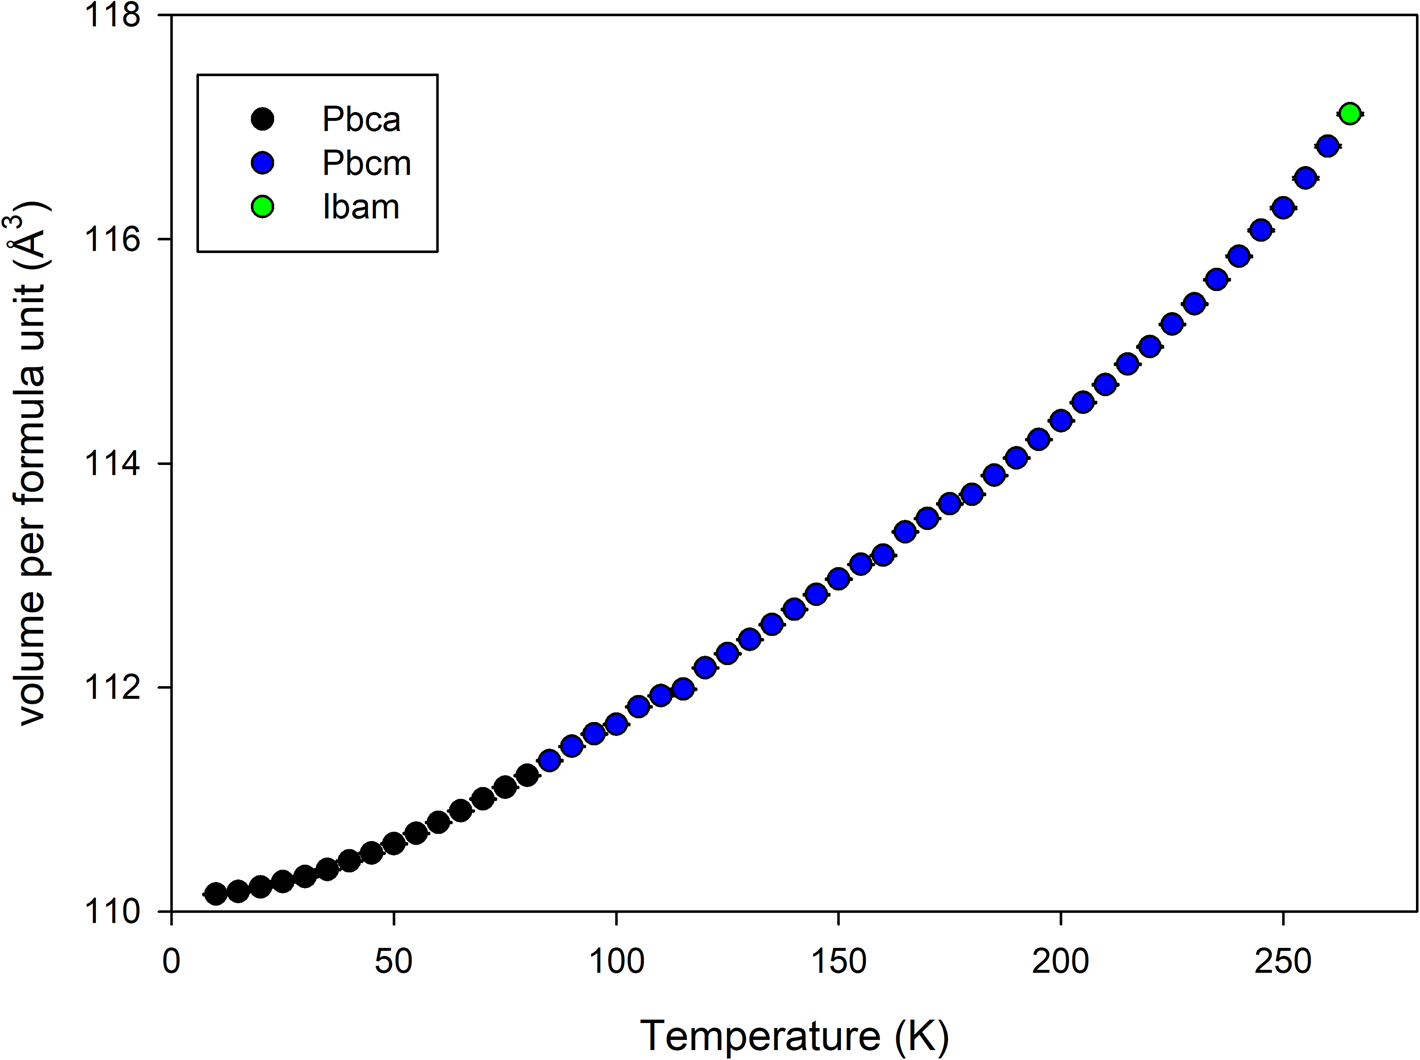
Figure 2. Volume per formula unit from Pawley refinement of non-isothermal data collected on heating at 1 K per minute between 10 and 270 K binned every 5 K.
With TOF data, it would have been desirable to extract anisotropic displacement parameters (ADPs), and to this end a refinement with the 8 K dataset using Translation-Libration-Screw (TLS) restraints (Schomaker and Trueblood, Reference Schomaker and Trueblood1968) was attempted. The ellipsoids from this refinement under best possible conditions were unreasonably oblate, so isotropic displacement parameters were used throughout in results presented. The high degree of intensity correlations with the spherical harmonics preferred orientation coefficients probably contribute to the inability to extract reasonable ADPs. The texture in the samples as indicated by the texture indices (Bunge, Reference Bunge1982, 88–90) was very high as was found previously with the laboratory X-ray data, but the larger volume of sample for the neutron data significantly improved the particle statistics.
The Rietveld refinement difference plots for the data collected at 8, 82, and 260 K are shown in Figures 3–5 as produced by the pdCIFplotter program (Rowles, Reference Rowles2022). The backgrounds with increasing sample temperature exhibit the expected growth of broad, periodic features in the low d-spacing region from thermal diffuse scattering. The higher backgrounds impact the calculated R wp residual, contributing to the much lower R wp value for the 260 K data refinement in Figure 5. The fits are reasonable but not as good as usually obtained with TOF neutron data. The suspicion is that the poor particle statistics with large crystallites observed in the earlier X-ray study with non-deuterated h6-DMC (Whitfield and Davidson, Reference Whitfield and Davidson2010) also occurred with the neutron samples, although limited beamtime made repeated crystallization cycles as carried out during the X-ray study impossible. The X-ray study using transparent capillaries during crystallization allowed for observation of the resulting large, elongated crystallites via the alignment scope, but no such observations were possible inside opaque vanadium sample cans within the PAC sample changer. It should be noted that the design characteristics of POWGEN produce powder diffraction datasets with counting statistics heavily weighted to the backscattering detectors, i.e. at low d-spacing values. The cumulative χ 2 curves in Figures 3–5 are an indicator of this as the largest misfits visible in the difference plots have a minor effect on the least-squares minimization, the region < 1.5 Å having the largest impact.

Figure 3. Refinement fit for the Pbca structure at 8 K.

Figure 4. Refinement fit for the Pbcm structure at 82 K.

Figure 5. Refinement fit of the Ibam structure versus the data at an indicated temperature of 260 K. See main text for discussion about possible temperature calibration issue for this dataset.
The orthorhombic Pbca crystal structure refined from the 8 K data is shown in Figure 6. The molecules are arranged in a layered manner along the c-direction in an alternating manner to minimize steric interactions between the bulky methyl groups. No “conventional” hydrogen bonds involving hydroxide, amine, etc., can exist in the DMC structure. However, methyl hydrogens can and do form hydrogen bonds despite being far less polar (Steiner, Reference Steiner2002). C–H⋯O bonds with lengths ranging from around 2.3 to 2.6 Å and angles from ~120° to 175° occur in the 8 K DMC structure. The shorter and stronger interactions occur with adjacent molecules in the same a–b plane. Hydrogen bonds involving methyl groups are weaker and less directional than more “conventional” hydrogen bonds (Steiner, Reference Steiner2002). In the lowest energy structure, the DMC molecules arrange themselves so that two out of three hydrogens on each methyl group are weakly bonded to adjacent DMC molecules.

Figure 6. View of the low-temperature Pbca crystal structure of d6-DMC refined using data at 8 K. The intermolecular C–H⋯O hydrogen bonds are indicated using the dashed orange lines. The isotropic displacement parameters are plotted at 50% probability. The deuterium atoms are labelled “H” to improve compatibility with the drawing package.
The Pbcm crystal structure refined using the 82 K data is shown in Figure 7. The arrangement in terms of alternating orientations along the c-direction is broadly similar to that of the Pbca structure except that the molecules now possess a mirror plane in the a–b plane. This leads to a halving of the a lattice parameter and reduction from eight DMC molecules in the unit cell to four. The hydrogen bond interactions with other molecules in the same a–b plane are largely unaffected but the longer-range C–H⋯O interactions tying the molecules together in the c-direction increase from ~2.6 Å at 8 K to ~2.9 Å, exceeding the sum of the van der Waals radii and effectively breaking the bonds.

Figure 7. View of the intermediate temperature Pbcm crystal structure of d6-DMC refined using data at 82 K. The intermolecular C–H⋯O hydrogen bonds are indicated using the dashed orange lines. The isotropic displacement parameters are plotted at 50% probability. The a lattice direction is orientated vertically to match Figure 6.
The Ibam crystal structure refined using the 260 K data is shown in Figure 8. The sheer number and overlapping atomic sites hide the nature of the disorder of the DMC molecules so the disorder around a single C(4) atom is shown in Figure 9. The C(4) atom sits on the special 4c Wyckoff position. The disorder of the other non-deuterium atoms is generated by their 8-fold symmetry generator (8j Wyckoff position), while the almost spherical smearing of the deuterium atoms is symmetry-generated from their 16-fold general 16k positions. Each deuterium position is therefore only a quarter-occupied, effectively severing the already weak hydrogen bonding interactions between the DMC molecules. Given that sufficient energy was available to overcome the rotational barrier and flip the DMC molecule by 180° it is an interesting question as to whether a rotor model along the line C(5)–C(6) may be a realistic option, although the oxygen atoms of adjacent molecules would approach < 1 Å with full rotation. Using an approximate starting point via a rotation of the z-matrix by 45° and reducing the occupancies of the previously 8-fold atoms to 0.25 such a possibility was examined. The starting model did not fit the data and the structure quickly approached the previous planar geometry for the carbon and oxygen atoms of Figure 9. The refinement stabilized with a slightly improved R wp of 2.47% and residual rotation of 13°, resulting in the disorder seen in Figure 10. The same effect of overlapping oxygen positions could be achieved using anisotropic thermal motion described with anisotropic displacement parameters without additional positional disorder. It is felt that the improvement in fit to the data was insufficient to warrant additional complexity in the proposed Ibam structure model.

Figure 8. View of the high-temperature Ibam crystal structure of d6-DMC refined using data at an indicated 260 K. See text for discussion about temperature calibration issue. The isotropic displacement parameters are plotted at 50% probability. The unit cell is orientated such that the a lattice direction is vertical to match Figures 6 and 7.

Figure 9. View of the disorder around the C(4) site in the high-temperature Ibam crystal structure of d6-DMC. The isotropic displacement parameters are plotted at 50% probability.

Figure 10. Resulting disorder when the DMC z-matrix is allowed to refine with a rotation along its long axis in the refinement of the Ibam structure. The isotropic displacement parameters are plotted at 50% probability.
In order to more clearly show the nature of the low-temperature phase transition, Figure 11 shows the Pbca (8 K) and Pbcm (82 K) structures aligned (viewed along the b-direction in both cases) with an overlapped region. The canting of the molecules that occurs on cooling through the low-temperature transition in clearly seen. This type of order–disorder transition is not uncommon and compatible with a continuous 2nd order phase transition. The Pbca–Pbcm transition occurs when the canting of the DMC molecule out of the a–b plane disappears. Figure 12 shows the rotation angle around the Pbca b-axis direction of the plane of the DMC molecule away from the unit cell a–b plane. The rotation angle reaches 0° between 45 and 50 K, indicating the phase transition occurs in this region. The exact temperature may be subject to minor error due to the 1 K per minute ramp rate used during collection of the parent dataset but not expected to exceed the 5 K temperature resolution (i.e. 5 min time resolution) in the extracted datasets.

Figure 11. Representation showing how the Pbca structure relates to the Pbcm structure. Both crystal structures are viewed along the b-direction. The canting observed in Pbca (right) is replaced by a mirror plane in Pbcm (left).

Figure 12. Rotation around the b-axis direction of the DMC molecule out of the a–b plane in the Pbca structure every 5 K using temperature-binned data. The a–b plane in Pbca corresponds to the mirror plane of the Pbcm space-group.
Figure 13 shows a similar view to Figure 11 but highlighting the disorder in the Ibam (260 K) structure compared to the intermediate temperature Pbcm structure. The viewpoint in Figure 13 gives the illusion of 4-positional rotational disorder in the Ibam crystal structure which is not the case. The view in Figure 14 gives a more complete picture of the nature of the disorder in the Ibam phase. The disordered DMC units as seen previously in Figure 9 are stacked in an alternating manner in the c-direction with each rotated about 83° with respect to each other to minimize steric interactions between adjacent methyl groups.

Figure 13. Representation showing how the Pbcm structure relates to the Ibam structure. In this instance, the Pbcm structure refined from a 210 K dataset is used for a closer match in temperature.

Figure 14. View of the Ibam structure highlighting the nature of the disorder within the unit cell and alternating orientation of the disordered DMC “units” when moving up in the c-direcion.
Unfortunately, it became apparent that the sample environment used for the experiment had a significant nonlinear temperature calibration error that affected the higher temperature data in particular. The extent of the calibration error was such that the sample did not melt on heating to 300 K. The indicated sample environment temperature for the data of the high-temperature Ibam structure was 260 K. However, the Pbcm phase clearly persists in Figure 15 far above the known transition temperature of 210 K (Ding et al., Reference Ding, Xu, Zhang and Jow2001; Ding, Reference Ding2004). It is estimated that the actual sample temperature for the Ibam refined data was 220–230 K. Some variation in melting point from an isotope effect is possible, but the expected difference in melting point between hydrogenous and deuterated DMC would be a maximum of 3–4 K rather than 30–40 K. It is understood that the calibration closer to the 8 K base temperature of the PAC sample changer had been checked for user magnetic structure studies using a low-temperature phase change material, but the calibration closer to ambient temperature had not been verified prior to user operations by SNS staff. Consequently, there is high confidence in the accuracy of the temperature for the 8 K data, and the indicated temperature for the 82 K data temperature is likely to be close. The final atomic coordinates for the 8, 82, and estimated 220 K structures are given in Tables I–III.

Figure 15. Closer examination of the raw data across the Pbcm to Ibam phase transition. The persistence of the Pbcm reflection at 95 000 μs demonstrates the deficiency in the temperature calibration in this regime closer to ambient conditions.
TABLE I. Atomic coordinates of d6-DMC at 8 K.

All total occupancies = 1.
TABLE II. Atomic coordinates of d6-DMC at 82 K.

All total occupancies = 1.
TABLE III. Atomic coordinates of d6-DMC at an estimated 220 K (260 K indicated).

Total occupancies = 1.
IV. CONCLUSION
A specimen of fully deuterated dimethyl carbonate has been crystallized successfully in situ inside the POWGEN time-of-flight neutron powder diffractometer, and diffraction data collected down to the base temperature of 8 K. Two phase transitions, the lower temperature transition previously unreported were observed. The three resulting crystal structures solved via simulated annealing prior to Rietveld refinement. The two ordered structures were optimized via density functional theory computation to provide the best possible intramolecular bond lengths/angles prior to a final refinement versus the data. The three crystalline phases follow sequential space-group relationships (Pbca → Pbcm → Ibam) with disorder increasing with temperature. The arrangement and distortion of the low-temperature ordered phases appear to be governed by weak hydrogen bonds between methyl-group deuterium atoms and oxygen atoms in adjacent molecules. The Pbca → Pbcm transition coincides with the breaking of the weakest C–H⋯O hydrogen bonds between the molecule layers and the Pbcm → Ibam transition breaks all remaining intermolecular bonds. Despite some questions regarding the temperature calibration of the POWGEN sample environment closer to ambient conditions, the higher temperature Ibam crystal structure may prove particularly useful analyzing data from in situ lithium battery studies conducted under below-ambient conditions. However, the results seem to confirm previous observations that DMC has a tendency to crystallize with severe preferred orientation and potentially large crystallites making for a challenging sample for analysis via powder diffraction.
V. DEPOSITED DATA
The Crystallographic Information Framework (CIF) files were deposited with the ICDD. The data can be requested at pdj@icdd.com
ACKNOWLEDGEMENTS
This research used resources at the Spallation Neutron Source, a DOE Office of Science User Facility operated by the Oak Ridge National Laboratory.
The author would like to thank Dr Melanie Kirkham at the Spallation Neutron Source for her assistance in collecting the data remotely during one of the Covid-19 shutdowns.
CONFLICTS OF INTEREST
The author declares no conflicts of interest.


