


Introduction
Wildlife-based tourism has been described as a key conservation mechanism (Buckley & Castley, Reference Buckley and Castley2012; Coghlan et al., Reference Coghlan, Buckley and Weaver2012; Buckley et al., Reference Buckley, Morrison and Castley2016) and has increased globally (Tapper, Reference Tapper2006), particularly in developing countries (Balmford et al., Reference Balmford, Beresford, Green, Naidoo, Walpole and Manica2009). However, such tourism can have negative consequences for the wildlife intended to benefit from it. For example, previous studies found the mountain caribou Rangifer tarandus is displaced from preferred habitat by snowmobiles (Seip et al., Reference Seip, Johnson and Watts2007) and the Asian rhinoceros Rhinoceros unicornis by elephant-borne tourists (Lott & Mccoy, Reference Lott and Mccoy1995). Declines in bottlenose dolphin Tursiops sp. abundance linked to tourism (Bejder et al., Reference Bejder, Samuels, Whitehead, Gales, Mann and Connor2006) and increased risks to human safety through habituation of brown bears Ursus arctos (Penteriani et al., Reference Penteriani, López-bao, Bettega, Dalerum, Delgado and Jerina2017) have also been reported. A growing demand for experiences that provide opportunities to interact directly and in close proximity with wildlife (Higham et al., Reference Higham, Bejder and Lusseau2009) has inspired research aiming to quantify the direct impacts of human–wildlife encounters (Buckley, Reference Buckley2011). However, human activity (including conservation-oriented tourism) occurring within wildlife habitat often creates so-called zones of influence in which certain wildlife species may be displaced from otherwise suitable habitat (Noss & Cue, Reference Noss and Cue2001; Taylor & Knight, Reference Taylor and Knight2003; Frair et al., Reference Frair, Merrill, Beyer and Morales2008; Polfus et al., Reference Polfus, Hebblewhite and Heinemeyer2011; Boulanger et al., Reference Boulanger, Poole, Gunn and Wierzchowski2012). Few studies have examined the indirect effects of tourism infrastructure and operational development on free-ranging wildlife. An incomplete understanding of the effects tourism has on wildlife can result in poor management planning (Buckley & Pabla, Reference Buckley and Pabla2012) and reduce the net positive outcomes for conservation (Buckley, Reference Buckley2010). Even when scientific data are available, evidence-based management approaches are not necessarily implemented because research is often not management-oriented (Linklater, Reference Linklater2003) or researchers do not plan for implementation of their findings (Knight et al., Reference Knight, Cowling, Rouget, Balmford, Lombard and Campbell2008). To ensure conservation benefits exceed the costs associated with increased tourism involving rare and threatened wildlife (Karanth & DeFries, Reference Karanth and DeFries2011), it is vital that research is translated into management approaches that are both useful and user-friendly (Pierce et al., Reference Pierce, Cowling, Knight, Lombard, Rouget and Wolf2005; Thirgood et al., Reference Thirgood, Mduma, Keyyu and Laurenson2007). The policy sciences provide both a theory and a practical framework for integrating evidence in an effective decision-making process (Clark, Reference Clark2002). This approach has been used to improve conservation for many threatened species including koalas (Clark et al., Reference Clark, Mazur, Begg and Cork2000), great apes (Eves et al., Reference Eves, Gordon, Stein and Clark2002) and brown bears (Rutherford et al., Reference Rutherford, Gibeau, Clark and Chamberlain2009). The Critically Endangered black rhinoceros Diceros bicornis, an iconic large African mammal that has experienced a 97% population decline since 1970 (Emslie & Brooks, Reference Emslie and Brooks1999) could also benefit from a management-oriented approach.
Namibia supports c. one-third of the global black rhinoceros population (Emslie & Knight, Reference Emslie and Knight2014; IUCN, 2017). The free-ranging subpopulation persisting in the north-west communal rangelands of the Kunene region is recognized by the IUCN African Rhino Specialist Group as a Key 1 population (Emslie, Reference Emslie2008). It represents the last substantial population of any species of rhinoceros outside a protected area (Hearn, Reference Hearn2003). Although previous research suggested rhinoceros-based tourism is feasible under specific conditions (Hearn, Reference Hearn2003; !Uri-≠Khob et al., Reference !Uri-≠Khob, Muntifering, du Preez, Beytell, /Uiseb and Loutit2010; Beytell, Reference Beytell2010; Muntifering et al., Reference Muntifering, Linklater, Clark, !Uri-≠Khob, Kasaona and /Uiseb2015; Muntifering, Reference Muntifering2016), black rhinoceroses are susceptible to human-induced disturbance and tend to avoid areas of human activity (Cunningham & Berger, Reference Cunningham and Berger1997; Walpole et al., Reference Walpole, Karanja, Sitati and Leader-Williams2003; Muntifering et al., Reference Muntifering, Lockhart, Tingey, Griggs, Heinemeyer, Lalley and Sizemore2008). Thus, understanding the consequences of various types and magnitudes of tourism development for the rhinoceros is paramount for ensuring sustainable coexistence.
We sought to quantify the impacts occurring at the population level for a group of free-ranging black rhinoceroses exposed to tourism. Specifically, we aimed to characterize the cumulative effects of various types and magnitudes of tourism development on rhinoceros space use, to support planning and management of conservation-oriented rhinoceros tourism.
Study area
We conducted our study in the government-administered Palmwag Tourism Concession, which occupies c. 5,826 km2 or 8% of uninhabited communal land within the Kunene Region of north-west Namibia (Muntifering et al., Reference Muntifering, Lockhart, Tingey, Griggs, Heinemeyer, Lalley and Sizemore2008). Rainfall in the area is c. 50–100 mm per year (Mendelsohn et al., Reference Mendelsohn, Jarvis, Roberts and Robertson2003). Our research base was Desert Rhino Camp, a remote tourist facility run since 2003 as a joint venture between a private sector tourism company, Wilderness Safaris, and a non-governmental conservation organization, Save the Rhino Trust (Fig. 1). The camp specializes in black rhinoceros-based tourism and also supports rhinoceros monitoring and research (Buckley, Reference Buckley2010). It has exclusive access to c. 1,265 km2 of remote desert wilderness and can accommodate a maximum of 16 tourists per day who partake in vehicle-based black rhinoceros tracking safaris. The majority of tourists arrive by 4- or 12-seater aeroplanes landing at a gravel airstrip near the camp, with flights arriving and/or departing every 2–3 days. The rhinoceros tracking activity provided at the camp has been described in detail by Muntifering et al. (Reference Muntifering, Linklater, Naidoo, !Uri-≠Khob, du Preez and Beytell2018). The area around the camp experienced poaching in the late 1980s (prior to tourism development), but since the camp opened in 2003 no rhinoceroses have been poached.

Fig. 1 The study area within the Palmwag Tourism Concession, Namibia, including the main tourism features Desert Rhino Camp, airstrip and camp operation area.
Methods
Defining black rhinoceros avoidance zones
The black rhinoceros shows high site fidelity towards natural water sources, with proximity to these sites defining high-use areas (Muntifering et al., Reference Muntifering, Lockhart, Tingey, Griggs, Heinemeyer, Lalley and Sizemore2008). To determine whether tourism infrastructure and activities were displacing rhinoceroses from these high-use areas, we systematically searched 16 natural water sources in Palmwag Concession that were likely to be used by rhinoceroses (Muntifering et al., Reference Muntifering, Lockhart, Tingey, Griggs, Heinemeyer, Lalley and Sizemore2008) for rhinoceros tracks during June 2009–May 2010. We visited each water source at least once per week, typically between sunrise and midday, to ensure that any rhinoceros tracks would be observable. After recording rhinoceros tracks, we erased them with a broom to avoid double counting on future visits. We categorized a water source as avoided if the rhinoceros visitation rate (i.e. per cent of sampling events during which fresh rhinoceros tracks were observed) was 0–10%. The upper limit of 10% marks infrequent events that we assumed represent transient use by rhinoceroses dispersing across the study area. This threshold was also supported by a large gap in the water source occupancy data from our analysis. We categorized any water source with an observed rhinoceros visitation rate > 10% as used. During the sampling period no resident rhinoceroses emigrated out or immigrated into the study area, nor were there any external factors (such as irregular rainfall or water sources drying out) that could have substantially affected space use.
Constructing the zones of influence candidate model set
Rhinoceros occupancy decreases substantially at a distance of > 5 km from the nearest natural water source (Muntifering et al., Reference Muntifering, Lockhart, Tingey, Griggs, Heinemeyer, Lalley and Sizemore2008). We applied this ecologically relevant proximity threshold to create buffers around the 16 monitored water sources in the Desert Rhino Camp operational area using the geographical information system (GIS) ArcGIS 9.3 (Esri, Redlands, USA). We assigned a category of either used or avoided to each buffer based on our field sampling at the corresponding water source. Where used and avoided buffers overlapped, we classified the area as used (Fig. 2). We used Hawth's Extension Tool (Beyer, Reference Beyer2004) in ArcGIS 9.3 to generate a random sample of locations in each of the used and avoided zones. We did this to avoid placing sensitive information about natural water sources in the public domain (as stipulated by Namibia's Ministry of Environment and Tourism). For each random sample location we then examined the impact of tourism by calculating the Euclidean distance to a selected set of tourism infrastructure and activity variables that may influence rhinoceros movement. These variables included: (1) the airstrip that provides access to the site, (2) the Desert Rhino Camp lodge that accommodates tourists and serves as an activity base and (3) roads used daily (black rhinoceroses in the region avoid roads used daily but tolerate less frequent use; Muntifering, Reference Muntifering2016). We analysed the relationship between sample size (n = 1–500) and cumulative mean for each variable and identified 200 as a sufficient sample size for characterizing the used and avoided areas, whereby any additional samples have a negligible effect on the population means (Stander, Reference Stander1998).

Fig. 2 Sampling design for areas used and avoided by black rhinoceroses Diceros dicornis and distance from tourism impact features using randomly generated hypothetical natural water source locations (springs). (a) Firstly, we created buffers around each used and avoided natural water source within the Desert Rhino Camp operational area. (b) Secondly, we merged all avoided buffers and used buffers to create two distinct sampling areas. Areas of overlapping used and avoided buffers were categorized as used. We then randomly generated 200 sample locations within each sampling category.
The zone of influence around an impact feature represents a species’ tolerance towards this specific source of potential disturbance (Knight & Cole, Reference Knight, Cole, Knight and Gutzwiller1995). This concept is particularly well suited to studying the effects of tourism because the types and magnitudes of human activities affecting wildlife are often highly correlated (Johnson et al., Reference Johnson, Boyce, Case, Cluff, Gau, Gunn and Mulders2005; Polfus et al., Reference Polfus, Hebblewhite and Heinemeyer2011). Including all collinear variables in a regression framework could result in unstable regression coefficients and poor predictive capacity when using conventional procedures (Smith et al., Reference Smith, Koper, Francis and Fahrig2009). In contrast, univariate zones of influence can be merged to create multivariate zones to better characterize the cumulative effects of multiple impacts while accounting for high inter-variable correlation (Polfus et al., Reference Polfus, Hebblewhite and Heinemeyer2011). We adopted a two-step approach when developing our candidate model set. Firstly, for each tourism impact variable we estimated a series of plausible zones of influence that potentially characterized avoidance. The width of each buffer was selected by examining the proximity values from the random sampling locations within the avoided zone to each tourism impact variable.
To fine-tune our candidate set, we selected whole integers (rounded to the nearest km; Table 1) for the proximity values that ranged between the median and 3rd quartile for each tourism impact variable. For example, the median and 3rd quartile proximity value between the random samples in the avoided zone to the airstrip was 4.4 km and 5.9 km, respectively. Thus, plausible zones of influence for the airstrip impact variable selected were buffer widths of 4, 5 and 6 km (Table 1). Secondly, we created a series of cumulative zones of influence by merging each possible combination of selected buffer widths across all variables to create a candidate model set. For example, one plausible cumulative zone of influence in our candidate model set represented an area comprising a 6 km buffer around the airstrip, a 4 km buffer around the lodge and a 1 km buffer around roads used daily (model 2 in Table 2). We rounded threshold values to the nearest whole integer to provide easily comprehensible numbers to camp managers. Each cumulative zone of influence model represented the cumulative effect of tourism activity and accounted for the high correlation between the tourism impact variables.
Table 1 Summary statistics for variables included in the candidate zone of influence model set for characterizing areas avoided by the black rhinoceros Diceros dicornis in Palmwag Tourism Concession (Fig. 1).

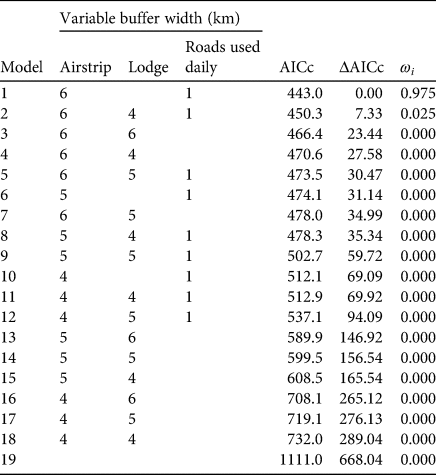
Table 2 Candidate cumulative zone of influence model set for avoidance by rhinoceroses as a function of proximity to tourism impact features. Models are ranked from best to worst based on difference in Akaike information criterion adjusted for small sample size (AICc) compared to the best-performing model (lowest AICc value), with their associated likelihoods of being selected as the best model (ω i). Missing values denote that the variable was not included in the specific model.
Information-theoretic modelling framework and validation
We developed 19 plausible cumulative zone of influence models as our a priori candidate model set, including the null model (Table 2). We used logistic regression to test how well each model characterized rhinoceros avoidance. The binary response (used or avoided, as determined by our random sample locations) was modelled as a function of whether or not each location fell within or outside each cumulative zone of influence in the candidate model set (Polfus et al., Reference Polfus, Hebblewhite and Heinemeyer2011). We then employed an information-theoretic approach that ranked models by their Akaike information criterion adjusted for small sample size (AICc), with lowest AICc value signifying the best-performing model. We used Akaike weight (ω i) to quantify the relative likelihood of each model being selected as the best-performing model (Anderson, Reference Anderson2008).
To validate our best-performing model across multiple years, we used direct rhinoceros sightings recorded by tracking teams based at the camp during 3 subsequent years following the collection of model training data in May 2010. We assumed rhinoceros sighting frequency per unit area to be similar across locations within high quality habitat. We also assumed that monitoring effort was relatively evenly distributed across the camp's operational area as the monitoring team's objective is to locate each rhinoceros in the area at least once per month, and the rotational patrol protocol helps ensure this is achieved. We then computed three contingency tables (one per validation year) and associated χ 2 statistics, to examine association between expected and actual rhino sighting frequencies within and outside the zone of influence model. For the model to be accurate and robust across years, we would expect a significantly negative association of the modelled zone's avoided area and rhinoceros sighting frequency (i.e. substantially fewer rhino sightings were recorded than expected). We conducted all analyses using R 3.2.2 (R Development Core Team, 2015).
The decision process for evaluating management options
The policy sciences framework characterizes the decision process in terms of seven interrelated functions or activities: intelligence, promotion, prescription, invocation, application, termination and appraisal (Clark, Reference Clark2002). We employed this framework to guide decision-making and policy development in the common interest for rhinoceros-based tourism activities operating from the camp. We tracked step-wise decisions taken for both the rotational area use and airstrip placement over time during 2008–2017 for each decision function (Fig. 4).
We used the best-performing cumulative zone of influence model to quantitatively estimate and evaluate the potential extent of total area and high value habitat loss for several possible management options, including reduced road use and relocating the air strip, compared to the status quo. We employed the modelled relative likelihood of an area being used by rhinoceros as a proxy for habitat quality and adopted this as a baseline habitat metric for categorizing the continuous surface into ordinal quartiles. We defined high value habitat as the top quartile of predicted probability of use for the camp's operational area. We calculated all spatial statistics using the Spatial Analyst extension in ArcGIS 9.3.
Management options were collectively developed by Wilderness Safaris and Save the Rhino Trust staff during a Desert Rhino Camp Forum meeting and included seven scenarios that were focused around two management problems. Firstly, anecdotal evidence provided by Wilderness Safaris guides and trackers from Save the Rhino Trust based at the camp in 2009 suggested that rhinoceroses were being displaced out of good habitat by frequent vehicle movements. A rotational use policy was prescribed as an alternative management option and applied across four patrol zones during 2011–2012, ensuring that each zone was left without vehicle movements for 1–2 consecutive days. In 2013 we retrospectively assessed the impact of this rotational use pattern compared to unregulated road use, to quantify the policy's effectiveness. Secondly, an investigation by Wilderness Safaris in late 2013, triggered by new air safety regulations, found the airstrip did not meet the expected standard. An airstrip design expert visited the area and recommended four potential sites that met the new safety regulations. In addition to the four suggested sites we created a worst-case scenario with unregulated road use and relocation of the airstrip to the site with the greatest negative impact on rhinoceros. Quantitative comparisons of rhinoceros avoidance for all scenarios, including the status quo, provided a set of objective metrics for identifying the scenario most likely to minimize negative impacts and facilitate coexistence. Because the time frame of this study was relatively short for a k-selected species such as the rhinoceros, we could not assess direct impacts on population performance (rhinoceros inter-calving intervals can span > 4 years; Brodie et al., Reference Brodie, Muntifering, Hearn, Loutit, Loutit and Brell2011). Thus we focus our analysis on habitat reduction as a proxy for impact on the rhinoceros population.
Results
Patterns of avoidance
Four of the 16 natural water sources that were predicted to have a high probability of use were categorized as avoided, with no observed rhinoceros occupancy at three sites and only 8% frequency of occurrence at the fourth (79 independent sampling visits per water source). There was a strong negative relationship (β = −0.04585 ± SE 0.008, P < 0.001, R 2 = 0.685) between frequency of natural water source use and road-use intensity (Fig. 3). The scatterplot clearly suggested a substantial decrease in the likelihood of a natural water source being used by black rhinoceroses when vehicle visitation rate exceeded 16 visits per month, or c. once every 2 days. However, natural water sources visited by vehicles with a mean frequency of ≤ 12 times per month (i.e. c. once every 3 days) maintained a substantially higher usage rate by black rhinoceroses (Fig. 3).

Fig. 3 Relationship between frequency of fresh rhinoceros signs detected and mean monthly vehicle visitation rates at 16 natural water sources in Palmwag Concession, Namibia (dashed line is the linear regression trend line).
Selecting and evaluating the cumulative zone of influence model set
The variables airstrip and lodge proximity (partial r = 0.885, P < 0.0001), airstrip proximity and roads used at least daily (partial r = 0.938, P < 0.0001), and lodge proximity and roads used at least daily (partial r = 0.941, P < 0.0001) were all strongly correlated. The mean, median and 3rd quartile proximity values from random avoided locations to the airstrip and lodge ranged from 4.4–6.8 km to 0.6–1.0 km for roads used at least daily (Table 1). As described above, we used integer values (rounded down to nearest integer) from within these ranges to build a total of 19 candidate cumulative zone of influence model sets (Table 2).
The model that included a 6 km airstrip buffer and 1 km buffer from roads used daily (scenario 1) had the greatest support for characterizing avoidance areas (ω i = 0.975). The second-best model, which included the same buffers around airstrip and roads used daily, plus a 4 km buffer from the lodge, ranked significantly lower (ΔAICc = 7.327,ω i = 0.025). No other scenario had any likelihood (Akaike weight) of being the best model (Table 2).
We validated our best cumulative zone of influence model by retrospectively examining spatial overlap of verified rhinoceros sightings recorded during systematic monitoring patrols (Brodie et al., Reference Brodie, Muntifering, Hearn, Loutit, Loutit and Brell2011) for 3 subsequent years after the collection of model training data in early 2010. There were 613 independent rhinoceros sightings within the camp's operating area including 294 in 2010, 190 in 2011 and 129 in 2012. Analysis of contingency tables suggested that each year produced significantly fewer rhinoceros sightings within the best-performing zone of influence model than expected relative to the remaining operational area of the camp outside the zone of influence; 2010 (χ 2 = 31.579, df = 1, P < 0.001), 2011 (χ 2 = 122.716, df = 1, P < 0.001) and 2012 (χ 2 = 16.053, df = 1, P < 0.001).
Impacts and reducing habitat loss
The total area and high value habitat estimated to be under Desert Rhino Camp's operating influence were 142,489 and 30,792 ha, respectively. An estimated 15.7% of the total area and 32.8% of high value habitat were made unavailable to the rhinoceros population by frequent vehicle movements. Although they could have accessed these areas, rhinoceroses avoided them prior to a rotational road-use strategy being adopted that limited the extent of daily road use. Following the decision to restrict daily road use by rotating activity areas around the lodge, the extent of predicted area avoided and high value habitat lost was reduced by 61% (from 15.7 to 6.2%) and 43% (from 32.8 to 18.7%), respectively.
All proposed airstrip relocation scenarios would result in an increase in the total area avoided and loss of high value habitat, compared to the status quo. The least impactful alternative was scenario 1 (6 and 1 km buffers around airstrip and roads used daily, respectively), which was predicted to increase area avoided and loss of high value habitat by 14.5 and 10.7%, respectively. Scenario 4 (i.e. utilizing the existing airstrip an hour's drive away from the camp) was predicted to decrease the extent of loss of high value habitat by 5.3% but increase area avoided by 43.5% relative to the status quo. However, this scenario was deemed unviable because of the long drive required to reach the lodge. Scenarios 2 and 3 increased area avoided by a mean of 83% (91.9 and 74.2%, respectively) and loss of high value habitat by a mean of 34% (43.9 and 24.6%, respectively) compared to the status quo. When the rotational road use scenario was combined with the best airstrip relocation option (scenario 1), the potential impacts on the extent of area affected were reduced compared to scenario 2 being selected without rotational road use (7.1 instead of 18.0%) and the amount of high value habitat loss was 20.7 instead of 38.4%; (Table 3).
Table 3 Summary of the reduction in total area available and high value habitat under different management scenarios regarding road use (restricting extent of roads used daily by rotating activity areas) and airstrip relocation. The total area available and high value habitat (defined as the top quartile of predicted relative probability of rhinoceros use within the Desert Rhino Camp area) were estimated to be 142,489 and 30,793 ha, respectively, of the camp's operating area.

Decision process
Over a c. 10-year period (2008–2018) the decision process included two separate chronological series, each based on a management problem statement that followed the policy science decision process framework (Fig. 4). Firstly, baseline information collected on rhinoceros habitat, water source usage and vehicle movements during 2008–2010 informed debates in the Desert Rhino Camp Forum on road impacts, resulting in a new rotational use policy that limits daily road use. This policy was applied in 2012. Secondly, the baseline data were used in 2013 to empirically test a number of zone of influence models. The best-performing model was presented to the Desert Rhino Camp Forum to help assess the impacts of the rotational use policy and inform debate on associated impacts of various scenarios for airstrip placement. The simple yet objective information helped the team prescribe and invoke the construction of a new airstrip that met all stakeholder demands. Consequently, the new airstrip was constructed and became operational in August 2017, and the use of the old airstrip was terminated.

Fig. 4 A long-term management decision process synthesizing key events in the problem solving and collective decision processes at Desert Rhino Camp (DRC). The two focal management problems are identified and their respective decision process events presented using the seven functions posited by the policy sciences. This demonstrates how our research and validation methods were directly integrated into an adaptive management framework.
Discussion
Although research inquiries into biological and ecological factors that may limit rhinoceros ranging behaviour exist (Lent & Fike, Reference Lent and Fike2003; Morgan et al., Reference Morgan, Mackey and Slotow2008), there is little evidence on the influence of human factors, and specifically tourism, on space use by rhinoceroses. Research documenting human impacts on wildlife is common, but studies that provide practical, policy-relevant management tools that lead to evidence-informed decisions are limited. Our approach sought to provide a novel tool to encourage scientifically sound tourism planning, one that could be understood easily and applied by managers within a well-grounded decision process framework. Specifically, our modelled cumulative zone of influence provides the first quantitative assessment of the impacts of human infrastructure and tourism activities on a free-ranging black rhinoceros population. Our findings suggest that the black rhinoceros will tolerate limited levels of tourism activity but will avoid areas under chronic tourism-induced disturbance. Similar results have been documented for other sensitive species such as wild reindeer Rangifer tarandus tarandus (Nellemann et al., Reference Nellemann, Jordhøy, Støen and Strand2000) and mountain goats Oreamnos americanus (Richard & Côté, Reference Richard and Côté2015), and can be extended to mountain woodland caribou Rangifer tarandus caribou (Polfus et al., Reference Polfus, Hebblewhite and Heinemeyer2011), barren-ground caribou Rangifer tarandus groelandicus, brown bears and grey wolves Canis lupus (Johnson et al., Reference Johnson, Boyce, Case, Cluff, Gau, Gunn and Mulders2005) when mining activities are included. Previous research into the behaviour of the black rhinoceros suggests a strong avoidance of chronic human-induced disturbance (Lott & Mccoy, Reference Lott and Mccoy1995; Cunningham & Berger, Reference Cunningham and Berger1997; Walpole et al., Reference Walpole, Karanja, Sitati and Leader-Williams2003; Muntifering et al., Reference Muntifering, Lockhart, Tingey, Griggs, Heinemeyer, Lalley and Sizemore2008). Our results confirmed this and provided site-specific evidence that suggest the black rhinoceros avoids areas within 6 km of an airstrip and within 1 km of roads used daily for tourism activities. Even though rhinoceroses clearly avoided the lodge, the spatial configuration of the daily used road network had a stronger influence on the best-performing model than the location of the lodge. This could be explained by the fact that the level of noise from aircraft engines is significantly greater than that emitted from the lodge or vehicles, especially during take-offs and landings. Despite a relatively limited 12-month sampling period of indirect rhinoceros movement patterns during 2009–2010, our validation using direct rhinoceros sightings recorded during 3 subsequent years (2010–2012) further demonstrates our best zone of influence model is accurate and robust across years, ruling out possible confounding effects.
We focused our analysis on the spatial effects of road use and fixed infrastructure placement on black rhinoceros avoidance behaviour primarily because of our pre-existing knowledge of the disturbance context at Desert Rhino Camp, but also because the planning and management of these impacts can be evaluated and modified within an adaptive management framework. The first management problem we sought to address was the impact of vehicle traffic on rhinoceros space use. The top cumulative zone of influence model included roads used daily, was simple to explain to all staff and, most importantly, when presented to management with supporting validation data, reinforced the decision to restrict daily use of roads to a smaller area around the lodge, a management action that was invoked in late 2012. Despite a relatively small overall impact on the extent of land affected (only 2.7%), the reduction of high value habitat as a result of tourism disturbance was substantial. In addition, the decision ultimately provided more evidence that further codified the policy mandating that daily tracking excursions be rotated between four zones within the lodge's operating extent. In addition to reducing rhinoceros displacement, the reduction of chronic vehicle disturbance also benefited monitoring by increasing the extent of patrol coverage by > 80% and the number of individual rhinoceros observed regularly by 66% (J.R. Muntifering, unpubl. data).
The second decision process involved the airstrip placement. The option of placing the airstrip near the lodge (< 1 km) produced < 2% additional impact on the total area avoided and high value habitat lost. Following open debate framed around easily understood zone of influence buffers (as opposed to complex statistical models), the camp management agreed to compromise and select this option, which reversed an initial uninformed decision that would have selected the airstrip development option with the highest impact on rhinoceroses (option 3 in Table 3) and increased the loss of high value habitat by over 40% (Muntifering, Reference Muntifering2016). In addition, anecdotal evidence suggests that since the airstrip has been reopened in the new location near the lodge, at least three adult rhinoceroses (two breeding females who have recently been observed mating with a breeding age bull) have immigrated from an area c. 40 km to the north and have recolonized the area around the old airstrip (previously completely avoided). No rhinoceroses have been displaced in the vicinity of the new airstrip (M. Nawaseb, 2018, pers. comm.). This suggests that despite the underlying data used in this analysis being several years old, the model projections remain relevant and reasonably robust to changes over time under the current operating environment. However, future research could provide more quantitative information on long-term effects of such conservation-oriented policy decisions, and insights into current rhinoceros habitat selection. Our use of a structured decision framework also illustrates the importance of incorporating research outputs into a practical multi-stakeholder decision process that helps find and secure common ground (Muntifering, Reference Muntifering2016; Fig. 4).
These findings could be scaled up to explore the integration of modelling outputs with GIS-based simulation software for conservation planning. This could help optimize the configuration of tourism impact features to maximize opportunities for wildlife monitoring and minimize tourism-induced habitat loss. Such tools could be employed in workshop settings to negotiate potential options and support decisions that balance conservation and tourism needs. Further research is needed at multiple scales for the rhinoceros and other taxa affected by tourism or other human activities such as mining or road construction. An integrative approach would facilitate a broader assessment of human development impacts generally and the role of tourism specifically in securing regional habitat connectivity that improves long-term conservation prospects for high value species.
Acknowledgements
We thank the Ministry of Environment and Tourism, Namibia for approving the research permit for this study, Wilderness Safaris and Save the Rhino staff for assisting with data collection, Jean Polfus and Cao Qing for useful insights on analysis, Philip Nyhus and Manual Gimond at Colby College for designing the grid vector selection tool, and Minnesota Zoo for providing funding for data collection, analysis and write-up.
Author contributions
Study design: JM, WL, RN, AK; field work: JM, SU; data analysis: JM, WL, RN; writing: JM, WL, RN, PdP, PB, SJ, AK.
Conflicts of interest
None.
Ethical standards
This research abides by the Oryx guidelines on ethical standards. Our research operated under a standard research permit (MET-2130/2016) approved by the Ministry of Environment and Tourism of Namibia. No animals were captured or handled, no specimens collected or human subjects interviewed during this research.


 Open access