


Introduction
Glaciers throughout the Antarctic Peninsula (AP) have undergone extensive change in recent decades (Cook et al. Reference Cook, Fox, Vaughan and Ferrigno2005, Pritchard & Vaughan Reference Pritchard and Vaughan2007, Pritchard et al. Reference Pritchard, Arthern, Vaughan and Edwards2009, Kunz et al. Reference Kunz, King, Mills, Miller, Fox, Vaughan and Marsh2012) and are subject to rapid climate warming from both the atmosphere and ocean (Barrand et al. Reference Barrand, Machguth and Hagen2013a). There is extensive evidence that since the 1950s there have been significant changes in the climate on the AP such as an increase in air temperature (Vaughan et al. Reference Vaughan, Marshall, Connolley, Parkinson, Mulvaney, Hodgson, King, Pudsey and Turner2003, Steig et al. Reference Steig, Schneider, Rutherford, Mann, Comiso and Shindell2009, Mulvaney et al. Reference Mulvaney, Abram, Hindmarsh, Arrowsmith, Fleet, Triest, Sime, Alemany and Foord2012), near-surface warming in the seas to the west (Meredith & King Reference Meredith and King2005), a corresponding reduction in sea ice extent (Smith & Stammerjohn Reference Smith and Stammerjohn2001), and an increase in precipitation and snow accumulation (Turner et al. Reference Turner, Colwell, Marshall, Lachlan-Cope, Carleton, Jones, Lagun, Reid and Iagovkina2005, Thomas et al. Reference Thomas, Marshall and McConnell2008). Estimations of ice mass change suggest that glaciers in this region are particularly sensitive (Hock et al. Reference Hock, de Woul, Radic and Dyurgerov2009), and an accelerated mass loss has occurred during recent years (Chen et al. Reference Chen, Wilson, Blankenship and Tapley2009, Ivins et al. Reference Ivins, Watkins, Yuan, Dietrich, Casassa and Rulke2011). Within the entire AP glacier system there are numerous individual regional and local ice masses. Outlet glaciers drain to the east and west from the plateau of the AP ice sheet, and ice caps, mountain glaciers and piedmonts are prevalent along the margins and adjacent islands. These relatively small ice masses are crucial indicators of the variability of the regional climate system; by measuring their characteristics we can begin to understand the response both locally and across the system as a whole.
A prerequisite for continued glacier-by-glacier mass balance studies is the definition of outlines for each individual ice mass. A recent inventory was produced for outlines of mountain glaciers and ice caps around the periphery of Antarctica, which includes glaciers on the offshore islands surrounding the AP (Bliss et al. Reference Bliss, Hock and Cogley2013) and other glacier delineations exist for specific regions within the AP (Rabassa et al. Reference Rabassa, Skvarca, Bertani and Mazzoni1982, Braun et al. Reference Braun, Simoes, Vogt, Bremer, Blindow, Pfender, Saurer, Aquino and Ferron2001, Rau et al. Reference Rau, Mauz, De Angelis, Jana, Neto, Skvarca, Vogt, Saurer and Gossmann2004, Davies et al. Reference Davies, Carrivick, Glasser, Hambrey and Smellie2012). However, a comprehensive inventory, using a consistent technique, is necessary to incorporate all glacier systems on both the mainland and surrounding islands.
Since the AP is almost entirely covered in ice, distinguishing between glaciers and the ice sheet is not straightforward (Rau et al. Reference Rau, Kargel and Raup2006, Bliss et al. Reference Bliss, Hock and Cogley2013) and definitions may vary depending on the intended usage. Many glacier inventories for non-Polar regions have been produced using semi-automated multispectral glacier mapping methods (e.g. Paul et al. Reference Paul, Kaab, Maisch, Kellenberger and Haeberli2002, Bolch et al. Reference Bolch, Menounos and Wheate2010). However, these methods cannot be easily applied in the AP region due to year-round snow and firn cover in most regions and the multi-part glaciology of the ice sheet. Mapping the drainage basin boundary as an alternative to the ice-rock interface is a practical solution for defining individual glacier flow units. Where glaciers are connected (e.g. an outlet draining an ice cap), the ice divide is used as the basin limit. Since snow and exposed rock may be included within the boundaries, they are basins rather than glacier outlines, but each basin has only one glacier terminus.
One significant factor preventing the mapping of glacier boundaries is that there has been no topographic model of sufficient resolution or accuracy to capture the steep-sided coastal regions and relatively small glaciers that are prevalent on the AP. In this paper, we describe how a new 100-m resolution digital elevation model (DEM) (Cook et al. Reference Cook, Murray, Luckman, Vaughan and Barrand2012), combined with a semi-automated drainage basin delineation approach, has ensured a consistent identification of boundaries, resulting in a new inventory of glacier drainage basin outlines that can provide a resource for future mass balance studies. We use these boundary outlines alongside the existing coastal-change and glaciological maps of Antarctica dataset of historical ice front positions (Williams et al. Reference Williams, Ferrigno, Swithinbank, Lucchitta and Seekins1995, Cook et al. Reference Cook, Fox, Vaughan and Ferrigno2005, Ferrigno et al. Reference Ferrigno, Cook, Foley, Williams, Swithinbank, Fox, Thomson and Sievers2006, Reference Ferrigno, Cook, Mathie, Williams, Swithinbank, Foley, Fox, Thomson and Sievers2008, Reference Ferrigno, Cook, Mathie, Williams, Swithinbank, Foley, Fox, Thomson and Sievers2009) and, as a result, increase the number of marine-terminating glaciers for which a record of frontal change can be defined from 244 (Cook et al. Reference Cook, Fox, Vaughan and Ferrigno2005) to 860 glaciers. This new dataset allows area measurements to be made, improving the possibilities for interpreting glacier changes in this region. We calculate the area changes for all 860 glaciers, from records as early as 1945 to 2010, and discuss correlations between glacier characteristics and spatio-temporal patterns of change.
Methods
Glacier basin delineation
The AP differs from the rest of the Antarctic continental ice sheet; it is a narrow mountainous chain bounded to the east and west by ocean and has a distinctive climatic regime. The topography consists of numerous steep and heavily-crevassed mountain glaciers, in contrast to the large, low-sloping ice streams making up most of the continental fringe. Along the west coast, the glaciers between Trinity Peninsula in the north (63°S) and George VI Sound in the south (70°S) are almost all marine-terminating; further south the glaciers flow into ice shelves. Along the east coast, the glaciers north of 66°S are primarily marine-terminating and further south they feed the Larsen Ice Shelf. The primary focus for glacier change is the marine-terminating glaciers, thus the boundary used was 63°S–70°S and 55°W–70°W. The area of this region (including islands and excluding ice shelves) is c. 98 000 km2, which is c. 0.7% of the area of the continent, and more than 96% of this area is ice-covered.
A topographic model can provide the information required for glacier basin delineations if the resolution is sufficient for the scale of the features. A recently derived 100-m resolution DEM, created by improving the ASTER Global DEM in the AP region (Cook et al. Reference Cook, Murray, Luckman, Vaughan and Barrand2012), is used here as the basis for the basin delineations. With a mean elevation accuracy of 4 m (± 25 m root mean square error), this is regarded as suitable for watershed delineation of both small, steep-sided glaciers and those originating on the gentler relief of the plateau. In order to minimize subjectivity, hydrological tools available in a geographic information system (GIS) package were used to automate delineation of glacier drainage basins. Normally such tools require a ‘pour point’ on the coast where the river exits the catchment and the algorithm calculates the distance upstream until it reaches the watershed. Instead of using a point outlet, a line denoting the glacier ice front was defined, which forces the algorithm to include the whole surrounding glacier catchment. This method is similar to that employed by Bliss et al. (Reference Bliss, Hock and Cogley2013).
The AP coast line was digitized based on the Landsat Image Mosaic of Antarctica (LIMA) (Bindschadler et al. Reference Bindschadler, Vornberger, Fleming, Fox, Mullins, Binnie, Paulsen, Granneman and Gorodetzky2008), which consists of Landsat scenes from between 2000 and 2002. Therefore, the basins are all based on a consistent time period. In the case of the Larsen Ice Shelf, which in 2002 covered the entire east coast of the AP south of 65.5°S, the grounding line was used to divide the drainage basins. This was primarily based on the Antarctic Surface Accumulation and Ice Discharge (ASAID) project data source (Bindschadler et al. Reference Bindschadler, Choi and Wichlacz2011), modified in places with features visible on the LIMA. As the delineation algorithm only works within the boundary of the DEM, the lines have been clipped to the extent of the ASTER 100-m DEM, which is missing some small sections at the coast/grounding line (2.1% of the total area).
The watershed was determined by the positions of the side boundaries at the glacier front. These were produced by clipping the line at the mouth of each glacier, based on visual interpretation from LIMA, slope changes visible in the DEM and changes in ice velocity visible on an ice flow mosaic (Rignot et al. Reference Rignot, Mouginot and Scheuchl2011). In many cases separate glacier entities coalesce to form a single glacier at the terminus, in which case the resulting basin is termed ‘compound’. After the creation of the watershed boundary polygons, manual correction of small artefacts was necessary in some cases. Sections of rock coast, islands that are predominantly ice-free and basins <0.5 km2 are not included in the database. The result is a total of 1590 glacier outlines with area, date and source details (Fig. 1a & b) (available for download from the ADD, http://add.scar.org/).

Fig. 1 Glacier drainage basin outlines. a. Shows the spatial extent of the glacier outlines. The white box is the inset shown on b. which illustrates the level of detail of the dataset. The white box on b. indicates the larger scale plot shown in c. which is a sample glacier showing the ice-front data; red lines are post-2000 ice fronts and blue lines are pre-2000. The background image is Landsat ETM+ image LE7218106000105250, 21/02/2001.
Glacier attributes
Further attributes were assigned in accordance with the Global Land Ice Measurements from Space (GLIMS) inventory specifications (Rau et al. Reference Rau, Mauz, Vogt, Khalsa and Raup2005). Glaciers are not sub-divided into as many glacial units as in the World Glacier Inventory (WGI), and the attributes apply to the drainage basins and not the individual glacier entities within the basins. Attributes include a primary classification (Class), basin shape (Form) and frontal-type (Front), as defined for the GLIMS inventory (e.g. see Table I). Furthermore, an overall confidence rating regarding decisions about these classifications was established. The grounding line is not clearly identifiable for many marine-terminating glaciers thus the term ‘floating’ was only assigned in cases where it was considered to be unambiguous. These decisions were based on the positions of the ASAID grounding line, combined with interpretation from features visible on the LIMA. No measurements were made using the grounding line and, therefore, its position does not affect the results, with the exception of defining floating glaciers. An additional Class type was added to denote a small ice-covered island (1–5 km long/wide) as such features are prevalent along the west coast. The term ‘uncertain/miscellaneous’ is used where a coastal region is ice-covered but does not match a distinct glacier-type, although the term ‘ice wall’ has been used to describe this widespread feature in Antarctica (Williams et al. Reference Williams, Ferrigno, Swithinbank, Lucchitta and Seekins1995).
Table I Primary classifications (Class) and frontal characteristics (Front) of 1590 glacier basins on the mainland and islands surrounding the Antarctic Peninsula.

Geometric and descriptive characteristics were assigned to the marine-terminating glaciers, such as glacier name, area, length, outlet width, shape, altitude distribution, slope and aspect. Glacier basin areas were calculated on a Lambert azimuthal equal area projection whose origin is at the South Pole and central meridian is at 65°W. Due to the complex nature of many of the glaciers, defining a single measure of glacier basin length was not straightforward. For example, many catchments contain more than one glacier flowing towards a single terminus, which means that the length of a straight centreline through the basin can give a very different result from the lengths of the main branch or tributaries within the basin. A GIS algorithm was used to derive centrelines based on a ‘least-cost route approach’ between the glacier head and terminus, in which branch orders were allocated (Kienholz et al. Reference Kienholz, Rich, Arendt and Hock2014). This file was manually edited resulting in a line for every glacier basin that best represents the central flow line of the main glacier branch.
Glacier front widths were based on the straight line distance between the two end points defining the glacier front, and mean basin widths were calculated by dividing the glacier basin area by its centreline length. Such geometric quantities can be used to characterize the basin shape, for example, the degree of convergence. If the width of the front is less than the mean width, the glacier is classified as convergent, while a glacier with an outlet width greater than the mean width is classified as divergent. Three-dimensional glacier geometry characteristics included in the attributes are maximum, minimum, and mean elevation and slope, calculated from DEM pixel values along the centreline. Although this is biased (since only centre values are considered), it is a more robust representation of the glacier surface than if values for the whole basin are used, as it omits the ice-free, steep-sided valley walls.
Glacier change data
Positions of glacier fronts on the AP can be identified from many archival forms, such as aerial photographs, maps and satellite images. A comprehensive inventory using all records up to 2002 was compiled as part of the United States Geological Survey (USGS) coastal-change and glaciological maps of Antarctica project (Williams et al. Reference Williams, Ferrigno, Swithinbank, Lucchitta and Seekins1995). The results were published as maps and information booklets (Ferrigno et al. Reference Ferrigno, Cook, Foley, Williams, Swithinbank, Fox, Thomson and Sievers2006, Reference Ferrigno, Cook, Mathie, Williams, Swithinbank, Foley, Fox, Thomson and Sievers2008, Reference Ferrigno, Cook, Mathie, Williams, Swithinbank, Foley, Fox, Thomson and Sievers2009) and used in an analysis of changes in glacier length based on 244 glaciers (Cook et al. Reference Cook, Fox, Vaughan and Ferrigno2005). The new dataset of glacier basin outlines enables the coastal-change data to be analysed more fully since the historic ice fronts can now be associated with corresponding glacier basin outlines, and calculations of changes in glacier extent can be based on area rather than length.
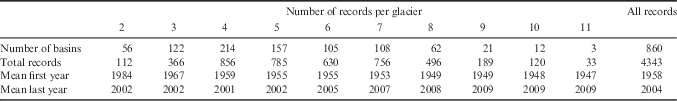
Glacier fronts in the coastal-change inventory were joined to the relevant basin outlines to create a closed polygon for every data record. In addition, since the original dataset used the Institut für Angewendt Geodesie (IfAG) mosaic as a base image, all coastlines needed to be updated and georegistered to the more geospatially accurate LIMA mosaic. As image georegistering between the two mosaics introduced considerable errors, this was done on a glacier-by-glacier basis, where neighbouring stationary features (e.g. rock promontories) digitized from the IfAG mosaic, were used to align the coastline data to the same features visible on the LIMA mosaic. Finally, the data were updated by manually digitizing more recent ice front positions to fill gaps since 2002 up to 2010, primarily using Landsat ETM+ satellite imagery and, where these were missing/cloud-covered, European Remote Sensing satellite-2 (ERS-2) synthetic aperture radar imagery. A description of source material and digitization methodology can be found in the original coastal-change documents (Ferrigno et al. Reference Ferrigno, Cook, Foley, Williams, Swithinbank, Fox, Thomson and Sievers2006, Reference Ferrigno, Cook, Mathie, Williams, Swithinbank, Foley, Fox, Thomson and Sievers2008, Reference Ferrigno, Cook, Mathie, Williams, Swithinbank, Foley, Fox, Thomson and Sievers2009). The result is a new GIS database of 4343 glacier basin measurements presented as polygons, where each polygon contains associated attributes (Table II shows the distribution of ice-front records per basin and a sample of the ice fronts are shown in Fig. 1c).
Table II Distribution of ice-front records per glacier basin.
A challenge when measuring changes in marine ice fronts is that they can change between floating and grounded, and can also either merge with or separate from neighbouring ice fronts. In the new dataset, many glacier basins that were once merged with other basins are now separate entities because they have receded past a point of convergence. As this is primarily a study of changes in glacier drainage basins two clarifications need to be made to our approach. Firstly, the basin outlines are based on the ice-front position as it appears on the LIMA (2000–02), regardless of the position of the grounding line. If any basins in 2000–02 were once part of larger basins, we group them according to the maximum extent of the basins when they were merged, to a limit of five basins. Secondly, some basins in 2000–02 contained glaciers that coalesced downstream of the grounding line (termed ice shelves). They may have since receded and separated into basins with single glacier fronts. In these cases the five basin limit is based on the most recent frontal positions. Accordingly, measurements of glacier basins adjoining the Larsen A, Larsen B and Wordie ice shelves only begin after the major episodes of ice shelf collapse.
For area-change analysis, small ice-covered islands, ice walls, ice-shelf nourishing or land-terminating glaciers were removed from the dataset of 1590 basin outlines. From these 925 marine-terminating glaciers, those with an area<1 km2 or with only one frontal position record were also excluded (n=28). Following this, multiple basins that were once one entity were merged (as described above), resulting in a total of 860 glacier basins with two or more ice-front position records. The areas of all ice-front record polygons associated with each glacier basin were then calculated and assigned to this new dataset. Glacier change attributes calculated for each glacier basin include: overall area change, area change relative to glacier size, data record details and glacier area (in km2 and %) at each available time period.
Uncertainties
The largest sources of uncertainty in measuring glacier change include the reliability of source material, measurement error and methods used to calculate change. The large number of data sources, each having different characteristics, spatial resolutions and geodetic accuracies, necessitated an accuracy assessment unique to the AP. A method was developed for the coastal-change study (Ferrigno et al. Reference Ferrigno, Cook, Foley, Williams, Swithinbank, Fox, Thomson and Sievers2006), where reliability ratings were assigned to every data source. This same approach was applied to all data sources in this study and the results show that the majority (68%) of the records have a reliability rating of 1 (estimated to be accurate to within 60 m in length, equivalent to 0.0036 km2), 25% have a rating of 2 (within 150 m or 0.0225 km2) and 7% have a rating of 3 (within 300 m or 0.09 km2). Glacier fronts with a rating of 3 are generally derived from vertical or oblique aerial photographs in which few or no reference features are visible, or from satellite images or large-scale maps which are poorly georeferenced but still show useful coastline data. The ratings take into account manual digitization and interpretation errors, which were measured using stationary features as a guide. A more detailed description of coastline accuracies can be found in Ferrigno et al. (Reference Ferrigno, Cook, Foley, Williams, Swithinbank, Fox, Thomson and Sievers2006).
Unlike measurements of changes in glacier length, glacier area measurements take into account uneven changes along the ice front and offer a more precise assessment of change than can be obtained using along-flow sample-lines. Differencing of polygon areas from one epoch to another can provide values of absolute area change, as well as change relative to basin size.
Glacier distribution and characteristics
Our analysis shows that the total area of the AP in the period 2000–02 between 63°S–70°S was 98 293 km2 (inclusive of exposed rock and small islands but excluding ice shelves). When small (< 0.5 km2) islands and drainage basins that are predominantly ice-free are excluded, a total of 96 982 km2 (98.7%) in 1590 glacier drainage basins remain. By further excluding an approximate area representing exposed rock (obtained from the ADD), the estimated ice-covered area for this region is 94 646 km2 (96.3%). To best facilitate spatial analysis, the AP was divided into two distinct eastern and western sides and into the seven one-degree latitudinal bands that cross the 1000 km long peninsula.
The spatial distribution of glaciers and total ice-covered area is shown in Fig. 2. The number of glaciers is latitudinally more evenly distributed along the eastern side than along the western side. From the total of 1590 glaciers, by far the largest number (n=427) occur in the west between 64°S–65°S, whereas only 31 glaciers are found within the western band 69°S–70°S. However, the total glaciated area in this section is by far the largest and it contains the largest glacier basin on the peninsula, Fleming Glacier (7021 km2).

Fig. 2 Number and area coverage of all glacier systems divided by east/west and degree latitude. The definition of an east/west glacier is determined by the location of its terminus.
The western region has a strong negative relationship between the size class and number of glaciers, and an opposing similarly strong positive relationship with the sum total area (Fig. 3). The former relationship is not as pronounced in the east, where there are fewer glaciers in the smaller size categories. In total, 36% (n=567) of glaciers are<5 km2 but altogether these cover<1.5% (1432 km2) of the total glaciated area, whereas the 29 glaciers>500 km2 (1.8% of all glaciers) cover 42.5% (41 246 km2) of the total area. Further descriptions of glacier types are shown in Table I, where the number of glaciers within each classification and frontal-type is listed. The largest population of glaciers (35%) are the mountain glaciers, which occur in similar proportions on both the mainland and islands. Glacier types that differ significantly between the mainland and islands are outlet glaciers (85% on the mainland) and ice fields (94% on the mainland). As regards frontal type, the highest percentage (42%) are in the ‘calving’ category. A rather large proportion (28%) was assigned ‘uncertain/miscellaneous’ as the grounding line is unclear in many cases, and many of these could be floating. There were only nine glaciers that could be described as ‘land-terminating’ during the period 2000–02, and all of these occur on James Ross Island.

Fig. 3 Number and area coverage of all glacier systems divided by east/west and size class.
The dataset lends itself to the characterization and comparison of glaciers in many ways, including those based on surface elevation details. Mean elevations and slopes of different glacier categories and size classes highlight differences between glacier types in this region (Fig. 4). Mean elevation and slope of mountain glaciers are very dependent on glacier area, for example, small glaciers tend to have low mean elevations and high mean slope angles. Large outlet glaciers tend to have low mean slope angles irrespective of the mean elevation.

Fig. 4 Elevations and slopes grouped by glacier size class, for outlet and mountain glaciers.
Glacier changes
Reinforcing the result of an earlier study of 244 glaciers (Cook et al. Reference Cook, Fox, Vaughan and Ferrigno2005), our study of 860 marine-terminating glaciers on the peninsula shows that 90.5% have retreated since the earliest recorded ice-front position (average 1958). In total, 30 (3.5%) glaciers lost >10 km2, 190 (22%) glaciers lost between 1–10 km2 and the majority (n=558, 65%) showed minimal retreat (<1 km2). Of the 82 (9.5%) that advanced, 80 of these changed by<1 km2 (Fig. 5a). When area change is calculated relative to the basin size, the distribution is also negatively skewed but with a greater dispersion around the mean (Fig. 5b). This can be explained by the diverse range of glacier sizes; there are many small glaciers that may show only a small absolute area change but a large relative change.

Fig. 5 a. Overall change per glacier (km2) and b. relative change per glacier (% of basin size) from earliest to latest records. Records are variable for each glacier but earliest positions are, on average, 1958 and latest positions are, on average, 2004 (weighted by basin area these are 1968 and 2007, respectively). Due to the large negative dispersion range, data from the extremes (< 0.02 and>0.98) have been excluded.
The spatial distribution of overall change (Fig. 6a) shows that the largest area loss has occurred to glaciers flowing into Wordie Bay, where Fleming Glacier (consisting of Fleming, Airy and Seller glaciers) lost 329 km2 between 1997 and 2010, following collapse of the Wordie Ice Shelf. The two large neighbouring glaciers (Hariot and Prospect glaciers) lost 251 km2 and 204 km2, respectively. Large losses also occurred to glaciers such as Hektoria (113 km2), Crane (50 km2) and Jorum (43 km2) which once flowed into the Larsen B Ice Shelf, and Pyke (56 km2) and Edgeworth (32 km2) glaciers which once fed the Larsen A Ice Shelf to the north. These results correspond with studies that have shown mass deficit due to tributary glacier acceleration and thinning post-ice shelf collapse (Scambos et al. Reference Scambos, Bohlander, Shuman and Skvarca2004, Rignot et al. Reference Rignot, Casassa, Gogineni, Kanagaratnam, Krabill, Pritchard, Rivera, Thomas and Vaughan2005, Wendt et al. Reference Wendt, Rivera, Wendt, Bown, Zamora, Casassa and Bravo2010, Rott et al. Reference Rott, Muller, Nagler and Floricioiu2011, Shuman et al. Reference Shuman, Berthier and Scambos2011, Berthier et al. Reference Berthier, Scambos and Shuman2012). The largest single area loss that was not due to sudden removal of an ice shelf buttress was from the large Fuchs Ice Piedmont on Adelaide Island (60 km2).

Fig. 6 Spatial distributions of overall change in area from earliest to latest records. a. Overall change in km2 and b. overall change as % of basin size. Earliest recorded positions are, on average, 1958 and latest positions are, on average, 2004.
Although quantifying absolute area of ice loss is important, calculating relative changes is also essential when comparing the behaviour of glaciers with such diverse areas (compare Fig. 6a & b). Glaciers, such as Fleming Glacier, may have shown a large absolute change but this area is a relatively small percentage of its basin size. Similarly, Fuchs Ice Piedmont has a long ice front which has contributed to the large overall ice loss, but the basin size is also large, resulting in a smaller relative change. Trooz Glacier is one of only two glaciers that have advanced by >1 km2, and yet it changed by <1% of its basin size.
Table III shows a significant correlation between glacier basin area and absolute area loss (Spearman’s rank r s =0.51). Although there is a weak correlation between glacier area and relative loss (r s =-0.26), it is significant and negative, implying that smaller basins show larger relative ice loss. When other glacier attributes are correlated against absolute area changes, length and outlet width show significant positive correlations (i.e. the longer glaciers and those with wide fronts have shown large area losses), and mean slope angles show a negative correlation (i.e. the lower the mean slope angle the larger the area loss). When non-scalar variables, such as Class, Form and Front, are included in the analysis against total loss, floating glaciers show a significantly larger mean absolute change than other frontal types. However, there is no correlation between frontal type and relative change. Some of these variables are co-dependent thus conclusions regarding the primary influence on area change cannot be drawn without a multivariate statistical approach.
Table III Spearman’s rank (r s ) correlations between glacier attribute and total change (both absolute change and change relative to basin size as %).

*Significant at<0.01 level.
Regional total area changes show that on the west coast, there is a substantially increasing ice loss from north to south (Fig. 7a). The east coast glaciers have a large overall loss between 64°S–65°S (in the region of Larsen A and Prince Gustav ice shelves), although it must be noted that because the earliest and latest dates differ the overall area loss between 65°S–66°S is only recorded since the Larsen B Ice Shelf collapsed in 2002. The mean first date (weighted by area) for the Larsen B tributary glaciers is 2003; positions were recorded for the Hektoria, Jorum and Crane glaciers in 2002, but records for the Mapple, Melville and Pequod glaciers are not available until 2005 when a further section of the ice shelf collapsed. A north to south gradient in increasing absolute area loss per glacier (Fig. 7b) also indicates that there is a strong regional difference in controls on mass loss. Relative changes (Fig. 7c) in the west do not appear to increase south of 67° but this is probably due to the lack of small glaciers with associated large relative changes. The glaciers in the east show considerably larger mean relative changes at each of the three latitudes than those in the west, which could be explained by the medium-sized glaciers feeding the Larsen A and B ice shelves that retreated rapidly following the demise of the ice shelves. The east and west sides of the AP exhibit markedly different spatial patterns of ice loss, highly influenced by the location of ice shelves.

Fig. 7 a. Sum total area change of all glaciers combined (mean years, weighted by basin size, of the first and last recorded positions are shown along the upper and lower x-axis, respectively), b. median absolute change and c. relative change at each degree latitude. b. and c. show median values to account for the wide range in basin sizes and data are weighted according to the number of years between the first and last dates.
The overall ice loss from earliest to latest positions indicates the amount of change over the longest available time frame, but the earliest dates are not consistent. A way of identifying temporal trends is by assigning every ice-front position to a 5-year interval and measuring all glacier areas relative to the glacier area in the time interval 2000–04, which is the one time interval for which we have data for all glaciers. The temporal trend in area changes is summarized in Fig. 8a. To contend with the varying sample sizes between each interval the data is up-scaled on a spatial basis, by calculating areas from glaciers with data to the rest of the sample, to give an estimation of total area. The number of glaciers with data within each interval is shown in Fig. 8b (data for intervals with<50 glaciers were omitted since reliability from up-scaling would be significantly reduced). These results are based on glaciers with a first date prior to 1995 (816 of 860 glaciers), since a spurious increase in the overall area occurs when first values were added for glaciers post-ice shelf collapse. Furthermore, to reduce misinterpretation of temporal trends from such a large sample size, the results can be assessed against a subset of glaciers that have positional records at as many adjacent intervals as possible (Fig. 9a). The total number of glaciers that have nine or more records since 1945 (n=36) were selected and intervals containing>20 records were up-scaled.

Fig. 8 a. Up-scaled areas for all 816 glaciers with first dates prior to 1995. b. Number of glaciers with ice-front positions in each interval.

Fig. 9 a. Up-scaled areas for all glaciers with frontal records in nine or more time intervals (36 glaciers). b. Number of glaciers with ice-front positions in each interval.
The overall trend shown in both Figs 8a & 9a is of broadly consistent retreat, although differences prior to 1980 mean it is difficult to draw conclusions on any early trends. The main observation from this period is that the area is greater in all pre-1980 intervals than in any interval since. There appears to be a steady decrease in area from the late 1970s through to 2010 for both datasets, with the exception being a notable advance in the late 1990s in the complete dataset. The difference between the two datasets for this interval could be due to one of two reasons: i) the small sample of 36 glaciers does not capture all temporal signals since they are not evenly distributed throughout the AP, or ii) the up-scaling method for the complete dataset is less robust during the 1990s than intervals on either side since fewer glaciers have data at this time. However, the 237 (30%) glaciers with data in 1995–99 are widely distributed throughout the AP and represent all glacier types, thus the area increase is considered to represent a true signal at this time. There is no clear difference in rate of retreat between other adjacent intervals.
The results presented above represent a summary of the changes recorded by the dataset. Further analyses of the spatio-temporal patterns of rates of change, the specific causes of regional differences and the influence of glacier character on temporal patterns of change will be undertaken.
Conclusion
Recent modelling (Hock et al. Reference Hock, de Woul, Radic and Dyurgerov2009, Barrand et al. Reference Barrand, Hindmarsh, Arthern, Williams, Mouginot, Scheuchl, Rignot, Ligtenberg, van den Broeke, Edwards, Cook and Simonsen2013b) has demonstrated that there is a need for a complete inventory of glacier outlines for glacier research in the AP where, not only is the climate distinctly warmer and warming more quickly than elsewhere on the ice sheet, but the smaller glaciers respond more quickly to these higher temperatures. Mapping glaciers in the region poses challenges but, using GIS tools, a high-resolution DEM and criteria set out in GLIMS as a guide, we have compiled outlines of 1590 glacier drainage basins on the mainland and surrounding islands between 63°S–70°S, together with relevant attributes. In addition, ice-front positions from archival records dating back to 1945 have been combined with the outlines resulting in a total of 4343 glacier basin area measurements. The preliminary analysis of the glacier changes shows that 90.5% of the 860 marine-terminating glaciers have reduced in area since the earliest records. There is a clear difference in glacier behaviour between the east and west sides of the AP, with those in the north-east showing greater relative change than those at the same latitude on the west side. There is a north–south gradient of increasing area loss along the west coast and greatest ice loss is strongly associated with the location of recently-collapsed ice shelves. The largest areas have been lost from large glaciers flowing into Wordie Bay in the south-west, and those flowing into the Larsen A and B embayments. These results correspond with other studies that showed mass loss due to glacier acceleration and surface lowering following ice-shelf collapse. Although such a large dataset with a wide range of glacier sizes and types contains significant variability in temporal trends, by up-scaling the area changes we have shown there was a largely uniform retreat from the late 1970s to 2010, punctuated by an advance in the late 1990s. This study has demonstrated the use of the glacier drainage basin dataset to further our understanding of glacier change in the region and can offer a resource for continued glacier monitoring.
Acknowledgements
This work was largely supported through an AXA (global investment and insurance group) Research Fund Fellowship. We are grateful to Christian Kienholz at the University of Fairbanks for providing a test version of his GIS algorithm to produce the initial glacier centreline data. We would like to thank A. Hughes, E. Steig and the anonymous reviewer for their very helpful and constructive comments to improve the manuscript.


 Open access