


Introduction
The development of identifiable tracers capable of tracking mass through a chemical explosion will allow data collection and model confirmation of debris dispersion by tagging the pre-detonation environment with unique luminescent particles. Recently, Anderson et al. used rare-earth-doped-yttria particles mixed with europium-doped zinc oxide nanoparticles to measure spatial tracking and temperature profiles of an explosive event.[Reference Anderson, Gunawidjaja, Diez-y-Riega, Eilers, Svingala, Daniels and Lightstone1] Anderson et al. were able to track an event both spatially and thermally but were plagued by a large amount of optically inactive particles following the test explosion.[Reference Anderson, Gunawidjaja, Diez-y-Riega, Eilers, Svingala, Daniels and Lightstone1] Previous efforts of material tracking date back to the 1950s on atolls in the Pacific Ocean during the nuclear testing era.[Reference Adams and O'Connor2] Tracer particles from a tower explosion were collected on several neighboring islands about 10 miles away. Only one island yielded enough material to measure the tracer particles.[Reference Adams and O'Connor2] Both experiments shed light on valuable information, such as fallout formation and debris origin, but sampling methods were rudimentary and the source material was identified qualitatively.
Ruggedized quantum dots (QDs) protect the signature through the explosion, thereby improving the data accuracy and simplifying sampling. QDs provide a unique photoluminescent signature that can be tuned by the material's composition and electronic confinement.[Reference Rossetti, Nakahara and Brus3,Reference Brus4] Ruggedizing the QDs with an optically transparent sacrificial layer enhances the nanoparticles’ survivability in an explosive event. For this research, zinc sulfide (ZnS) QDs were chosen as the phosphor material due to their intrinsic properties including high-temperature resistance, relatively stable crystalline lattice, photostability, and oxygen tolerance.[Reference Sofekun and Doraiswamy5]
In this paper, we describe the synthesis of ruggedized QDs using a modified Stöber method. The QDs were encapsulated in a silica shell that was functionalized with a thiol-terminated ligand. In conjunction, a larger phosphor—europium-doped strontium aluminate, commercially known as “glow-in-the-dark powder”—was encapsulated in a silica shell and functionalized with an amine-terminated ligand. The particles were covalently linked together by the molecule sulfosuccinimidyl 4-[N-maleimidomethyl] cyclohexane-1-carboxylate (SMCC), followed by water glass suspension of the new heterogeneous particle. The covalent linkage enabled unique photoluminescent peaks stemming from the europium and QDs. The tracers were tested in environments which reached or exceeded temperatures and energies one could expect in a chemical explosion. The tracers showed excellent ruggedness and stability from exploding wire and tube experiments.
Experimental materials and methods
Materials
All non-solvent chemicals were acquired from Sigma-Aldrich and used without further purification. Solvents were acquired from VWR International Inc. and Fischer Scientific Inc.
ZnS synthesis
Briefly, ethylene glycol (10 mL, 18.2 M MΩ-cm) was added to an Erlenmeyer flask and gently heated (50 °C) and stirred (400 rpm). Zinc acetate (31.0 mg, 0.169 mmol) and cetyltrimethylammonium bromide (216 mg, 0.593 mmol) were added to the Erlenmeyer flask. Solid sodium sulfide (55.0 mg, 0.229 mmol) was dissolved in water (10 mL, 18.2 MΩ-cm) and slowly added to the Erlenmeyer flask. The Erlenmeyer flask was capped with a rubber septum and heated to boiling (2 h) with moderate stirring (400 rpm). The doped ZnS QDs followed a similar synthesis (see Table I).[Reference Radhu and Vijayan6,Reference Lu, Lee, Zhong, Tong, Wagner, Park and Summers7]
Table I. QD, dopant, ligand, solvent, and major emission information.

Silication of the QDs and substrate
The silica capping layer was applied using a modified Stöber method.[Reference Mine, Yamada, Kobayashi, Konno and Liz-Marzán8,Reference Zulfiqar, Subhani and Husain9] Nano-pure water (6 mL, 18.2 MΩ-cm) was added to a centrifuge tube (15 mL). Collected QDs (16 mg by ZnS weight) were added to the centrifuge tube and vortex mixed (2 min, on high). Ethanol (4 mL, 65.7 mmol) and 3-mercaptopropyl trimethoxysilane (MPTMS) (5 μL, 0.027 mmol) were added in conjunction to the centrifuge tube. The centrifuge tube was vortex mixed (1 min, on high). Tetraethyl orthosilicate (214 μL, 0.96 mmol) and ammonium hydroxide (100 μL, 2.51 mmol) were added to the centrifuge tube sequentially. The centrifuge tube was sonicated in a bath sonicator with heat (60 min, 60 °C). Silication of the substrate was carried out in a similar fashion.[Reference Mine, Yamada, Kobayashi, Konno and Liz-Marzán8,Reference Zulfiqar, Subhani and Husain9]
Cross-linkage of QDs with the substrate
The cross-linkage between two particle types followed the standard procedure for the industrial linker.[10] The silicated QDs were resuspended in ethanol (10 mL, 0.164 M) in a centrifuge tube (15 mL). MPTMS (10 μL, 0.054 mmol) was added to the centrifuge tube. The solution was vortex mixed (15 min, on high). The substrate (48 mg) was added to a separate centrifuge tube (15 mL). Ethanol (10 mL, 0.164 M) and 3-aminopropyl trimethoxysilane (10 μL, 0.056 mmol) were added to the centrifuge tube. The solution was vortex mixed (15 min, on high). The QDs and the substrate were collected via centrifugation. The substrate was resuspended in a beaker (10 mL) with phosphate-buffered saline (2 mL, pH 7.4). Sulfosuccinimidyl 4-(N-maleimidomethyl) cyclohexane-1-carboxylate (50 μL, 4.5 mM) was added to the buffer solution. The solution was reacted (30 min) while being stirred (1200 rpm). The substrate was collected and resuspended in fresh phosphate-buffered silane (2 mL, pH 7.4). The MPTMS-terminated QDs were added to the buffered solution and reacted (48 h) with stirring (1200 rpm). The cross-linked QDs with the substrate were collected via centrifugation and washed with water (10 mL, 18.2 MΩ-cm). This process was repeated three times to remove unbound QDs from the system.
Suspension of the QD complex to the substrate
The QDs bound to the substrate were added to a centrifuge tube (15 mL). Water (1 mL, 18.2 MΩ-cm) was added to the centrifuge tube and vortex mixed (2 min, on high) followed by sonication (5 min). Sodium silicate (218 mg, 1.18 mmol) was added to the centrifuge tube and vortexed (1 min, on high) followed by sonication with heat (30 min, 20 °C).[Reference Zulfiqar, Subhani and Husain9] The luminescent suspension was then used in all paints and as a tag for the various testing platforms.
Results and analysis
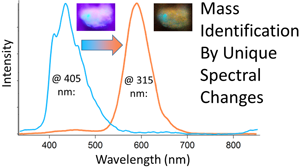
Photoluminescent spectra (HORIBA Scientific, Nanolog, see Supplementary Section 1) for respective QDs and glow-in-the-dark substrates are presented in Fig. 1. These photoluminescent spectra were excited with 325 nm light [Figs. 1(a) and 1(c)] to excite the QDs and substrates, and then with 405 nm light [Figs. 1(b) and 1(d)] to excite the substrates alone. ZnS QDs’ photoluminescent spectrum can be seen to have a peak centered on λ = 431 nm. Upon the incorporation of mid-gap states by the dopants, a red-shift in the spectrum can be observed: λ = 449 nm for terbium, λ = 496 nm for oxygen, λ = 599 nm for Mn, and Pb acted as a red phosphor emitter with a very broad emission. The substrate can be seen to luminesce around λ = 500 nm and become red-shifted or blue-shifted depending on alterations to the internal crystal structure of the material during the manufacturing process. The lower-energy band gap of the commercial substrate allows easy sample debris verification with a standard UVA-I/violet light source [λ ex = 405 nm, Fig. 1(b)], while not exciting the QDs [Fig. 1(d)]. The two emissions nature of the tags allows both field and laboratory identification.

Figure 1. Luminescence stimulation by differing excitation (λ ex) wavelengths. (a) Substrate luminescent intensity excited with λ ex = 325 nm light. (b) Substrate luminescent intensity excited with λ ex = 405 nm light. (c) QD luminescent intensity excited with λ ex = 325 nm light. (d) QD luminescence intensity excited with λ ex = 405 nm light.
The photoluminescence of the bound nanoparticles to the substrate (tracers) can be seen in Supplementary Fig. S1. The particles were excited at λ ex = 325 nm light and can be seen to have characteristic peaks in their spectrum depending on the choice of QDs bound to the substrate. The appearance of shoulder peaks is indicative of the QDs photoluminescence, which can be seen in Supplementary Fig. S1. Supplementary Material Figure S1(a) is a general overview of the emission combinations. The remainder of the spectra for each of the 25 tagged tracers can be found in Supplementary Figs. S1(b)–S1(f). The numerous types of these tracers allows for easy laboratory identification of debris from tagged field experiments.
The morphology of the tags can be seen in Fig. 2, with the morphology of the final layers shown in Supplementary Fig. S2. It can be seen from Fig. 2(a) that the lattice fringes are consistent with wurtzite crystalline morphology intrinsic to this type of ZnS QD synthesis.[Reference Zhao, Zhang, Zhu, Hadjipanayis and Xiao11] Each type of the QDs varies in sizes between 1 and 8 nm, with the majority of the particles having a diameter between 1 and 3 nm. This change in the particle size may be attributed to the different reducing environments.

Figure 2. Structural characterization of QDs by aberration-corrected transmission electron microscope (ACTEM): (a) ACTEM image of the QDs (ZnS doped with terbium shown), (b) ACTEM image of the clustered QDs encased in silica shells, (c) the normalized size distribution of the five types of ZnS QDs, (d) the normalized size distribution of the silica shells, and (e) ACTEM image of a silica shell showing the encased QDs.
From Fig. 2(b) and inset Fig. 2(e), one can see suspended nanoparticles in a silica shell. The shelling of the QDs adds to the robustness of the particles by acting as a sacrificial layer at elevated temperatures and pressures, but also allows photons to transmit through this optical translucent layer. The QDs are encased in the silica shells with an average of 103 ± 15 QDs per shell and an average spacing between neighboring QDs of 2.4 ± 1 nm.
The silica shells are molecularly linked to the substrates, which are nominally 1 µm in diameter [Supplementary Figs. S2(a) and S2(c)]. The QD-covered substrate powders are then suspended in silica gel [Supplementary Figs. S2(b) and S2(d)] to further protect the particles from the explosion and increase the yield of particles optically active (luminescent) in the debris.
The active mass of QDs was quantitatively measured by photoluminescence before and after explosive dispersal in 6.5 cm diameter integrating spheres. Each layer of the tracer was then added in sequence and the active mass was quantified post-detonation. In this fashion, the relative increase in “ruggedness” (i.e., the mass of tracer remaining optically active post-detonation) can be quantified for each tracer layer.
The inner surface of the spheres was coated with barium sulfate to provide a white standard background, and the spheres themselves were printed from black ABS plastic at the highest density allowed by the Stratasys printer. Five milligrams of ZnS:Mn dots (the mass of optical dots was held constant for the experiment) were loaded into each 10 cm long, 800 μm diameter thin-walled steel tube, and the ends were crushed shut. Four types of tracer were evaluated:
1. A control containing only deionized water (the liquid) for the suspension.
2. 5 mg of orange-emitting QDs in deionized water [see Fig. 2(a)].
3. The same mass of QDs now covered in 100 nm thick silica shells [see Fig. 2(b)].
4. Lastly, the same mass of QDs covered in silica shells and suspended in saturated sodium metasilicate (SiO2 gel as denoted in Fig. 3).

Figure 3. Photoluminescence spectroscopy and imaging of integrating spheres. The large callouts are mapping of the orange tracer distribution inside the spheres. A detonated sphere for each layer of the tracer is shown and its corresponding PL spectroscopic response is shown on the calibration line.
Two small holes were drilled in the spheres, and the tubes were fed through so as to pass through the center of the sphere. The devices were loaded into an exploding bridge wire (EBW) generator (see Supplementary Section 4) and detonated with 750 J of energy. The spheres were collected, and the mass of tracer optically active was determined by PL spectroscopy and luminescent imaging.
The mass was quantified by PL spectroscopy (via a fiber optic spectrometer, see Supplementary Section 2) and PL imaging of the spheres split open. The PL spectroscopic intensity was found to increase at a slope of about 310 counts/mg based off of a calibration line. Figure 3 shows the results of the mass quantification. As can be seen in Fig. 3, the addition of each subsequent layer increases the optically active mass on the sphere wall. Supplementary Table SI shows that the fraction of QDs remaining optically active after the explosion increases with the addition of each subsequent layer. The final fraction of surviving particles was 92.5 ± 6.9%, which is an improvement over previous work.[Reference Anderson, Gunawidjaja, Diez-y-Riega, Eilers, Svingala, Daniels and Lightstone1] Lastly, the survivability of the linked particle and the substrate system was evaluated to show the durability of the dual tracer system to the environments of chemical high-explosives.
To test the ruggedness of the dual emission tracers, a bench-scale approach was employed. The tracers were mixed in a 20:1 ratio of tracer to high-temperature paint by weight. The paint was coated with two unique tracers onto 0.002-in. diameter wires by dripping the suspension over differing elemental metal wires in a three-part series (see Supplementary Fig. S3). The tracers were placed in such a way as to look at the position of each tracer in the debris field relative to its starting position on the wire.
The wires were then placed in an EBW generator (see Supplementary Section 4).[Reference Liezers, Carman and Eiden12] Supplementary Figure S6 shows the data from the vaporized wires. Images from the pre- and post-detonation can be found in the Supplementary Figs. S3 and S4. Mass loss data are not possible from this experiment as in all cases the high-temperature paint contained portions of nanoparticles generated from the exploding wire, which has been also reported in the literature.[Reference Kotov13,Reference Cho, Choi, Kang and Lee14] The tracers were exposed to relevant specific energies that one could expect in an explosive environment (Supplementary Fig. S6).[Reference Kennedy15] The wires were detonated at different specific energies and saw the uniform performance with minimal degradation to the particles at specific energies that in some cases nearly doubled what would be expected from conventional chemical explosives.
Fluorescent spectra from the pre- and post-detonated tracers show good agreement of the peak emissions (see Supplementary Figs. S3 and S4). There are slight shifts of the peaks upon detonation (see Supplementary Fig. S7), which may be caused by changes in the crystalline structure due to the high temperatures of the explosions. However, there still appears to be a good agreement in the overlapping pre- and post-spectra, indicating that the dual emission systems retained their luminescent signature post-explosion.
An appearance of a new peak, which has formed from λ = 485–508 nm in both the post red and blue tracer, may be indicative of partial oxidation of the tracer. This peak is likely due to oxidation, as both substrate and tracer evolved a green luminescence during static temperature testing (see Supplementary Fig. S5).[Reference Ross, Zinke, Chace and Moore16] The development of a partially oxidized tracer emission further corroborates the findings shown in Fig. 3 and Supplementary Table SI, as a portion of the tracer is rendered optically inactive, the oxidized green-emitting tracer is hypothesized to be an intermediate step to the thermal inactivation of the system.
Conclusion
Twenty-five different tracers were synthesized from ZnS QDs combined with commercially available luminescent powders. The addition of solution grown silica and suspension in saturated sodium metasilicate solution each increased the optically active tracer mass in the debris field. The tracer showed excellent ruggedness and stability from exploding wire and tube experiments, which reached or exceeded temperatures and energies one could expect in a chemical explosion. This ruggedness can be attributed to the growth of the protective silica layer around the QDs and the intrinsic stability of ZnS- and Eu-doped strontium aluminate. The pre- and post-detonation unique luminescent spectra of the orange-red and orange-blue tracers showed good agreement in their spectral emissions, which would allow confirmation of post-detonated material for modeling purposes. These tracers showed promising preliminary results and future efforts will focus on scalability, material adhesion, and tracer mapping for model confirmation.
Supplementary material
The supplementary material for this article can be found at https://doi.org/10.1557/mrc.2020.70.
Acknowledgments
This research was funded by the National Nuclear Security Administration, Defense Nuclear Nonproliferation Research and Development (NNSA DNN R&D). The authors acknowledge important interdisciplinary collaboration with scientists and engineers from LANL, LLNL, MSTS, and SNL.
The authors gratefully thank the Environmental Molecular Science Laboratory (EMSL), a DOE Office of Science User Facility for characterization access and expertise. Specifically, the authors thank Dr. Libor Kovarik for his transmission electron microscopy (TEM) expertise, Dr. Odeta Qafoku for her assistance with the scanning electron microscope (SEM), Dr. Zheming Wang for access to a photoluminescence spectrometer, and Dr. Scott Lea for his coordination efforts.


 Open access