


Introduction
Suckler beef systems in temperate climates are designed to offer a high inclusion (92%) of grazed and conserved herbage in the animal's diet (Drennan and McGee, Reference Drennan and McGee2009), as grazed pasture is the cheapest prevalent feed source (Finneran et al., Reference Finneran, Crosson, O'Kiely, Shalloo, Forristal and Wallace2012). Consequently, increasing individual animal live-weight gain and stocking rate from grazed pasture, coupled with minimizing the use of expensive feedstuffs, especially concentrates, are key profit drivers in grass-based beef production systems (Finneran and Crosson, Reference Finneran and Crosson2013; Taylor et al., Reference Taylor, Crosson, Kelly and McGee2018). In this regard, grazing management technologies need to be investigated to further improve the stocking rate and animal live-weight gain from pasture within these low-cost beef systems (Sitienei et al., Reference Sitienei, Gillespie and Scaglia2015).
In grass-based weanling-to-beef suckler steer systems, spring-born single-suckled calves are weaned at 7 months of age. After weaning calves are offered grass silage and a low level of supplementary concentrates during an indoor ‘store’ feeding period. This is followed by a ‘second’ grazing season to take advantage of compensatory growth, and lastly an indoor finishing period based on grass silage plus concentrates before slaughter at 24 months of age (Drennan and McGee, Reference Drennan and McGee2009; Herron et al., Reference Herron, Curran, Moloney, McGee, O'Riordan and O'Brien2021). The rising popularity of 100% ‘grass-fed’ beef (Sitienei et al., Reference Sitienei, Gillespie and Scaglia2015) has encouraged the development of forage-only systems, without any supplementary concentrates. However, achieving a commercially acceptable carcass fat score (fat score ≥6.0, scale 1–15) on forage-only systems can be difficult with late-maturing breed suckler steers, the predominant genotype in Ireland (Regan et al., Reference Regan, McGee, Moloney, Kelly and O'Riordan2018). In this context, strategies to maximize animal growth at pasture and thus subcutaneous fat accretion are critical as the use of concentrates is precluded during the ‘finishing’ phase (Doyle et al., Reference Doyle, McGee, Moloney, Kelly and O'Riordan2021).
Within technically efficient rotational grazing systems, pre-grazing herbage mass (PGHM) and post-grazing sward height (PGSH) influence pasture allocations and sward nutritive value (Frame and Laidlaw, Reference Frame and Laidlaw2011; Donaghy et al., Reference Donaghy, Bryant, Cranston, Egan, Griffiths, Kay, Pembleton and Tozer2021), and individually they have been shown to influence live-weight gain and stocking rate of beef cattle at pasture (Doyle et al., Reference Doyle, McGee, Moloney, Kelly and O'Riordan2021, Reference Doyle, McGee, Moloney, Kelly and O'Riordan2022). Compared to lactating dairy cows, grazing guidelines for beef cattle on rotational grazing temperate pasture are much less developed. Dairy cow studies in temperate climates recommend a PGSH of ca. 3.5–4 cm to optimize herbage production, sward nutritive value, stocking rate and animal output/ha (Ganche et al., Reference Ganche, Delaby, O'Donovan, Boland, Galvin and Kennedy2013; McCarthy et al., Reference McCarthy, Pierce, Delaby, Brennan, Fleming and Horan2013, Reference McCarthy, Wims, Kay, Chapman and MacDonald2014; Donaghy et al., Reference Donaghy, Bryant, Cranston, Egan, Griffiths, Kay, Pembleton and Tozer2021). Additionally, a PGHM of ca. 1500 kg DM/ha (measured above 4 cm) is commonly recommended to optimize grazing to a PGSH of 4 cm and in order to maintain high herbage nutritive value (Curran et al., Reference Curran, Delaby, Kennedy, Murphy, Boland and O'Donovan2010; McCarthy et al., Reference McCarthy, Wims, Kay, Chapman and MacDonald2014; Donaghy et al., Reference Donaghy, Bryant, Cranston, Egan, Griffiths, Kay, Pembleton and Tozer2021). However, these grazing recommendations for dairy cows normally encompass strategic concentrate supplementation to ensure that milk solids production per hectare is maintained (Curran et al., Reference Curran, Delaby, Kennedy, Murphy, Boland and O'Donovan2010; McCarthy et al., Reference McCarthy, Pierce, Delaby, Brennan, Fleming and Horan2013). Although these ‘dairy derived’ grazing guidelines are now recommended for beef cattle (Maher, Reference Maher2017), they may not be directly relevant to beef grazing systems, because most commercial beef farms have substantially lower stocking rates (1.6 livestock units/ha) than commercial dairy farms (2.1 livestock units/ha) (Teagasc, 2020a, 2020b) and concentrate supplementation at pasture is generally not an inherent practice recommended for technically efficient beef grazing systems (Taylor et al., Reference Taylor, Crosson, Kelly and McGee2018). Increasing PGSH from ca. 4.0 to ca. 6.0 cm can increase individual intake of beef cattle resulting in greater growth rate equivalent to 30 kg live-weight during a ca. 200-day grazing season (O'Riordan et al., Reference O'Riordan, Keane and McGee2011b, Reference O'Riordan, McNamee, Keane, Buckley and McGee2011c; Doyle et al., Reference Doyle, McGee, Moloney, Kelly and O'Riordan2021). Furthermore, increasing PGHM is reported to increase (Doyle et al., Reference Doyle, McGee, Moloney, Kelly and O'Riordan2022) (1500 v. 2000 kg DM/ha) or have no impact (Humphreys et al., Reference Humphreys, O'Riordan and O'Kiely2001) (2000 v. 3500 kg DM/ha) on steer live-weight gain. However, to the authors' knowledge, there are no published peer-reviewed studies that have examined the interactive effect of PGHM and PGSH on the sward nutrient concentration, beef animal grazing behaviour and their associated effect on animal dry matter intake (DMI) and live-weight gain at grass, and this information is required. Similarly, the residual impact of grazing management practices on steer performance during the subsequent indoor finishing period and on carcass traits needs to be determined.
Additionally, the impact of the interactive effect of PGHM and PGSH on herbage production in grass-based weanling-to-beef suckler systems needs to be quantified (Doyle et al., Reference Doyle, McGee, Moloney, Kelly and O'Riordan2021). Increasing PGSH above 4 cm reduces herbage production (Frame and Hunt, Reference Frame and Hunt1971; Doyle et al., Reference Doyle, McGee, Moloney, Kelly and O'Riordan2021) and consequently grazing stocking rate or the quantity of grass silage preserved for the indoor winter feeding period (Doyle et al., Reference Doyle, McGee, Moloney, Kelly and O'Riordan2021). On the other hand, increasing PGHM above 1400–1500 kg DM/ha, whilst maintaining a constant PGSH of 4 cm, increases annual herbage production (Wims et al., Reference Wims, Delaby, Boland and O'Donovan2014; Doyle et al., Reference Doyle, McGee, Moloney, Kelly and O'Riordan2022). Increasing PGSH to increase animal live-weight gain and increasing PGHM to increase herbage production could potentially increase live-weight gain/ha of grazing systems and this requires investigation.
Therefore, using suckler bred steers operated in a weanling-to-beef production system, the objectives of the current study were to investigate the effects of PGHM and PGSH on (1) the accumulation and nutritive value of herbage, (2) grazing behaviour, DMI and growth of suckler-bred steers grazing these pastures, (3) the subsequent impact of indoor finishing diet on performance and carcass characteristics and (4) the overall carcass gain/ha of these grazing systems.
Materials and methods
The current study was conducted at Teagasc, Grange Research Centre, Ireland (longitude 6˚40'W; latitude 53˚30′N; elevation 92 m a.s.l.) between October 2018 and April 2020, on a moderately well-drained brown earth with gleying and clay loam texture soil type. A total of 660 mm of rain and a soil temperature (50 mm depth) of 13.1°C were recorded at the Centre during the 2019 grazing season (March to October). This compares to a 13-year average of 568 mm and 12.9°C, respectively. Annual herbage growth at the Centre during the 2019 grazing season was comparable to the 13-year average, with spring grass growth above average, i.e. ‘earlier’ (Fig. 1).

Figure 1. Daily grass growth for 2019 compared to the previous 13-year average at Teagasc Grange.
Animal procedures performed in this experiment were approved by the Teagasc Animal Ethics Committee and were conducted in accordance with the European Communities Regulation 2002 and 2005.
Production system, animal management and experimental design
Animals were produced within a suckler weanling-to-beef production system and slaughtered at 24 months of age as described previously (Regan et al., Reference Regan, McGee, Moloney, Kelly and O'Riordan2018). Ninety-six spring-born, Charolais-sired recently weaned bulls (351 ± 16.5 kg) bred from suckler crossbred dams were sourced from commercial livestock marts in Ireland and transferred to Grange Research Centre in mid-October, at 7.5 months of age. Following arrival at the Centre, and subsequently as required, animals were treated for internal and external parasites (Ivermectin and Closantel, Closamectin, Norbrook Laboratories, Monaghan, Ireland; 1 ml/10 kg of live-weight), and vaccinated against Clostridial (Covexin 10, Zoetis, Dublin, Ireland; 2 ml per animal, administered twice) and respiratory diseases (Rispoval 3 and Rispoval IBR, Zoetis, Dublin, Ireland; 4 and 2 ml per animal, respectively, administered twice). At 8 months of age, animals were castrated with a ‘burdizzo’ by a veterinarian and returned immediately to pasture, where they remained there for 4 weeks before housing. For the ‘first’ winter steers (360 ± 21.3 kg) were housed in slatted floor pens in groups of seven (lying area = 2.84 m2/animal) and fed grass silage only (in vitro DM digestibility (DMD), 751 g/kg) ad libitum, plus a mineral and vitamin supplement for 129 days. Mean steer daily silage DMI and daily live-weight gain was 5.53 kg DM and 0.34 kg during this period, respectively.
In early-March prior to turnout to pasture, steers were weighed indoor on two consecutive days, blocked on descending live-weight, and from within block randomly assigned to one of 12 grazing groups. Groups were randomly assigned to a two (PGHM > 4 cm: 1500 or 2500 kg DM/ha) × two (PGSH: 4 or 6 cm compressed height) factorial arrangement of treatments, with three replicate groups of eight steers per treatment. Steers were turned out to pasture on 21 March 2019, where they rotationally grazed Lolium perenne-dominant swards in their replicate grazing groups for 222 days.
At the end of the grazing season (29 October), steers (534 ± 35.6 kg) were housed in concrete slatted floor pens in their respective sub-groups (lying area = 2.68 m2/animal) for the finishing period. Within grazing group, steers were blocked on live-weight and randomly assigned to one of two indoor finishing diets offered individually for 146 days; (1) grass silage (752 g/kg DMD) ad libitum (proportionately 0.1 in excess of daily intake) supplemented with 3.75 kg concentrate DM (SC) or (2) grass silage only (SO) ad libitum plus a mineral-vitamin supplement. The concentrate was a coarse mixture comprised of 862 g/kg fresh weight rolled barley, 60 g/kg soyabean meal, 50 g/kg molasses and 28 g/kg mineral-vitamin and, following gradual introduction over 10 days, was offered once daily on top of the silage. The general-purpose mineral-vitamin supplement (calcium 25.0%, sodium 12.4%, vitamin A 500 000 IU/kg, vitamin D3 100 000 IU/kg, vitamin E 1500 mg/kg, vitamin B12 750 mg/kg and vitamin B1 250 mg/kg) was offered to SO on top of the silage at a rate equivalent to that offered in the concentrates for SC. At the start of the indoor finishing period, all animals were administered a copper bolus based on blood test results. At all times, animals had continuous access to clean, fresh water. At the end of the indoor finishing period, animals were slaughtered in a commercial abattoir at ca. 24 months of age.
Pasture management
The experimental area was a 27.4 ha permanent grassland area (20 years) that was initially divided equally between grazing and silage production. Based on expected annual herbage supply and animal feed demand, a global stocking rate of 3.51 steers/ha (2.46 livestock units/ha) was set across the grazing and silage production area and mean turn-out stocking rate was 2776 kg live-weight/ha on the grazing area. The grazing area comprised of five adjacent land blocks totalling 60 permanent paddocks (0.228 ha each) and from within land block, paddocks were assigned to one of 12 equal-sized 1.14 ha grazing area farmlets (balanced for starting herbage supply). Farmlet was randomly assigned to a grazing group. Each permanent paddock was further divided into three sub-paddocks (15 sub-paddocks per grazing group on the grazing area). At the beginning of the grazing season, a ‘base’ or ‘starting’ sub-paddock was assigned to each farmlet. For every grazing rotation, each grazing group grazed their base sub-paddock first and the grazing rotation cycle finished when the pasture supply on their respective base sub-paddock had returned to the assigned PGHM. Paddocks not grazed in each cycle were harvested as baled silage; yield of herbage removed was determined via lawnmower cuts (as below). During any periods of feed deficit (when the next sub-paddock to be grazed was below the assigned PGHM), a grazing group moved to their respective silage area farmlet (see below), and returned to their respective grazing area farmlet when the next sub-paddock attained the assigned PGHM. The herbage yield and area grazed on the silage farmlet was determined. PGSHs were checked twice daily using a rising plate meter (Jenquip, Feilding, New Zealand) and cattle remained in the sub-paddock until the assigned PGSH was achieved. Therefore, sub-paddock residency time varied between treatments. Daily herbage allowance per steer was calculated as [(PGHM/daily area grazed)/no. of animals].
The allocated silage production area consisted of four separate land parts, each of which was sub-divided into four equal-sized plots (ca. 0.855 ha), which were randomly assigned to the four grazing treatments. Collectively, this resulted in four separate silage farmlets (3.42 ha), which provided grass silage for the indoor winter periods (of which area and yield were determined via lawnmower cuts (as below)), and were used as an additional grazing area during periods of feed deficit, especially during the latter part of the grazing season when grass growth naturally declined.
Grazing paddocks were not mechanically topped, except when removing herbage in excess of grazing needs (as silage). Each farmlet received 150 kg chemical nitrogen/ha up to the end of August on the grazing area. On each of the silage production areas, 128, 99 and 84 kg nitrogen/ha (totalling 311 kg nitrogen/ha) were applied prior to the first, second and third silage cuts, respectively, which were harvested correspondingly on 11 May, 24 June and 12 August. The application rates of phosphorus and potassium fertilizers were determined by soil recommendations (Alexander et al., Reference Alexander, Black, Boland, Burke, Carton, Coulter, Culleton, Dillon, Hackett and Humphreys2008).
Pasture measurements
A rising plate meter was used to measure pre- and post-grazing compressed sward height, where 30 random heights in each sub-paddock (~395 heights/ha) were recorded. PGHM (kg DM/ha) (>4 cm) was estimated based on these heights using the equation of O'Riordan et al. (Reference O'Riordan, Devaney and French1997). PGHM was directly determined from 4 and 6 cm, as appropriate, with a rotary lawnmower as described by Doyle et al. (Reference Doyle, McGee, Moloney, Kelly and O'Riordan2021). Additionally, in the swards grazed to 6 cm, herbage mass was measured monthly in the 4–6 cm horizon using a lawnmower, to determine herbage mass between 4 and 6 cm, to facilitate measuring PGHM, herbage accumulation, growth, utilization, excess herbage mass removed at each silage cut, herbage mass removed and grazing group DMI from a constant height (4 cm) for all treatments. Herbage growth, annual herbage accumulation, herbage mass removed, herbage utilization and grazing group DMI were calculated according to Doyle et al. (Reference Doyle, McGee, Moloney, Kelly and O'Riordan2021). Canopy density (above the assigned PGSH), rotation (or stocking) cycle and rest period were calculated as specified by Allen et al. (Reference Allen, Batello, Berretta, Hodgson, Kothmann, Li, McIvor, Milne, Morris and Peeters2011). On the grazing area, sward leaf, stem and dead herbage mass and proportion were measured above the allotted PGSH (4 or 6 cm, as appropriate) according to Doyle et al. (Reference Doyle, McGee, Moloney, Kelly and O'Riordan2021).
The vertical distribution of the sward biomass and chemical composition were estimated throughout the grazing season. In the ‘base’ sub-paddock of each grazing group, 15 pre-grazing herbage ‘grab’ samples were taken randomly from ground level using a scalpel in May (vegetative stage), June (reproductive stage) and September (post-reproductive stage). Samples were composited in the laboratory while still maintaining their straight vertical distribution. A 500 g sub-sample was placed under a guillotine blade and cut from ground level to the grazing horizon (4 or 6 cm) and cut into 4 cm layers thereafter until the top of the canopy was reached, where layer 1 represented the bottom of the plant. Thus, PGSH-6 was cut into layers of 0–6 cm (layer 1), 6–10 cm (layer 2), 10–14 cm (layer 3), 14–18 cm (layer 4), 18–22 cm (layer 5) and 22–26 cm (layer 6), etc. Each layer was dried at 40°C to a stable weight, for chemical analysis and DM yield determination, with yield being corrected for ash content. The first five layers (from ground level) were individually ground and the remaining layers were composited and ground through a Wiley mill (1 mm aperture; Arthur H. Thomas, Philadelphia, PA, USA) in preparation for chemical analysis.
Cutting plots
The effect of PGHM and PGSH on herbage growth and accumulation was also determined separately in L. perenne-dominant experimental plots (5 m × 2 m) representative of the grazing area, between 17 April 2019 and 29 October 2019. The simulated grazing treatments were replicated four times in a fully randomized complete block design. All four replicate plots were cut to their respective PGSH (4 or 6 cm) (using a lawnmower; 0.53 m × 5 m strip) throughout the grazing season when they attained their targeted PGHM, which was estimated via rising plate meter. Herbage growth and accumulation for the cutting plots were calculated as described by Doyle et al. (Reference Doyle, McGee, Moloney, Kelly and O'Riordan2021). Furthermore, on 17 April 2020, all 16 cutting plots were cut to their assigned PGSH to determine the preceding winter and early spring growth of the respective treatments.
Animal measurements
During both indoor winters, individual animal intake was measured using electronically controlled Calan gates (American Calan Inc., Northwood, NH, USA) as described previously (Doyle et al., Reference Doyle, McGee, Moloney, Kelly and O'Riordan2021).
The RumiWatch noseband sensor (Itin & Hoch GmbH, Liestal, Switzerland) (Werner et al., Reference Werner, Viel, Niederhauser, O'Leary, Umstatter and O'Brien2018) was used to monitor each steer's grazing behaviour for four consecutive days between 12 and 30 August (day 144–162 of the grazing season). The RumiWatch converter V.0.7.3.36 was used to convert the grazing behaviour data into 1 h summaries (Itin & Hoch GmbH) (Werner et al., Reference Werner, Viel, Niederhauser, O'Leary, Umstatter and O'Brien2018; Norbu et al., Reference Norbu, Alvarez-Hess, Leury, Wright, Douglas, Moate, Williams, Marett, Garner and Wales2021). During this 4-day measurement period, herbage was offered to each grazing treatment group on a 48 h schedule, allowing each grazing treatment group to graze their respective PGHM to PGSH twice. Grazing behaviour was successfully measured on all 96 animals over 3 weeks.
Live-weight was recorded every 2 weeks during the trial using a calibrated scales (Tru-Test XR3000, load bars XHD 10 000, Auckland, New Zealand) and recorded on two consecutive days at important time points as detailed in Doyle et al. (Reference Doyle, McGee, Moloney, Kelly and O'Riordan2021). All grazing groups were moved to a new-sub-paddock the evening before weighing in an effort to equalize gut fill between the different treatments. After weighing, steers returned to their original sub-paddock if they had not attained their PGSH the evening before. Indoors, steers were weighed at 8 a.m. prior to their morning feeding. The cumulative live-weight over a specific length of time was used to determine live-weight gain.
Using an automatic real-time scanner (model – ECM ExaGo Veterinary scanner, with a 3.5 MHz linear transducer, IMV imaging, Meath, Ireland), animals were ultrasonically scanned at turnout to pasture, housing for the finishing period and pre-slaughter to determine M. longissimus and back fat depth as outlined by Lenehan et al. (Reference Lenehan, Moloney, O'Riordan, Kelly and McGee2017).
Post-slaughter, cold carcass weight was estimated as 0.98 of hot carcass weight. Kill-out proportion was determined by dividing the cold carcass weight by pre-slaughter live-weight. Carcasses were graded mechanically for conformation and fat score on a continuous 15-point scale according to the EU beef carcass classification system (Mezgebo et al., Reference Mezgebo, Moloney, O'Riordan, McGee, Richardson and Monahan2017).
Systems output/ha measurements
Grazing area used per rotation and the area of excess herbage removed per rotation (from the grazing area only) were calculated using the same equations as Wims et al. (Reference Wims, Delaby, Boland and O'Donovan2014). Stocking rate, live-weight gain/ha, total silage demand for a weanling-to-beef steer system and total silage preserved were calculated using the same equations as Doyle et al. (Reference Doyle, McGee, Moloney, Kelly and O'Riordan2021).
Feed sampling and analysis
Herbage samples were obtained from every pre-grazing cut and pooled into monthly samples for each grazing group. Representative samples of supplied grass silage and concentrates were collected twice weekly at feed out and pooled into bi-weekly and monthly samples, respectively. Sample processing, in vitro organic matter digestibility (OMD), neutral cellulose plus gammanase digestibility, chemical analysis (crude protein (CP); neutral detergent fibre (NDF); acid detergent fibre (ADF); water soluble carbohydrates (WSC); ash) and estimated Unité Fourragère Viande (UFV) of grazed herbage, grass silage and concentrates was conducted using the methods reported by Doyle et al. (Reference Doyle, McGee, Moloney, Kelly and O'Riordan2021). The DM, DMD, NDF, CP and UFV concentration of the grass silage offered during the first winter were 313 g/kg, 0.762 DMD, 438, 156 g/kg DM and 0.828 kg DM, respectively. Corresponding values during the finishing period were 287 g/kg, 0.752 DMD, 455, 166 g/kg DM and 0.816 kg DM. The concentrate DM, neutral cellulase gammanase digestibility, NDF, CP and UFV concentration were 788 g/kg, 934, 143, 141 g/kg DM and 1.20 kg DM, respectively.
Statistical analysis
Model assumptions (constant variance and normal distribution) were checked using residual diagnostics. Animal data pertaining to the grazing season, grazing behaviour for each of the two consecutive 24 h measurement periods and systems output/ha (stocking rate, live-weight gain/ha, silage preserved, etc.) were statistically analysed using the MIXED procedure of statistical analysis software (SAS, version 9.4) (SAS Institute; Cary, NC, USA) where the experimental unit was grazing group or farmlet, as appropriate (grazing model). The grazing model contained fixed effects for PGHM, PGSH and their interactions. Differences between means were tested for significance using the PDIFF statement and adjusted by Tukey, as appropriate. Animal data pertaining to the finishing period and post-slaughter characteristics were analysed using a similar model except the experimental unit was the sub-group (finishing diet) within the previous PGHM × PGSH grazing group and the statistical model contained PGHM, PGSH, finishing diet and their interactions as fixed effects, and the interaction between grazing group, PGHM and PGSH as a random effect.
Herbage nutritive values were analysed using the grazing model with repeated measures used for each month of the grazing season. Vertical herbage distribution data were analysed using the grazing model for each of the three monthly measurement periods and sward horizon layer was added to the model as a fixed effect.
Data for all other measurements pertaining to pasture measurements, herbage production and rotation cycles were analysed using the MIXED procedure of SAS, with the sub-paddock as the experimental unit. The structure of the paddocks did not allow a full randomization of the sub-paddocks because sub-paddocks within paddock shared a common treatment. To take possible spatial correlation between sub-paddocks within treatment into account, a spatial correlation model was added to the analysis model. The spatial model was fitted with a repeated statement in the MIXED procedure of SAS. Data averaged per sub-paddock were weighted for frequency of grazing (i.e. the number of times the sub-paddock was defoliated). Differences between means were tested for significance using the PDIFF statement and adjusted by Tukey. For total silage produced on the grazing area, the assumption of normal distribution was not met due to the presence of excess null values (i.e. a lot of paddocks were not cut for silage), so a distribution-free approach using randomization analysis from the macro code of Cassell (Reference Cassell2002) was used. For repeated measures over time, a third dimension was added to the spatial model to capture correlations over time. Repeated measures were broken into early- (spring vegetative stage in March, April and May), mid- (reproductive phase in June and July) and late- (autumn vegetative stage in August, September and October) season growth. The number of data points in each season differed. Data were considered statistically significant when P < 0.05 and considered a tendency towards statistical significance when P < 0.10.
Results
Sward characteristics
There was no PGHM × PGSH interaction (P > 0.05) for structural characteristics or characteristics relating to pasture supply (daily herbage allowance and daily area grazed) except for excess herbage mass removed at each silage cut on the grazing area (P < 0.001), where 1500-4 was the same as 1500-6 but 2500-4 was greater than 2500-6 (Table 1). Compared to PGHM-1500, PGHM-2500 had a greater (P < 0.001) PGHM, sward height, herbage mass removed, grazing utilization and residency time, and a lower (P < 0.001) daily area grazed. Compared to PGSH-4, PGSH-6 had a similar PGHM (above 4 cm) and sward height, and a lower canopy density (P < 0.001), herbage mass removed (P < 0.001) and grazing utilization (P < 0.001). Further, PGSH-6 had a greater (P < 0.001) daily herbage allowance and daily area grazed, and consequently, a shorter (P < 0.001) residency time.
Table 1. Effect of pre-grazing herbage mass (PGHM – 1500 or 2500 kg dry matter (DM)/ha) and post-grazing sward height (PGSH – 4 or 6 cm) on sward structural characteristics, sward morphology and herbage feed allowance

s.e.m., standard error of the mean for PGHM × PGSH.
1 Measured above 4 cm only. The measured herbage mass between 4 and 6 cm grazing horizon is 495 kg DM/ha.
2 Measured from the height of the assigned PGSH (4 or 6 cm).
3 PGHM × time interaction for stem proportion (P = 0.035), values for spring, summer and autumn were 21, 31 and 17 and 22, 43 and 16% for PGHM-1500 and PGHM-2500, respectively.
4 DHA, daily herbage allowance is as a result of systems effect and was not an imposed management tool.
5 Excess herbage mass is the average yield of silage removed per cut from the grazing area only (excluding silage area).
a,b,c means within a row with different superscripts differ (P < 0.05).
There was a PGHM × PGSH interaction for leaf (P = 0.050) and stem (P = 0.008) proportions, and leaf:stem ratio (P = 0.016), whereby 1500-6 and 2500-6 did not differ but 2500-4 had a lower leaf proportion and leaf:stem ratio, and greater stem proportion than 1500-4 (Table 1). There was also a PGHM × PGSH interaction for pre-grazing stem mass (P = 0.004) whereby 1500-4 and 1500-6 did not differ, but 2500-4 was greater than 2500-6 (Table 1). There was a PGHM × time interaction for stem proportion (P = 0.035), whereby PGHM treatments did not differ in early- and late-season but PGHM-2500 was greater than PGHM-1500 in mid-season. Proportion of dead material did not differ between PGHM treatments but was greater (P = 0.034) for PGSH-6 than PGSH-4.
Sward nutritive value
There were no PGHM × PGSH × month or PGSH × month interactions for grazed herbage DM, in vitro digestibility and chemical composition (Table 2). There was a PGHM × month interaction for OMD (P = 0.027), CP (P < 0.001), NDF (P = 0.018), ADF (P < 0.001) and WSC (P = 0.038) concentrations, whereby differences between PGHM treatments for OMD, CP, NDF and ADF concentration were lowest pre-reproductive stage (April and May) and largest at the end of the reproductive stage in August. There was a PGHM × PGSH interaction for CP (P = 0.004) and NDF (P = 0.049) concentrations. For NDF concentrations, 2500-4 was greater than 1500-4, but 1500-6 and 2500-6 did not differ. For CP concentration, 2500-6 was greater than 2500-4, but 1500-4 and 1500-6 did not differ (Table 2). In vitro OMD and ADF concentration did not differ between PGSH treatments.
Table 2. Effect of pre-grazing herbage mass (1500 or 2500 kg dry matter (DM)/ha) and post-grazing sward height (4 or 6 cm) on DM concentration, in vitro digestibility and chemical composition of grazed herbage

OMD, in vitro organic matter digestibility; CP, crude protein; NDF, neutral detergent fibre; ADF, acid detergent fibre; WSC, water soluble carbohydrates; Ash, crude ash.
1 Measured from the height of the assigned PGSH (4 or 6 cm).
s.e.m. = standard error of the mean for PGHM × PGSH.
a,b,c means within a row with different superscripts differ (P < 0.05).
Sward vertical distribution
The vertical distribution of in vitro digestibility and chemical composition of the herbage for the grazing season is presented in Table 3 (monthly values are presented in Supplementary Table 1).
Table 3. Effect of pre-grazing herbage mass (1500 or 2500 kg dry matter (DM)/ha) and post-grazing sward height (4 or 6 cm) on the vertical distribution of in vitro digestibility and chemical composition of the sward

Layer 1; ground level to the base of the grazing horizon; layer 6, top of the plant.
OMD, in vitro organic matter digestibility; CP, crude protein; NDF, neutral detergent fibre; ADF, acid detergent fibre; WSC, water soluble carbohydrates; Ash, crude ash.
1 PGHM × layer interaction (P = 0.022): values of 320 v. 330, 293 v. 318, 275 v. 305, 264 v. 288, 245 v. 272, 218 v. 256 for PGSH-4 v. PGSH-6 in layers 1, 2, 3, 4, 5 and 6, respectively.
2 PGSH × layer interaction (P = 0.034): values of 310 v. 340, 296 v. 314, 284 v. 296, 272 v. 280, 251 v. 265, 235 v. 239 for PGHM-1500 v. PGHM-2500 in layers 1, 2, 3, 4, 5 and 6, respectively.
3 s.e.m. = standard error of the mean for PGHM × PGSH.
4 s.e.m. = standard error of the mean for layer.
5 There were no PGHM × PGSH × Layer interactions.
a,b,c means within a row with different superscripts differ (P < 0.05).
OMD and CP concentration decreased and NDF, ADF and ash concentrations increased (P < 0.001) from the top (layer 6) to the base (layer 1) of the plant (Table 3). There was a PGHM × layer interaction (P = 0.022) for ADF concentration, whereby concentration did not differ between PGHM treatments below the grazing horizon (layer 1), but was greater (P < 0.001) for PGHM-2500 than PGHM-1500 above the grazing horizon (layer 2 to 6). There were PGSH × layer interactions (P = 0.034) for ADF concentration, whereby PGSH-6 had a greater (P = 0.021) ADF concentration than PGSH-4 below the grazing horizon (layer 1), but did not differ above the grazing horizon (layer 2 to 6).
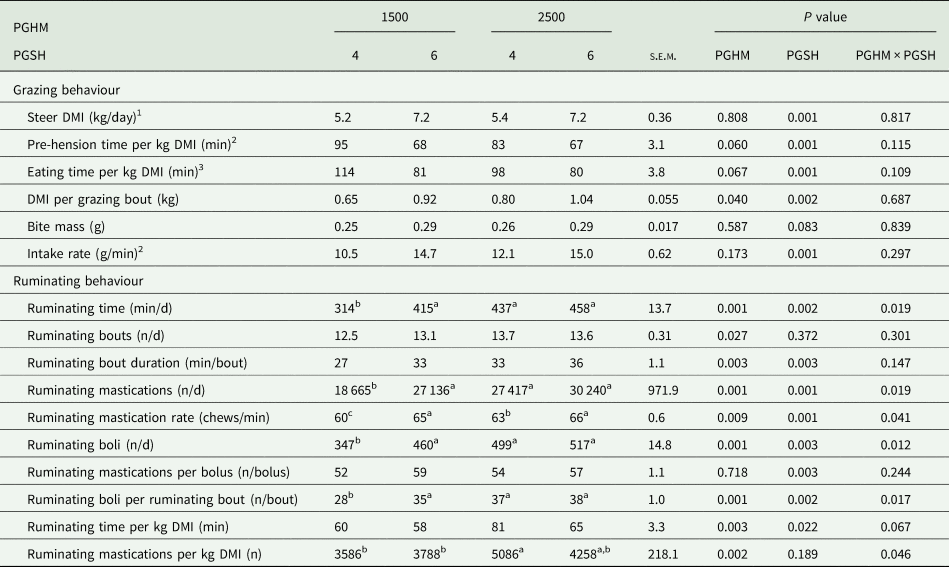
Grazing and ruminating behaviour
During the 48 h grazing behaviour measurement period, there were no PGHM × PGSH interactions or effect of PGHM (P > 0.05) on DMI, bite mass and intake rate (Table 4); however, PGHM-2500 tended to have a lower (P = 0.067) eating time per kg DMI and had a greater (P = 0.040) DMI per grazing bout than PGHM-1500. Compared to PGSH-4, PGSH-6 had a greater DMI, intake rate and DMI per grazing bout (P < 0.001), tended to have a greater bite mass (P = 0.083) and had a lower (P < 0.001) eating time per kg DMI. For rumination parameters, there was a PGHM × PGSH interaction for ruminating mastications per kg DMI (P = 0.0046), ruminating time (P = 0.019), mastications (P = 0.019), mastication rate (P = 0.041), number of boli (P = 0.012) and boli per ruminating bout (P = 0.017), whereby 1500-4 was lower than 2500-4, but 1500-6 and 2500-6 did not differ. Rumination parameters for the first and second 24 h of the 48 h allocation are outlined in Supplementary Table 2.
Table 4. Effect of pre-grazing herbage mass (1500 or 2500 kg dry matter (DM)/ha) and post-grazing sward height (4 or 6 cm) on estimated herbage DM intake (DMI), bite mass, intake rate and ruminating behaviour during a 48-h allocation
s.e.m., standard error of the mean for PGHM × PGSH.
1 DMI during the grazing behaviour measurement period only.
2 Pre-hension time only includes eat down time on the RumiWatch system.
3 Eating time includes eat up + eat down time on the RumiWatch system.
4 Intake rate is calculated as (DMI × 1000)/pre-hension time.
a,b,c means within a row with different superscripts differ (P < 0.05).
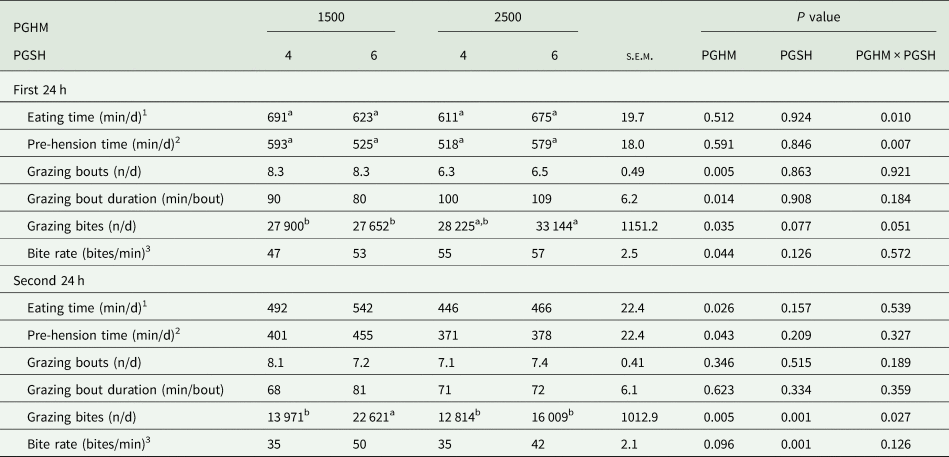
During the first 24 h of the 48 h allocation, there was a PGHM × PGSH interaction for grazing bites/day (P = 0.051), whereby 1500-6 was lower than 2500-6, but 1500-4 and 2500-4 did not differ (Table 5). During the first 24 h, compared to PGHM-1500, PGHM-2500 had a lower number of grazing bouts per day (P = 0.005), longer grazing bout duration (P = 0.014) and a greater bite rate (P = 0.044) (Table 5). Grazing behaviour parameters did not differ (P > 0.05) between PGSH treatments during the first 24 h.
Table 5. Effect of pre-grazing herbage mass (1500 or 2500 kg dry matter (DM)/ha) and post-grazing sward height (4 or 6 cm) on grazing behaviour during the first and second 24 h of a 48 h allocation
s.e.m., standard error of the mean for PGHM × PGSH.
1 Eating time includes eat up + eat down time on the RumiWatch system.
2 Pre-hension time only includes eat down time on the RumiWatch system.
3 Bite rate is calculated as (number of grazing bites/pre-hension time) (not eating time).
a,b,c means within a row with different superscripts differ (P < 0.05).
During the second 24 h there was a PGHM × PGSH interaction for grazing bites/day (P = 0.027), whereby 1500-6 was greater than 1500-4, but 2500-4 and 2500-6 did not differ. PGHM-2500 had a lower (P = 0.026) eating time and tended to have a lower bite rate (P = 0.096) than PGHM-1500. Eating time and grazing bouts did not differ between PGSH treatments; however, PGSH-6 had a greater bite rate than PGSH-4 (P < 0.001). Grazing behaviour data derived from the RumiWatch harnesses averaged over the 48 h measurement period are reported in Supplementary Table 2.
Steer intake, growth and carcass characteristics
There were no PGHM × PGSH or PGSH × finishing diet interactions (P > 0.05) for steer intake, growth or live-weight (Table 6). There were PGHM × PGSH × finishing diet interactions for DMI expressed per unit of live-weight (P = 0.048), ADG (P = 0.013) and carcass weight (P = 0.034); however, these interactions were deemed not to be biologically (practically) important (see footnote in Table 6).
Table 6. Effect of pre-grazing herbage mass (PGHM – 1500 or 2500 kg dry matter (DM)/ha), post-grazing sward height (PGSH – 4 or 6 cm) and finishing diet (diet – grass silage only (SO) or grass silage supplemented with 3.75 kg concentrate DM (SC)) on dry matter intake (DMI), average daily gain (ADG), live-weight and carcass traits of suckler-bred steers during the first winter, grazing season and finishing period

s.e.m. Grazing, standard error of the mean for PGHM × PGSH.
s.e.m. Diet, standard error of the mean for finishing diet.
a PGHM × PGSH × diet interaction.
b PGHM × PGSH × diet interaction: values of 14.2 v. 16.3, 13.3 v. 15.8, 14.2 v. 16.5, 14.3 v. 15.9 for SO v. SC, for 1500-4, 1500-6, 2500-4, 2500-6, respectively.
c FCR = feed conversion ratio (kg DM/kg ADG).
d PGHM × diet interaction (P = 0.050): values of 15.4 v. 11.9 and 10.2 v. 9.2 for PGHM-1500 v. PGHM-2500 in SO and SC, respectively.
e PGHM × PGSH × diet interaction: values of 0.65 v. 1.01, 0.54 v. 1.00, 0.65 v. 1.22, 0.79 v. 1.01 for SO v. SC, for 1500-4, 1500-6, 2500-4, 2500-6, respectively.
f Live-weight recorded indoors on a silage-only diet.
g PGHM × PGSH × diet interaction: values of 347 v. 386, 363 v. 411, 342 v. 393, 369 v. 400 for SO v. SC, for 1500-4, 1500-6, 2500-4, 2500-6, respectively.
Grazed herbage DMI did not differ between PGHM but was higher (P < 0.001) for PGSH-6 than PGSH-4. There was a quadratic response in live-weight gain during the grazing season for all treatments (Fig. 2). Mid-way through the grazing season (day 119; 18 July) live-weight did not differ (503 kg, Fig. 2(a)) between PGHM treatments, but at the end of the grazing season, PGHM-2500 were 16 kg lighter (P = 0.006) than PGHM-1500. For PGSH, mid-way through the grazing season, PGSH-4 were 19 kg lighter (P = 0.049) than PGSH-6 (494 v. 513 kg, Fig. 2(b)), and this difference increased to 34 kg by the end of the grazing season.

Figure 2. Effect of (a) pre-grazing herbage mass (1500 kg DM/ha ![]() and 2500 kg DM/ha
and 2500 kg DM/ha ![]() ), and (b) post-grazing sward height (4 cm
), and (b) post-grazing sward height (4 cm ![]() and 6 cm ―) on steer live-weight gain over the grazing season. Respective regression lines were (a) pre-grazing herbage mass (1500 kg DM/ha: y = −0.0019x 2 + 1.0892x + 394.73; R 2 = 0.9962, and 2500 kg DM/ha: y = −0.0027x 2 + 1.2149x + 390.76; R 2 = 0.9934), and (b) post-grazing sward height (4 cm: y = −0.0022x 2 + 1.0514x + 393.08; R 2 = 0.9934, and 6 cm: y = −0.0025x 2 + 1.2681x + 392.49; R 2 = 0.996).
and 6 cm ―) on steer live-weight gain over the grazing season. Respective regression lines were (a) pre-grazing herbage mass (1500 kg DM/ha: y = −0.0019x 2 + 1.0892x + 394.73; R 2 = 0.9962, and 2500 kg DM/ha: y = −0.0027x 2 + 1.2149x + 390.76; R 2 = 0.9934), and (b) post-grazing sward height (4 cm: y = −0.0022x 2 + 1.0514x + 393.08; R 2 = 0.9934, and 6 cm: y = −0.0025x 2 + 1.2681x + 392.49; R 2 = 0.996).
During the finishing period, DMI did not differ within PGHM and PGSH treatments. Finishing period ADG was greater (P = 0.036) for PGHM-2500 than PGHM-1500, but did not differ between PGSH treatments. There was a PGHM × finishing diet interaction for feed conversion ratio (P = 0.050), whereby PGHM did not differ on SC, but PGHM-2500 was lower (P = 0.045) than PGHM-1500 on SO. Overall, ADG from the first winter to slaughter, pre-slaughter live-weight and carcass weight did not differ between PGHM treatments but were greater (P = 0.029) for PGSH-6 than PGHS-4. Carcass conformation and fat score did not differ between grazing treatments.
Within finishing diet, SC had a greater DMI, ADG, pre-slaughter live-weight, carcass weight, carcass fat score (P < 0.001), carcass conformation score (P = 0.005) and kill-out proportion (P = 0.022) compared to SO.
There were no PGHM × PGSH × finishing diet interactions (P > 0.05) for ultrasonic measurements of body composition. There was no difference (P > 0.05) in ultrasonic fat and muscle depth measurements between PGHM treatments at the end of the grazing season or pre-slaughter, whereas, PGSH-6 had a greater rib fat depth (2.66 v. 2.34 mm; P = 0.049), lumbar fat depth (2.17 v. 2.03 mm; P = 0.069) and muscle depth (61.95 v. 58.70 mm; P = 0.010) at the end of the grazing season but not at slaughter, compared to PGSH-4. SC had greater pre-slaughter ultrasonic measures of fat (4.85 v. 3.67 mm; P = 0.028) and muscle depth (71.58 v. 67.69 mm; P < 0.001) compared to SO.
Herbage accumulation on the grazing area and cutting plots
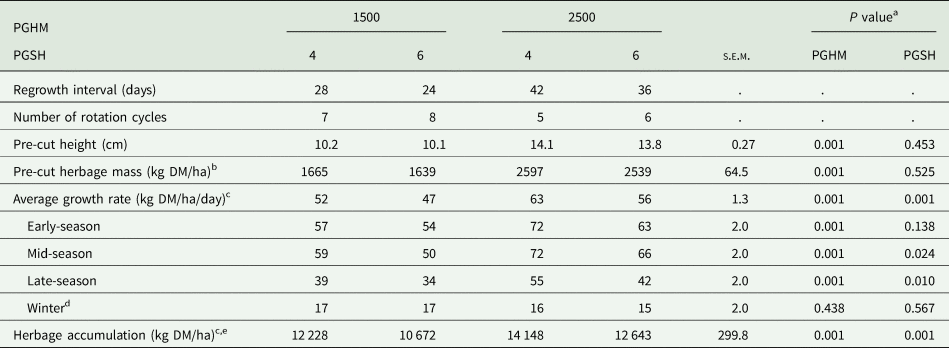
There was no PGHM × PGSH interaction (P > 0.05) for regrowth interval, herbage growth and herbage accumulation on the grazing and silage area (Table 7) or cutting plots (Table 8). On the grazing area and cutting plots, regrowth interval, grazing rotation cycle length, average growth rate and herbage production (kg DM/ha) were greater for PGHM-2500 than PGHM-1500 (P < 0.001) and for PGSH-4 than PGSH-6 (P < 0.05). Herbage production differences within PGHM and PGSH treatments were proportionately greater on the cutting plots (0.17 and 0.12, respectively) than the grazing area (0.08 and 0.05, respectively).
Table 7. Effect of pre-grazing herbage mass (PGHM – 1500 or 2500 kg dry matter (DM)/ha) and post-grazing sward height (PGSH – 4 or 6 cm) on grazing rotations and herbage growth rate on the grazing area and herbage accumulation on the grazing and silage area

s.e.m., standard error of the mean for PGHM × PGSH.
a There were no PGHM × PGSH interactions.
b Measured from 4 cm only. The measured herbage mass between 4 and 6 cm grazing horizon is 495 kg DM/ha.
c The pasture supply remaining in the pasture at the end of the year.
Table 8. Effect of pre-grazing herbage mass (PGHM – 1500 or 2500 kg dry matter (DM)/ha) and post-grazing sward height (PGSH – 4 or 6 cm) on regrowth interval, herbage growth rate and herbage accumulation on the cutting plots
s.e.m., standard error of the mean for PGHM × PGSH.
a There were no PGHM × PGSH interactions.
b Estimated via plate meter from 4 cm only.
c Measured from the height of the assigned PGSH (4 or 6 cm).
d Growth rate from 13/11/2019 to 17/04/2020.
e Accumulation over the grazing season only, did not include herbage accumulation over the winter.
On the grazing area, the quantity of herbage consumed/ha through grazing did not differ within PGHM and PGSH treatments, but more herbage was consumed for PGSH-6 than PGSH-4 on the silage area (P < 0.001). The quantity of excess herbage removed/ha as silage did not differ between PGHM treatments but was lower for PGSH-6 than PGSH-4 on the grazing (P = 0.017) and silage (P < 0.001) area. Overall, across the grazing and silage area, closing farmlet pasture supply was greater for PGHM-2500 than PGHM-1500 and for PGSH-4 than PGSH-6.
Systems output/ha
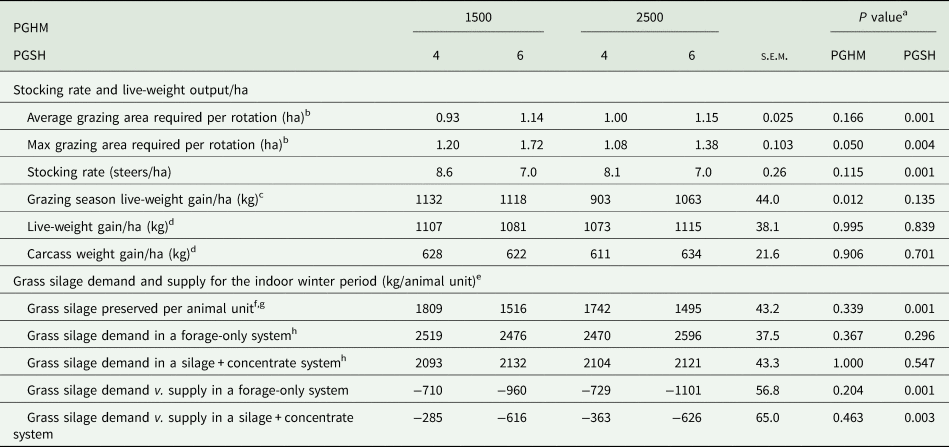
There was no PGHM × PGSH interaction (P > 0.05) for stocking rate, live-weight output/ha or for grass silage demand and supplied for the indoor winter period (Table 9). PGHM had no effect on the average grazing area required per rotation, stocking rate or overall grass silage demand and supplied for the indoor winter period per animal unit. However, the maximum area required per rotation (during September) was lower (P = 0.050) for PGHM-2500 than PGHM-1500. Live-weight gain/ha at pasture was lower (P = 0.012) for PGHM-2500 than PGHM-1500, but live-weight gain/ha and carcass weight gain/ha from weaning-to-slaughter did not differ between PGHM.
Table 9. Effect of pre-grazing herbage mass (PGHM – 1500 or 2500 kg dry matter (DM)/ha) and post-grazing sward height (PGSH – 4 or 6 cm) on stocking rate and live-weight output/ha at pasture, and grass silage demand and supply for the indoor winter period
s.e.m., standard error of the mean for PGHM × PGSH.
a There were no PGHM × PGSH interactions.
b Includes area grazed on both the assigned grazing and silage area.
c Live-weight gained at pasture over the average grazing area required per rotation.
d Group live-weight or carcass gain from the start of the first winter to pre-slaughter over the average grazing area required per rotation + the assigned silage area.
e Animal unit is considered to include both a weanling steer (ca. 350 kg, 10 months of age) and finishing steer (ca. 650 kg, 22 months of age) during the indoor winter period.
f Inlcudes silage removed from both the grazing and silage area.
g Measured from 4 cm only.
h Total silage consumed during first winter and indoor finishing period and corrected for ensilage and feed out loss.
Compared to PGSH-4, PGSH-6 had a greater (P < 0.001) average and maximum grazing area required per rotation, and subsequently had a lower (P < 0.001) grazing stocking rate or amount of grass silage preserved per animal unit and consequently, a greater (P = 0.003) grass silage deficit (supply v. demand) for the indoor winter period. PGSH had no effect on live-weight gain/ha at pasture and live-weight gain/ha and carcass weight gain/ha from weaning-to-slaughter.
Discussion
Grass-based beef systems aim to maximize animal performance from cheaper grazed pasture and reduce the reliance on more expensive feedstuffs (Finneran and Crosson, Reference Finneran and Crosson2013; Taylor et al., Reference Taylor, Crosson, Kelly and McGee2018). Grazing management practices, including PGHM and PGSH, can be major determinants of the growth, nutritive value and DMI of grazed herbage, which are key contributing factors to performance of livestock grazing pasture (Frame and Laidlaw, Reference Frame and Laidlaw2011; Donaghy et al., Reference Donaghy, Bryant, Cranston, Egan, Griffiths, Kay, Pembleton and Tozer2021). Recent studies have separately evaluated the effects of PGHM (Doyle et al., Reference Doyle, McGee, Moloney, Kelly and O'Riordan2022) and PGSH (Doyle et al., Reference Doyle, McGee, Moloney, Kelly and O'Riordan2021) on herbage and animal production within a suckler steer weanling-to-beef system. The overall objective of this experiment was to obtain a greater understanding of the interactive effects of PGHM and PGSH on sward structure, nutritive value and herbage production, the plant–animal interface, consequential steer live-weight gain at pasture, the residual impact on subsequent animal performance during the indoor finishing period and overall animal production output per hectare. True grazing group and farmlet replication was maintained throughout the experiment and represents a relatively novel design in grazing system experiments.
Effect of post-grazing sward height on steer performance
The ‘recommended’ PGSH guideline of ca. 4 cm, currently used for lactating dairy cows (Ganche et al., Reference Ganche, Delaby, O'Donovan, Boland, Galvin and Kennedy2013; Chapman et al., Reference Chapman, McCarthy and Wims2014; Donaghy et al., Reference Donaghy, Bryant, Cranston, Egan, Griffiths, Kay, Pembleton and Tozer2021), is unsuitable for growing cattle grazing pasture as it restricted animal growth at pasture by 0.16 kg/day, compared to a PGSH of 6 cm. The resulting 34 kg live-weight difference in favour of PGSH-6 at the end of the grazing season, is of similar magnitude to previous studies grazing beef cattle for a ~200-day grazing season, with similar PGSH differences (21 kg, Doyle et al., Reference Doyle, McGee, Moloney, Kelly and O'Riordan2021; 27 kg, O'Riordan et al., Reference O'Riordan, Keane and McGee2011b; 33 kg, O'Riordan et al., Reference O'Riordan, McNamee, Keane, Buckley and McGee2011c). Correspondingly, greater milk solids production was found in dairy cows grazing high (4.2–8.7 cm) compared to low (2.7–4.9 cm) PGSH in studies in Ireland (Mayne et al., Reference Mayne, Newberry, Woodcock and Wilkins1987; Ganche et al., Reference Ganche, Delaby, O'Donovan, Boland, Galvin and Kennedy2013) and New Zealand (MacDonald et al., Reference MacDonald, Penno, Lancaster and Roche2008).
The greater live-weight gain for PGSH-6 than PGSH-4 can be largely attributed to the consistently higher DMI across the grazing season, as nutrient concentration did not differ within grazing horizon layers between PGSH treatments. Consequently, differences in live-weight between PGSH treatments continued to diverge as the grazing season progressed. Similarly, previous studies have shown that a higher PGSH is associated with a higher DMI in beef (Difante et al., Reference Difante, Euclides, do Nascimento, da Silva, Barbosa and Torres2010; Euclides et al., Reference Euclides, da Conceição Lopes, do Nascimento Junior, da Silva, dos Santos Difante and Barbosa2016; Doyle et al., Reference Doyle, McGee, Moloney, Kelly and O'Riordan2021) and dairy cattle (MacDonald et al., Reference MacDonald, Penno, Lancaster and Roche2008; Ganche et al., Reference Ganche, Delaby, O'Donovan, Boland, Galvin and Kennedy2013; McCarthy et al., Reference McCarthy, Pierce, Delaby, Brennan, Fleming and Horan2013). The lower DMI for PGSH-4 is mainly accredited to the lower bite mass and intake rate compared to PGSH-6. Both of these parameters decrease linearly with sward depletion height (Chacon and Stobbs, Reference Chacon and Stobbs1976; Barrett et al., Reference Barrett, Laidlaw, Mayne and Christie2001) due to a lower bite depth (Carvalho, Reference Carvalho2013). This DMI ‘restriction’ was more evident during the second 24 h of the 48 h allocation, whereby PGSH-4 had a lower bite rate and fewer grazing bites, implying little desire to select out small quantities of herbage (Chacon and Stobbs, Reference Chacon and Stobbs1976). Under the circumstances of this rotational stocking experiment, steer grazing behaviour at the end (PGSH) rather than the beginning (PGHM) of the graze-down process had a larger impact on steer DMI. It should be noted that although herbage utilization was greater for PGSH-4 than PGSH-6, herbage utilization was measured from 4 cm for all treatments.
The absence of an effect of PGSH on in vitro digestibility measured above the grazing horizon agrees with previous studies (2.7 v. 4.2 cm PGSH, Ganche et al., Reference Ganche, Delaby, O'Donovan, Boland, Galvin and Kennedy2013; 2.7 v. 4.8 cm PGSH, Ganche et al., Reference Ganche, O'Donovan, Delaby, Boland and Kennedy2015; 4.0 v. 6.0 cm PGSH, Doyle et al., Reference Doyle, McGee, Moloney, Kelly and O'Riordan2021). The PGSH × layer interaction for ADF concentration, whereby concentration was greater for PGSH-6 than PGSH-4 below, but not above, the grazing horizon, suggests that fresh herbage regrows from the defoliation point. This implies that animals were grazing only ‘fresh’ herbage regrowth that had gathered since the previous grazing cycle and thus were not consuming the older, lower nutritive value herbage accumulated below the grazing horizon (Ganche et al., Reference Ganche, O'Donovan, Delaby, Boland and Kennedy2015). In practical terms, this means a PGSH between 4 and 6 cm does not negatively impact the nutrient value of consumed herbage; however, it is acknowledged that a compressed PGSH greater than 7 cm can reduce herbage digestibility (Donaghy et al., Reference Donaghy, Bryant, Cranston, Egan, Griffiths, Kay, Pembleton and Tozer2021). It should be noted that mechanical ‘topping’ did not occur during in the current study.
If animals were slaughtered at the end of the grazing season, theoretically PGSH-6 would have a ca. 22 kg heavier carcass than PGSH-4. This growth superiority would be beneficial to heifer production systems where slaughter at ca. 19 months of age prior to the second winter is more common (Teagasc, 2020a), or where producers sell live animals at the end of the grazing season. However following housing, the differences in animal live-weight in favour of PGSH-6 at the end of the grazing season were retained throughout the indoor finishing period and the resulting 19 kg heavier carcass is consistent with the 11 kg difference in carcass weight for PGSH-6 compared to PGSH-4 reported by Doyle et al. (Reference Doyle, McGee, Moloney, Kelly and O'Riordan2021). It is surprising that compensatory growth did not occur for PGSH-4 during the indoor finishing period, as evident in other studies where beef cattle were more ‘restricted’ at pasture (O'Riordan et al., Reference O'Riordan, Crosson and McGee2011a). If steers were drafted for slaughter based on slaughter weight (rather than at the same time point), it is estimated that PGSH-4 steers would require an additional 58 and 24 days on SO on SC, respectively, to obtain the same carcass weight as PGSH-6 steers, which is in accord with Doyle et al. (Reference Doyle, McGee, Moloney, Kelly and O'Riordan2021). Reducing slaughter age of cattle and concentrate input can substantially lower greenhouse gas emissions and winter feed costs, respectively, in beef production systems (Finneran and Crosson, Reference Finneran and Crosson2013; Taylor et al., Reference Taylor, McGee, Kelly and Crosson2020).
Effect of pre-grazing herbage mass on steer performance
The current study showed that compared to PGHM-2500, PGHM-1500 improved steer performance at pasture resulting in a 16 kg heavier animal at housing, but the superior growth was only manifested in the second half of the grazing season. Similarly with dairy cows, Tuñon et al. (Reference Tuñon, Lopez-Villalobos, Kemp, Kennedy, Hennessy and O'Donovan2011) compared a PGHM of 1500 and 2300 kg DM/ha and reported no difference between treatments in the first half of the grazing season but increased daily milk solids in the second half of the grazing season for the lower PGHM. In contrast, other studies have reported that a higher PGHM increased (1500 v. 2000 kg DM/ha, Doyle et al., Reference Doyle, McGee, Moloney, Kelly and O'Riordan2022) or had no effect (2000 v. 3500 kg DM/ha, Humphreys et al., Reference Humphreys, O'Riordan and O'Kiely2001) on steer ADG, or no effect on individual dairy cow milk production as determined in recent experimental (1400 v. 2000 kg DM/ha, Wims et al., Reference Wims, Delaby, Boland and O'Donovan2014) studies and in the meta-analysis reviewed by Pérez-Prieto and Delagarde (Reference Pérez-Prieto and Delagarde2012). This discrepancy in animal performance may be attributed to the relatively small differences found in herbage OMD between PGHM in these studies compared to the current experiment. Avoiding excessively high PGHM (> ca. 2000 kg DM/ha) particularly during and after the reproductive plant growth phase (McEvoy et al., Reference McEvoy, O'Donovan, Kennedy, Murphy, Delaby and Boland2009; Wims et al., Reference Wims, Delaby, Boland and O'Donovan2014; Doyle et al., Reference Doyle, McGee, Moloney, Kelly and O'Riordan2022) can reduce the differences in herbage OMD, and thus differences in animal performance, between PGHM treatments.
The lower nutritive value (OMD) of the herbage for PGHM-2500 than PGHM-1500, and particularly for 2500-4 v. 1500-4, in the second half of the grazing season, was due to greater stem elongation in the summer, onset of senescence in the autumn (Holmes, Reference Holmes1989) and the absence of mechanical ‘topping’ (McDonald, Reference McDonald1986). It could be postulated that if mechanical topping had occurred, the herbage nutritive differences may well be reduced. The significantly lower CP concentration for PGHM-2500 compared to PGHM-1500, coupled with the similar DMI between PGHM, implies lower nitrogen excretion for PGHM-2500 (Owens et al., Reference Owens, McGee and Boland2008; O'Connor et al., Reference O'Connor, Moloney, O'Kiely, Boland and McGee2019), which is important in terms of reducing nitrogen loss in beef production systems.
Although, daily DMI did not differ between PGHM treatments due to the similar bite mass and bite rate, it is noteworthy that PGHM-2500, and particularly 2500-6, had a greater DMI during the first 24 h (indicated by greater grazing bites, bite rate and grazing bout duration) which is consistent with previous observations (Piña et al., Reference Piña, Balocchi, Keim, Pulido and Rosas2020), and a lower DMI in the second 24 h (indicated by a lower grazing time, number of grazing bites and bite rate) compared to PGHM-1500. The lower DMI for PGHM-2500 in the second 24 h can be due to the greater bite force required due to the greater ADF concentration in the lower layers of the grazing horizon (Tharmaraj et al., Reference Tharmaraj, Wales, Chapman and Egan2003) and reduced bite rate as steers try to avoid stem and select leaves (Amaral et al., Reference Amaral, Mezzalira, Bremm, Da Trindade, Gibb, Suñe and de F. Carvalho2013). As a higher PGHM is accompanied by a higher stem mass, particularly in lower layers of the grazing horizon (Griffiths et al., Reference Griffiths, Hodgson and Arnold2003); as indicated by the higher ADF concentration in these layers.
If animals were slaughtered at the end of the grazing season hypothetically PGHM-1500 would have a ca. 10 kg heavier carcass, which would be practically significant for production systems selling animals at the end of the grazing season as outlined earlier. However, after the indoor finishing period, the live-weight gain advantage for the lower PGHM was dissipated on both the SO and SC diet, due to compensatory growth (Hornick et al., Reference Hornick, Van Eenaeme, Gérard, Dufrasne and Istasse2000; O'Riordan et al., Reference O'Riordan, Crosson and McGee2011a). This implies that a greater range of PGHM levels (1500–2500 kg DM/ha) can be implied without interfering with animal performance in the circumstances of a suckler weanling-to-beef production system that incorporates a final indoor finishing period.
Effect of finishing diet on steer performance
Despite the lower carcass weight and fat score of SO, 83% of steers in this forage-only system achieved a commercially acceptable carcass fat score of 6.0 or greater. The carcass weight (355 kg) and fat score (6.9) achieved by forage-only steers were higher than Regan et al. (Reference Regan, McGee, Moloney, Kelly and O'Riordan2018) (319 kg carcass; 6.1 fat score) and Doyle et al. (Reference Doyle, McGee, Moloney, Kelly and O'Riordan2022) (332 kg carcass; 5.78 fat score), but similar to Doyle et al. (Reference Doyle, McGee, Moloney, Kelly and O'Riordan2021) (353 kg carcass; 6.8 fat score). It is noteworthy to consider that these forage-only systems require a target live-weight of ca. >535 kg at the end of the grazing season and highly digestible grass silage (>750 g/kg DMD) offered during the indoor finishing period (Doyle et al., Reference Doyle, McGee, Moloney, Kelly and O'Riordan2021) to increase the chances of achieving a commercially acceptable carcass fat score by 24 months of age. As expected, concentrate supplementation in the finishing period significantly increased carcass weight and fatness (Regan et al., Reference Regan, McGee, Moloney, Kelly and O'Riordan2018; Doyle et al., Reference Doyle, McGee, Moloney, Kelly and O'Riordan2021, Reference Doyle, McGee, Moloney, Kelly and O'Riordan2022); consequently, all of SC animals were adequately ‘finished’.
Herbage production and output/ha
In grass-based systems, herbage production on the farm has a positive impact on key profit drivers such as stocking rate and live-weight gain/ha (Clarke et al., Reference Clarke, Brennan and Crosson2013). Consistent with other studies (Binnie and Chestnutt, Reference Binnie and Chestnutt1991; Binnie et al., Reference Binnie, Kilpatrick and Chestnutt1997; O'Riordan, Reference O'Riordan1997; Tuñon, Reference Tuñon2013; Wims et al., Reference Wims, Delaby, Boland and O'Donovan2014) regrowth interval was longer for PGHM-2500 than PGHM-1500, which proportionately increased herbage accumulation by 0.08 (+881 kg DM/ha) and 0.17 (+1946 kg DM/ha) on the grazing area and cutting plots, respectively, and could potentially reduce the requirement for fertilizer nitrogen inputs (O'Riordan, Reference O'Riordan1997). It is hypothesized that the lower herbage production differences on the grazing plots than cutting plots could be attributed to the longer residency time for PGHM-2500 on the grazing area, which can negatively influence herbage production (Fulkerson and Donaghy, Reference Fulkerson and Donaghy2001).
The greater herbage production for PGHM-2500 mainly resulted in a greater closing cover at the end of the year, which can lengthen the grazing season in the autumn (Hennessy and Kennedy, Reference Hennessy and Kennedy2009) or increase grass availability in spring (Claffey et al., Reference Claffey, Delaby, Boland and Egan2020). However, this excess herbage production for PGHM-2500 did not affect average grazing area used per rotation and consequently stocking rate (Doyle et al., Reference Doyle, McGee, Moloney, Kelly and O'Riordan2022) or silage preserved per animal unit (Humphreys et al., Reference Humphreys, O'Riordan and O'Kiely2001; Wims et al., Reference Wims, Delaby, Boland and O'Donovan2014; Doyle et al., Reference Doyle, McGee, Moloney, Kelly and O'Riordan2022). Although pasture live-weight gain/ha was higher for PGHM-1500, carcass gain and live-weight gain/ha from weaning to slaughter was similar, due to the compensatory growth that occurred during the indoor finishing period for PGHM-2500. In contrast, increasing PGHM from 1500 to 2000 kg DM/ha increased live-weight gain/ha (+5%) (Doyle et al., Reference Doyle, McGee, Moloney, Kelly and O'Riordan2022) and milk solids yield/ha (+8%) (Wims et al., Reference Wims, Delaby, Boland and O'Donovan2014), in other studies.
Previous research has reported that post-grazing residuals varying from 4 to 8 cm have relatively little effect on pasture yield (Lee et al., Reference Lee, Donaghy and Roche2008). Similarly, in the current study, the greater annual herbage accumulation for PGSH-4 compared to PGSH-6 was relatively small at 526 kg DM/ha which is consistent with previous studies (3 v. 6 cm, Frame and Hunt, Reference Frame and Hunt1971; 4 v. 6 cm, Doyle et al., Reference Doyle, McGee, Moloney, Kelly and O'Riordan2021). Although not significant, Tuñon et al. (Reference Tuñon, Kennedy, Horan, Hennessy, Lopez-Villalobos, Kemp, Brennan and O'Donovan2014) also reported a 463 kg DM/ha greater herbage accumulation for a PGSH of 4.2 cm compared to 4.9 cm. Nonetheless, the superior herbage growth for PGSH-4 can be attributed to a number of factors including, a lower quantity of old leaf material left behind after grazing (Chapman et al., Reference Chapman, McCarthy and Wims2014), increased herbage density (Frame and Hunt, Reference Frame and Hunt1971; Chapman et al., Reference Chapman, McCarthy and Wims2014) and a longer regrowth interval (Ferraro and Oesterheld, Reference Ferraro and Oesterheld2002).
The greater herbage supply (herbage production) and lower herbage demand (DMI per steer and area grazed per day) in favour of PGSH-4, consequently decreased the grazing area required per rotation which is consistent with the literature (Ganche et al., Reference Ganche, O'Donovan, Delaby, Boland and Kennedy2015; Costa et al., Reference Costa, Difante, Costa, Gurgel, Ferreira and Santos2021; Doyle et al., Reference Doyle, McGee, Moloney, Kelly and O'Riordan2021). This lower grazing area required can either increase the sum of excess herbage removed as silage or increase the grazing stocking rate. PGSH-4 conserved 270 kg DM (proportionately 0.07) more silage per animal unit than PGSH-6, resulting in 16 days more feeding per animal unit during the indoor period (assuming a combined daily demand of 16.6 kg DM for both a weanling and finishing steer when assuming an edible silage recovery of 0.78 (field to fed losses) (Keating and O'Kiely, Reference Keating and O'Kiely2000). In the SO system, the extra 16 days of grass silage supply for PGSH-4 could result in a 5.8 kg heavier carcass weight. This greater silage supply is consistent with some (Minchin and McGee, Reference Minchin and McGee2010; Doyle et al., Reference Doyle, McGee, Moloney, Kelly and O'Riordan2021) but not all (Ganche et al., Reference Ganche, Delaby, O'Donovan, Boland, Galvin and Kennedy2013, Reference Ganche, O'Donovan, Delaby, Boland and Kennedy2015) studies. Ganche et al. (Reference Ganche, Delaby, O'Donovan, Boland, Galvin and Kennedy2013) (2.7 v. 4.2 cm) and Ganche et al. (Reference Ganche, O'Donovan, Delaby, Boland and Kennedy2015) (2.7 v. 4.8 cm) found PGSH to have no effect on cumulative silage yield as they compared severe PGSH (ca. 4 cm or lower) and as a result reported the higher PGSH (ca. 4 cm) to produce more herbage.
The 14% higher stocking rate on the grazing area (not the whole farmlet) for PGSH-4 than PGSH-6 is consistent with the literature (Mayne et al., Reference Mayne, Newberry, Woodcock and Wilkins1987; Ganche et al., Reference Ganche, O'Donovan, Delaby, Boland and Kennedy2015; Costa et al., Reference Costa, Difante, Costa, Gurgel, Ferreira and Santos2021; Doyle et al., Reference Doyle, McGee, Moloney, Kelly and O'Riordan2021). Nonetheless, live-weight gain/ha at pasture or carcass gain/ha from weaning to slaughter did not differ between PGSH treatments, which is similar to Doyle et al. (Reference Doyle, McGee, Moloney, Kelly and O'Riordan2021). The closing cover was greater for PGSH-4 than PGSH-6 (combined across the grazing and silage area), which offers the same benefits for those described above for PGHM-2500 (lengthen the grazing season).
Lastly, it is important to consider the effect that finishing diet had on overall grass silage demand from the grazing system. The grass silage deficit was greater on the SO than SC system, due to a higher daily demand for grass silage on SO. Consequently, where a forage-only grazing system is being implemented, extra land (or a lower stocking rate) will be required to produce extra grass silage for the winter. Therefore, producers must consider that although grazing to 6 cm is more favourable in a forage-only system to increase steer performance at pasture, there is increased risk of a forage deficit over the winter due to less area available for silage production when grazing to 6 cm (assuming fixed animal numbers and land area), coupled with the higher demand for silage consumption in a forage-only system.
Practical implications
Although the PGSH-4 grazing system increased stocking rate or grass silage supply than PGSH-6, the inferior individual animal performance means greater concentrate supplementation would be required during the subsequent indoor finishing winter to achieve a similar carcass weight as PGSH-6, which would result in greater feed costs per animal (Finneran and Crosson, Reference Finneran and Crosson2013). Considering most commercial beef production systems do not have excessively high stocking rates (Teagasc, 2020a), on the basis of this and other studies (Doyle et al., Reference Doyle, McGee, Moloney, Kelly and O'Riordan2021) it is recommended therefore to graze to a PGSH of 6.0 cm to increase individual steer performance at pasture (cheapest feed resource) and reduce reliance on concentrates. Although the quantity of grass silage produced for winter feeding was lower for PGSH-6 compared to PGSH-4, the former requires a shorter indoor feeding period due to the heavier live-weight at the end of the grazing season, and thus, a lower quantity of grass silage to achieve a target carcass weight.
Conclusion
In the context of a late-maturing breed, weanling-to-beef suckler steer system, it has been shown that, at the individual animal level, grazing ‘tightly’ (PGSH-4 v. PGSH-6), and grazing a high pasture mass (PGHM-2500 v. PGHM-1500), in a rotationally stocked system has a negative impact on animal live-weight gain at pasture. The negative effect of ‘tight’ grazing, but not PGHM, was still evident at the end of an indoor finishing period in terms of a lighter carcass. Nevertheless, overall carcass output/ha was similar between treatments due to compensatory growth during the indoor finishing period for PGHM-2500 compared to PGHM-1500, and due to a greater grazing area required for PGSH-6 compared to PGSH-4.
Due to concentrate supplementation during the indoor finishing period, all steers on SC achieved a commercially acceptable carcass fat score; whilst, the majority (83%) of SO steers achieved this target.
Supplementary material
The supplementary material for this article can be found at https://doi.org/10.1017/S0021859623000217
Data availability statement
The datasets used and analysed during the current study are unavailable.
Acknowledgements
The authors acknowledge Dennis Bonnin, Joe Munroe, M.J. Kelly and work placement students for their technical assistance and Francis Collier, Pat Whelan and Patsy Martin for their care of the experimental animals. Also thanks to the staff of Grange laboratories for feed analysis and to Dr Jim Grant for his assistance with statistical analysis. The financial support of Teagasc is gratefully acknowledged.
Author contributions
Conceptualization, P. R. D., M. M., A. P. M., A. K. K. and E. G. O.; methodology, P. R. D., M. M., A. P. M., A. K. K. and E. G. O.; formal analysis, P. R. D., M. M., A. P. M., A. K. K. and E. G. O.; investigation, P. R. D. and E. G. O.; resources, P. R. D., M. M., A. P. M., A. K. K. and E. G. O.; data curation, P. R. D. and E. G. O.; writing – original draft preparation, P. R. D.; writing – review and editing, M. M., A. P. M., A. K. K. and E. G. O.; supervision, E. G. O.; project administration, E. G. O.; funding acquisition, E. G. O. All authors have read and agreed to the published version of the manuscript.
Financial support
The work was supported by Teagasc.
Conflict of interest
None.
Ethical standards
Animal procedures performed in this experiment were approved by the Teagasc Animal Ethics Committee and were conducted in accordance with the European Communities Regulation 2002 and 2005.


 Open access