


1. Introduction
Due to technological advances and dramatic sequencing cost reduction, next-generation sequencing (NGS) has been widely used for finding causative genomic variants of genetic disorders. Many laboratories use whole-exome sequencing due to the fact that approximately 85% of all known genetic Mendelian disorders affect protein-coding regions (Gilissen et al., Reference Gilissen, Hoischen, Brunner and Veltman2012). As exomes comprise approximately only 1% of the whole genome, sequencing the exome instead of the whole genome reduces diagnosis cost and facilitates data analysis.
After acquiring sequencing data, public variant databases, which gather data on known pathogenic genome variants, are being relied upon as a source for clinical diagnosis (Lindor et al., Reference Lindor, Thibodeau and Burke2017). Too excessive reliance on databases' data, without additional verification, raises concerns with regards to misinterpretation that may harm patients. According to Bell et al. (Reference Bell, Dinwiddie, Miller, Hateley, Ganusova, Mudge, Langley, Zhang, Lee, Schilkey, Sheth, Woodward, Peckham, Schroth, Kim and Kingsmore2011), approximately 10% of disease-causing mutations depicted in widely used databases are misinterpreted and such databases should be carefully scrutinized. Nevertheless, public pathogenic variants databases are a beneficial tool for interpretation of sequencing data.
The usage of public databases may also be implemented for pathogenic variants analysis in healthy people. Such research could provide an insight into the most common recessive disorders in a particular population, hence providing possible benefits for diagnostics.
The aim of this study was to use NGS and to apply data from the ClinVar database for identification of pathogenic variants in the exomes of healthy individuals from the Lithuanian population and to determine frequency differences of pathogenic variants comparing Lithuanian population data and other population data. In order to achieve this, 96 self-reported healthy individuals' exomes were sequenced.
Analysis was also conducted on how well the currently available ClinVar database of pathogenic variants is balanced for healthy individuals' research, since the efficiency of study results is highly dependent on the accuracy of the data in the database (Landrum et al., Reference Landrum, Lee, Riley, Jang, Rubinstein, Church and Maglott2014).
2. Materials and methods
(i) Samples
This study is a part of a project called ‘Genetic diversity of the population of Lithuania and changes of its genetic structure related with evolution and common diseases' (acronym: LITGEN) (Uktverytė et al., Reference Uktverytė, Meškienė, Ambrozaitytė, Domarkienė, Pranculis, Burokienė, Coj, Mažeikienė, Kasiulevičius, Kučinskienė and Kučinskas2013).
Sequencing data of 96 self-reported healthy unrelated individuals (equal male:female ratio) from the Lithuanian population with at least three generations living in Lithuania was used for the analysis. DNA was extracted from venous blood using either the phenol-chloroform method or MagneSil® Genomic, Large Volume System (Promega Corp., USA) on TECAN Freedom EVO® (Tecan, Switzerland).
(ii) Sequencing
The 5500 SOLiD™ System (Applied Biosystems; Thermo Fisher Scientific, Inc., USA) was used to sequence the samples. Sequencing was carried out according to the manufacturer's protocols (Thermo Fisher Scientific, Inc., USA) using the SureSelectXT Target Enrichment System (Agilent Technologies, Inc., USA) or the TargetSeq™ Exome Enrichment System (Life Technologies; Thermo Fisher Scientific, Inc., USA). Using the 5500 SOLiD System, 75-bp short-read sequences were generated.
(iii) Bioinformatic analysis
The SOLiD System uses a specific ligation-based sequencing strategy and is colour-space encoded. Since previous studies have shown that proprietary software for the SOLiD System is most appropriate for the computational pipeline of data generated by the SOLiD System, LifeScope™ 2·5·1 genomic analysis software was used for mapping to reference genome and variant calling (Pranckevičienė et al., Reference Pranckevičienė, Rancelis, Pranculis and Kucinskas2015).
Analysis of sequenced data showed that rate of transitions/transversions was 2·2–2·8. These values indicate that obtained data was not generated randomly. In this study 80% of target exons were covered at more than 20X.
To achieve the overview of genomic variance in the sample group representing the Lithuanian population, the Genome Analysis Toolkit's (GATK) Combine Variants software was used to pool all 96 individuals' .vcf files (DePristo et al., Reference DePristo, Banks, Poplin, Garimella, Maguire, Hartl, Philippakis, Del Angel, Rivas, Hanna, McKenna, Fennell, Kernytsky, Sivachenko, Cibulskis, Gabriel, Altshuler and Daly2011). The Integrative Genomics Viewer (IGV) was used for visualization of data (Thorvaldsdóttir et al., Reference Thorvaldsdóttir, Robinson and Mesirov2013). Functional annotation of genomic variants was performed by using ANNOVAR and included frequencies of genomic variants from the 1000 Genomes Project (1000G) and The Exome Aggregation Consortium (ExAC) databases and frequencies of pathogenic variants from the ClinVar database (Wang et al., Reference Wang, Li and Hakonarson2010).
Filtering processes were based on the ClinVar database's overall clinical significance of genome variants. It includes both rare and common variants if they were interpreted as pathogenic.
(iv) Statistics
Pathogenic variants with distribution not following Hardy–Weinberg equilibrium, were excluded from this study.
In the comparative frequency analysis of pathogenic variants in the Lithuanian population study group and of other population data (1000G, ExAC), Fisher's exact test was used.
3. Results and discussion
Each individual exome had an average of 42 139 single-nucleotide variants (SNVs) and 2306 short INDELs (up to 19 nucleotide deletions, up to four nucleotide insertions) that differed from the reference genome (hg19). In the 96 Lithuanian exomes that were sequenced, 321 SNVs and 30 short INDELs were identified that were classified as likely pathogenic or pathogenic in the ClinVar database at least by one submitter. Thirteen of them did not following Hardy–Weinberg equilibrium, leaving 308 genome variants in total. An average of 39 SNVs per individual exome were indicated as likely pathogenic or pathogenic by the ClinVar database (Table 1).
Table 1. The total number of genomic variants from 96 exomes and an average number of them in a single exome, together with clinical significance provided by the ClinVar database.

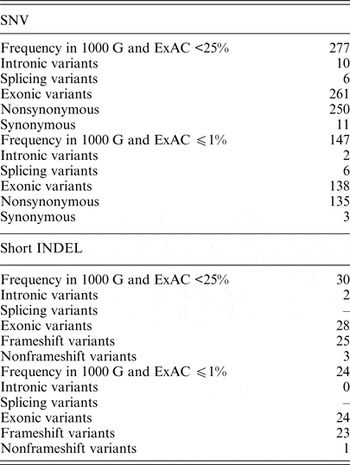
In the dataset of this study, 40 genomic variants that were indicated as likely pathogenic or pathogenic by ClinVar had 25% and higher frequencies in the 1000 G and ExAC data. Pathogenic variants with such high frequency in the global population are highly questionable, and therefore these variants were excluded from further analysis. Of all the genomic variants indicated as likely pathogenic or pathogenic, 277 genomic variants had a frequency lower than 25%, and 147 genomic variants had a frequency lower or equal to 1% in the 1000 G and ExAC data (Table 2).
Table 2. Statistics of SNVs and short INDELs considered as likely pathogenic or pathogenic in the ClinVar database in self-reported healthy Lithuanian individuals compared to other population data.
A debatable issue is that there were individuals who had homozygous genotypes for alleles identified as pathogenic by ClinVar, meaning that these individuals may have disease symptoms. Since data in this study is acquired from self-reported healthy Lithuanian individuals, a possible explanation is that the pathogenic variant causes a very subtle alteration, or that the phenotype was not determined in detail, or that the variant is incorrectly attributed as pathogenic. For some pathogenic variants, this homozygous state is seen both in our data and in the data of large-scale population studies (Lek et al., Reference Lek, Karczewski, Minikel, Samocha and Posthuma2016).
Pathogenic variants identified in Lithuanians were grouped according to medical disease classification ‘International Statistical Classification of Diseases and Related Health Problems' 10th revision (ICD-10). In the Lithuanian individuals, the most common diseases associated with the pathogenic variants studied are endocrine, nutritional and metabolic diseases (which account for 30·5% of diseases), diseases of the blood and blood-forming organs, including disorders of the immune mechanism (which account for 15·2% of diseases), and congenital malformations, congenital deformations and chromosomal abnormalities (which account for 14·3% of diseases) (Table 3).
Table 3. Classification of diseases potentially related to pathogenic variants in self-reported healthy Lithuanian individuals.

A relatively high number (7·6%) of diseases were of ophthalmic origin. Further analysis showed that several pathogenic genome variants related to ophthalmic diseases have a higher frequency in Lithuanian individuals.
For further comparative analysis, if SNVs or short INDELs in the Lithuanian individuals were assigned as pathogenic, then frequency comparison with other population data from the ExAC and 1000 G projects was performed. Comparison with ExAC data without psychiatric cohorts (from 45 376 unrelated individuals) showed that as many as 95 likely pathogenic or pathogenic variants in our study differed in a statistically significant manner from ExAC data. To acquire more Lithuanian-specific pathogenic variants, comparison with the 1000 G European data was performed for all assigned pathogenic variants (1000 Genomes Project Consortium et al., Reference Abecasis, Auton, Brooks, Depristo, Durbin, Handsaker, Kang, Marth and McVean2012).
Pathogenic variants can have a very low frequency and even in large-scale population studies can appear in small numbers. Since a small number of alleles cannot impartially represent a statistically significant difference in the present study group or other populations, the criteria of a minimum of four alleles was set for further analysis. Out of an overall 30 unique short INDELs, 25 did not pass this requirement and the frequency of the other five INDELs demonstrated no statistically significant difference from the 1000 G European data. The SNV comparison of pathogenic variant frequencies in studied individuals with frequencies of pathogenic variants from the genomic data of Europeans identified five pathogenic genomic variants that are inherited in an autosomal recessive manner and have no conflicting interpretation in the ClinVar database (Table 4).
Table 4. dbSNP database codes of pathogenic variants which have autosomal recessive inheritance and which frequencies statistically significantly differ in comparison of Lithuanian individuals' data with 1000 Genomes Project's European data.

1000G: genomic variants' frequency in 1000 Genomes Project, dbSNP: data from build 149 dbSNP database; Fisher: Fisher's exact test; LTU: genomic variants' frequency in LITGEN project.
In addition, another seven genome variants, which are inherited in an autosomal recessive manner, show a statistically significant difference; however, they have conflicting interpretation in the ClinVar database.
4. Conclusions
The study results represent statistically significant differences in frequencies of genomic variants between individuals from the Lithuanian population and other populations.
When the data of the present study was compared with all ExAC project data, a statistically significant difference was observed for 95 out of 308 likely pathogenic or pathogenic variants, but most of them correlated with the frequencies of European data. Comparison with the European data of the 1000 Genomes Project revealed five statistically significant pathogenic variants that differed from the European population data and have no conflicting interpretation in the ClinVar database.
The study showed that whole-exome sequencing and analysis of the general population is an effective way to find pathogenic variants with statistically significant differences in a particular population even if the cohort studied is relatively small. This could be valuable information for genetic counselling and may benefit clinical diagnosis by focusing on the specific variants that are more frequent in a particular population.
Based on the present study data, ClinVar is currently the best freely available database of genomic variants of different clinical significance. A considerable amount of the variants classified as pathogenic in ClinVar have a high frequency in 1000 G and ExAC. We observed a similar pattern in LITGEN data.
Another matter of concern is that there were individuals who had homozygous genotypes for alleles identified as pathogenic, thus cautious interpretation of the ClinVar data for pathogenic variants should be undertaken by researchers and medical specialists.
The research leading to these results is part of the LITGEN project (VP1-3·1-ŠMM-07-K-01-013) and was funded by the European Social Fund under the Global Grant measure.
Declaration of interest
The authors declare no conflicts of interest. The authors alone are responsible for the content and writing of this article.
Ethical approval
All procedures performed in this study involving human participants were in accordance with the ethical standards of the Vilnius Regional Research Ethics Committee (No. 158200-05-329-79. date: 2011-05-03) and with the 1964 Helsinki declaration and its later amendments.


