


Background
The economic costs associated with physical illness in households in low- and middle-income countries (LMICs) have been well documented.Reference Russell1,Reference McIntyre, Thiede, Dahlgren and Whitehead2 However, less is known about the household economic costs associated with mental, neurological and substance use (MNS) disorders, which have long been neglected in international health and development policyReference Thornicroft and Patel3,Reference Tomlinson and Lund4 but have now been included in the sustainable development goals.Reference Nations5 Research that examines the household economic costs associated with MNS disorders in LMICs can help to reveal how MNS disorders affect household economic welfare and identify who should be offered financial risk protection, with the goal of improving equity. In the case of MNS disorders, need for care and access to care are often inversely related: those with the highest need (poor, economically vulnerable, marginalised populations), tend to have the least access to care.Reference Saxena, Thornicroft, Knapp and Whiteford6 MNS disorders and poverty are related in a mutually reinforcing negative cycle, characterised by social causation and social drift pathways.Reference Dohrenwend, Levav, Shrout, Schwartz, Naveh and Link7,Reference Lund, De Silva, Plagerson, Cooper, Chisholm and Das8
Household-level data are important when examining the economic impact of MNS disorders in LMICs for a number of reasons: (a) economic shocks such as catastrophic health expenditure (defined as out-of-pocket healthcare payments that exceed a household's available economic resources) are usually measured at the household level; (b) opportunity costs (defined as lost alternative courses of action) associated with MNS disorders such as additional caregiver burden can be more accurately captured by examining households; (c) decisions about treatment seeking and coping with economic consequences of illness are often made at the household level;Reference Russell1 (d) households often experience intergenerational transmission of poverty; and (e) erosion of assets over time is often felt at the household level. There are several ways in which MNS disorders may differ from classic descriptions of the medical poverty trap:Reference Whitehead, Dahlgren and Evans9 the household economic impact of MNS disorders is likely to be felt through disability and morbidity rather than mortality; it is likely to focus on chronic recurrent economic shocks, rather than single acute shocks, as MNS disorders are likely to endure and are often episodic; there are likely to be ‘spillover’ effects at the household level whereby caring for a person with an MNS disorder in the household may affect the mental health of other household members;Reference Das, Do, Friedman, McKenzie and Scott10 MNS disorders are often difficult to detect and stigma often prevents help-seeking, further entrenching the medical poverty trap; and finally, because MNS disorders are frequently hidden and highly stigmatised, there are a range of measurement challenges that exist for the investigator, such as screening or outcome assessment in diverse cultural contexts.Reference Lund, Breen, Flisher, Kakuma, Corrigall and Joska11,12
Study aims
The aim of this study was to assess the association between MNS disorders and household education, income, consumption, production, assets and financial coping strategies in six LMICs: Ethiopia, India, Nepal, Nigeria, South Africa and Uganda. We developed a conceptual framework to guide our exploratory analysis of the data, using a variety of sourcesReference McIntyre, Thiede, Dahlgren and Whitehead2,Reference Lund, De Silva, Plagerson, Cooper, Chisholm and Das8,12,13 (see supplementary Fig. 1; available at https://doi.org/10.1192/bjo.2019.20). We hypothesised that, compared with control households, households with a person who has an MNS disorder would (a) be poorer, with less disposable income and lower levels of consumption; (b) have lower levels of wealth, including fewer assets; (c) incur greater direct and indirect healthcare costs; and (d) adopt more regressive financial coping strategies. This study is part of a broader research consortium, the European Union-funded Emerald (Emerging mental health systems in low- and middle-income countries) project.Reference Semrau, Evans-Lacko, Alem, Ayuso-Mateos, Chisholm and Gureje14
Method
Study design
We conducted an exploratory cross-sectional household survey in one district, defined as an established health administration catchment area, in each of the six countries. The surveys were conducted in households with a member who was living with one of the priority MNS disorders established by the programme (alcohol-use disorder (AUD), depression, epilepsy or psychosis) or a control household. The study adheres to the STROBE guidelines for the reporting of observational cross-sectional epidemiological studies.Reference von Elm, Altman, Egger, Pocock, Gotzsche and Vandenbroucke15
Settings
The sites in each country were the Sodo district, Ethiopia; Sehore district, Madhya Pradesh state, India; Chitwan district, Nepal; local government areas in and around the city of Ibadan, Nigeria; Dr Kenneth Kaunda district, South Africa; and Kamuli district, Uganda. The rationale for the choice of these districts as well as the district characteristics have been described in detail elsewhere.Reference Semrau, Evans-Lacko, Alem, Ayuso-Mateos, Chisholm and Gureje14,Reference Hanlon, Luitel, Kathree, Murhar, Shrivasta and Medhin16 In brief, the selection of each district was based on the priorities identified by the local Ministry of Health and the partner research institution involved in two prospective intervention studies – the Programme for Improving Mental health carE (PRIME) and STEPCARE, with which the Emerald household surveys were linked. These districts were representative of low resource settings in each country, including a diverse range of rural, semi-rural and urban settings (to maximise the generalisability of our findings), where we were able to establish partnerships for implementation with local Ministry of Health district health managers or non-governmental organisations.
Participants
From July 2014 to September 2015 we recruited people identified with AUD, depression, epilepsy or psychosis via individual-level screening and assessment of primary healthcare clinic attenders in the district sites by primary healthcare workers using the World Health Organization (WHO) mhGAP Intervention Guide.17 Exceptions were (a) the psychosis and epilepsy groups in Ethiopia, which were recruited using community ascertainment methods because of low facility attendance; and (b) the depression group in Nigeria, which was recruited through screening and a confirmatory diagnosis of major depression using the short form of the Composite International Diagnostic Interview.Reference Gureje, Oladeji, Araya and Montgomery18
Participants were recruited through separate, ethically approved studies: STEPCARE in Nigeria and PRIME in Ethiopia, India, Nepal, South Africa and Uganda.Reference Gureje, Oladeji, Araya and Montgomery18,Reference Lund, Tomlinson, De Silva, Fekadu, Shidhaye and Jordans19 The selection of specific disorder groups was made by each country team, depending on the policy and research priorities within each country, and the resulting focus of the PRIME and STEPCARE studies. After participants were recruited from clinics in the PRIME and STEPCARE studies, we then obtained participants' permission to interview them in their home for the Emerald study. The Emerald study therefore involved a separate informed consent and data-collection process, and addressed a distinct research question to the PRIME and STEPCARE studies. The inclusion and exclusion criteria and recruitment processes are summarised in Supplementary Table 1, and described in detail elsewhere.Reference Gureje, Oladeji, Araya and Montgomery18,Reference De Silva, Rathod, Hanlon, Breuer, Chisholm and Fekadu20
For a comparison group, we recruited individuals who were attending the same primary healthcare clinics for a physical health complaint, and who screened negative for an MNS disorder. This group was selected as a comparison in order to identify the net excess economic burden of MNS disorders on households. Changes in consumption and production for households affected by a health condition should be compared with those for households without the health condition if the intent is to estimate the actual (rather than imputed) losses in production ascribed to the health condition itself.12 An exception was the comparison group that was identified for the Ethiopian psychosis and epilepsy groups, for whom matched households were identified through the population census. The rationale for this exception was that these Ethiopian groups were recruited using community ascertainment methods, rather than through primary care clinics, and therefore matched households were a more appropriate comparison.
Individuals who were identified using these methods in the five groups (AUD, depression, epilepsy, psychosis and controls) were then asked if they would consent to being visited in their homes to complete a household questionnaire regarding their social and economic circumstances. If they consented, participants were visited in their homes where the head of the household was asked to provide consent to participate, and if they agreed, completed the questionnaire. The head of the household was defined as the person who is most knowledgeable about the household's health status, employment, financial condition, expenditures and/or the main decision-maker in the household. This person was identified by the household themselves. The questionnaire took approximately 1 hour to complete.
To calculate the required sample size, the differences in the proportion of households who incur catastrophic healthcare expenditures was used as the primary outcome measure. A study conducted by Patel et al (2007) to investigate, among others, the financial burden of depressive disorders in India reported that the proportions of households with catastrophic healthcare expenditures was 14.6% and 4.9% for households that have members with depression and those that do not, respectively.Reference Patel, Chisholm, Kirkwood and Mabey21 Based on these proportions, a power of 80%, and a 95% confidence interval, a two-sample comparison of proportions was conducted in order to estimate the minimum sample size required to detect whether differences exist in rates of catastrophic health expenditure. According to these calculations, the appropriate sample size for detecting differences between these proportions was determined to be 166 for each disorder and control group. Because of concerns regarding loss to follow-up in our planned longitudinal study, we recruited additional participants to reduce the impact of loss to follow-up, where we were able to.
Measures
Key variables and the instruments used to measure those variables are set out in supplementary Table 2. Screening for AUD was conducted using the 10-item Alcohol-Use Disorder Identification Test (AUDIT),Reference Babor, Higgins-Biddle, Saunders and Monteiro22 and screening for depression was conducted using the 9-item Patient's Health Questionnaire (PHQ-9).Reference Kroenke, Spitzer and Williams23 The household survey instrument was based on the previously validated WHO Study on global AGEing and adult health (SAGE) survey in six LMICs.Reference Kowal, Chatterji, Naidoo, Biritwum, Fan and Lopez Ridaura24 Details of the construction and assumptions used in each of the economic outcome measures are elaborated in the notes for Supplementary Table 2.
Analysis
Our analysis was guided by the above conceptual framework, and hypotheses presented in the Study aims. Given that this study sought to examine differences between each MNS group individually, compared with the control groups for each country, we generated dichotomous variables for each disorder group prior to conducting the analyses. We used frequency distributions and univariable descriptive statistics for preliminary analysis, to describe and compare: characteristics of the household head, index patient characteristics, household member characteristics as well as housing characteristics. Mean values were reported for all continuous variables as measures of central tendency and standard deviations. To assess differences in characteristics between the screen-positive groups, compared with the control group, P-values were calculated using independent-sample t-tests to determine significance. For categorical variables, differences in frequencies were compared using Pearson's chi-square tests.
As a result of the uneven distribution of income and consumption data, median values were reported for all economic estimates as measures of central tendency, and interquartile ranges (IQR) were reported. To assess differences in income and consumption between each MNS group and their control group, P-values were calculated as follows: differences in means were assessed using independent-sample t-tests and differences in medians were assessed using two-sample Wilcoxon rank-sum (Mann–Whitney) tests. To test whether the presence of a household member with each disorder significantly predicted changes to income- and expenditure-related outcomes, quantile regression tests were conducted and predicted median differences and confidence intervals were reported. Quantile regression was chosen (as opposed to ordinary least squares (OLS) regression) to estimate the median of the dependent variable (income, consumption) conditional on whether or not the household includes a member living with an MNS disorder (i.e. the independent variable). Both OLS and quantile regression describe central tendency of data – of which the former uses the mean, and the latter uses the median. Consequently, OLS is much more sensitive to outliers and skewed distributions. Given that the outcomes of interest were non-parametric, Stata's quantile regression function was used to predict the median which by default, conducts median regression estimation. Quantile regression is more robust to outliers and non-normal errors and allows the analyst to explore the impact of the variable of interest on the entire distribution of the outcome, not simply its mean.
Kernel density estimates were used to examine the asset scores derived through multiple correspondence analysis for the control households and for each MNS disorder group. Differences in the overall trends of asset-based wealth scores were assessed using two-sample Wilcoxon rank-sum (Mann–Whitney) tests given that the distributions were not normally distributed. Differences in the overall trends of log consumption were assessed using independent-sample t-tests.
For handling missing data, if households did not provide data on the key economic outcomes (income, assets, consumption and health expenditure), they were not included in the analyses. If the household respondent did not provide itemised income, consumption or health expenditure data, but was able to estimate the total for each category, these estimates were used. Participants who were excluded did not have any significant differences with respect to their sociodemographic characteristics when compared with those participants who were included in the final analyses. No imputation methods were used in the analysis.
Ethical considerations
The consenting process for the study involved two stages. First, participants with one of the MNS disorders or controls were invited to participate and asked to provide informed consent to participate and be visited in their homes. Capacity to consent was assessed in all sites. If consent was given, households were subsequently visited, where the head of the household was asked to provide written informed consent. All participants provided voluntary informed consent to participate in the study, except in the case of some members of the psychosis group in Ethiopia who lacked capacity to consent. For these participants, guardian permission was given instead, as long as the person with psychosis did not refuse. None of the household heads lacked capacity to consent.
India, Nepal, South Africa and Uganda used hand-held electronic data-collection devices such as smart phones or tablets, and ensured that data remain secure by (a) password-protecting access to the hand-held devices, (b) transmitting data to the server regularly, (c) password-protecting the computers that accessed the server, and (d) accessing raw data on the server via a password-protected website. Data were collected in Nigeria and Ethiopia using pen and paper questionnaires, which were kept in locked filing cabinets, and subsequently data were captured on password-protected computers. The study received ethical approval from the ethics review committees of the partner institutions in each country, as well as that of the project coordinating centre (King's College London) and WHO (RPC619).
Results
Participant characteristics
The size and characteristics of the MNS disorder and control (non-mental health) groups varied substantially across Ethiopia (n = 936), India (n = 1104), Nepal (n = 910), Nigeria (n = 316), South Africa (n = 617) and Uganda (n = 438) (supplementary Table 3). There were 16 MNS disorder groups across the six countries, which varied substantially in size from the psychosis group in South Africa (n = 21) to the depression group in South Africa (n = 300). The final sample size was derived after removal of respondents who had participated in the survey but had >80% incomplete data (i.e. only household roster was completed) (Fig. 1). Index participants with MNS disorders presented with a variety of clinical and functioning profiles. The majority of countries had a higher proportion of male than female household heads, except South Africa.

Fig. 1 Flow chart of participants in each country.
There were clear differences between households with and those without an MNS disorder in several respects (supplementary Table 4). The majority of heads of households with an MNS disorder had lower levels of education than heads of households without a member with an MNS disorder, with the exception of the AUD group in India, the depression groups in Nigeria and South Africa, and the psychosis groups in Nepal and Uganda. A greater proportion of households with an MNS disorder reported having a member with long-term care needs than households without MNS disorders, with the exception of Uganda, which reported significantly higher proportions of households with long-term care needs in the non-MNS household group (30.9%). In the pooled data (combined across countries) (Table 1), there was some heterogeneity in household sociodemographic data between disorders. For example, 48.0% of household heads with a member with psychosis and 39.1% of household heads with a member with epilepsy had no formal education, compared with 29.6% of heads of non-MNS households (P < 0.01 and P < 0.05 for psychosis and epilepsy, respectively), 31.9% of AUD household heads and 25.8% of depression household heads had no formal education.
Table 1 Sociodemographic and clinical characteristics of the households across the mental, neurological and substance use (MNS) disorder and non-MNS (control) household groups, pooled from all countries

AUD, alcohol-use disorder; AUDIT, Alcohol-Use Disorder Identification Test; PHQ-9, 9-item Patient's Health Questionnaire; WHODAS, World Health Organization Disability Assessment Schedule.
* P < 0.05 and **P < 0.01.
There was a consistently low level of financial protection (health insurance cover) in both MNS disorder and the non-MNS disorder households, across all countries, including voluntary or mandatory, and private or social insurance: between 0% of households in Uganda and 13% of households in India had health insurance. Housing standards (indicated by access to improved sanitation facilities) were higher among non-MNS disorder households, with the exception of South Africa and small samples for specific disorders. However, in pooled data, there was again heterogeneity between disorder groups; whereas psychosis and epilepsy groups had significantly less health insurance coverage (P < 0.01), worse housing floor materials (P < 0.01) and less improved water (P < 0.01) and sanitation (P < 0.01) than non-MNS households, this was not the case for depression and AUD households (Table 1).
The findings of the economic outcomes for all MNS disorder groups combined across countries (pooled) are summarised in Table 2.
Table 2 Pooled economic outcomes, comparing mental, neurological and substance use (MNS) households with non-MNS (control) households across all country sitesa

a. Analyses overview: for all financial estimates median values and interquartile ranges (IQR) are reported as measures of central tendency and overall differences in their distributions were assessed using two-sample Wilcoxon rank-sum (Mann–Whitney) tests with dichotomous disorder group variables. In some instances, crude median differences were not precisely equivalent to median differences assessed through quantile regression estimation because of rounding. Differences between each disorder group and the non-MNS (control) group were assessed using Pearson's chi-square tests. Logistic regression was used to determine the impact of having a household member with each disorder on use of coping strategies, compared with the non-MNS (control) group using dichotomous disorder variables; ORs are reported. To test whether the presence of a household member with each disorder significantly predicts changes to the number of coping strategies being employed in response to financial distress, regression tests were conducted and beta (β) coefficients are reported. The non-MNS (control) group was used as the referent group for all comparisons and tests of associations.
* P < 0.05 and **P < 0.01.
Income and consumption
In absolute terms, household income per adult equivalent household member across all sites was extremely low, ranging from US$4.90 per adult equivalent per month in the epilepsy group in Uganda to US$72.07 in the control group in Nigeria (supplementary Table 5). Total household income was consistently lower among households affected by an MNS disorder, with the exception of the small epilepsy group in Ethiopia, the depression group in India and all MNS groups in Uganda.
In terms of effective income, measured here by the level of consumption per adult equivalent household member, households affected by MNS disorders were consistently found to have lower monthly household consumption when compared with non-MNS households with the exception of the AUD and depression groups in India, the AUD and small psychosis group in Nepal, the depression group in South Africa, and the depression and small psychosis groups in Uganda.
In pooled data across countries, there was again heterogeneity between disorder groups, with epilepsy and psychosis households showing significantly lower levels of income and consumption, compared with non-MNS households (median monthly income difference: −US$18.34 (95% CI −23.44 to −13.24), −US$13.42 (95% CI −17.52 to −9.32) for epilepsy and psychosis, respectively, P < 0.01; median monthly consumption difference: −US$25.85 (95% CI −30.76 to −20.94), −US$14.46 (95% CI −18.55 to −10.37) for epilepsy and psychosis respectively, P < 0.01), a trend not evident in AUD and depression households (Table 2). Nevertheless, all MNS household groups combined showed significantly lower total income and consumption than non-MNS households (median difference: –US$3.55 (95% CI −6.22 to −0.89) and −US$3.41 (95% CI −6.02 to −0.80), respectively, P < 0.05).
Regarding household capacity to pay (effective income minus total food consumption), this was consistently lower in households with an MNS disorder compared with households without an MNS disorder, with the exception of the depression group in India, the small psychosis group in Nepal and all MNS groups in Uganda. Once subsistence needs had been met, effective income remaining to meet all other needs among households with an MNS disorder ranged from US$5.26 per adult equivalent per month in the epilepsy group in Ethiopia to US$34.77 per adult equivalent per month in the AUD group in India. In pooled data, households with a member with psychosis or epilepsy once again had less effective monthly income (median difference: −US$14.8 (95% CI −18.68 to −10.91) and −US$12.01 (95% CI −15.10 to −8.92), respectively, P < 0.01), than households with depression or AUD, when compared with non-MNS households (Table 2)
Regarding non-health consumption, there was a similar trend with most MNS disorder household groups reporting lower levels of consumption than households without an MNS disorder, although there was some heterogeneity across the countries. In Ethiopia, all MNS households had lower non-health consumption than control households; in India all MNS households had higher non-health consumption than control households with the exception of the small psychosis group; in Nepal all MNS households had lower non-health consumption than control households, with the exception of the AUD group; in Nigeria depression group households had lower non-health consumption than control households; in South Africa, depression group households had higher non-health consumption than control households whereas the small psychosis group had lower non-health consumption; in Uganda, all MNS groups had higher non-health consumption than non-MNS households, with the exception of the epilepsy group.
Asset-based wealth
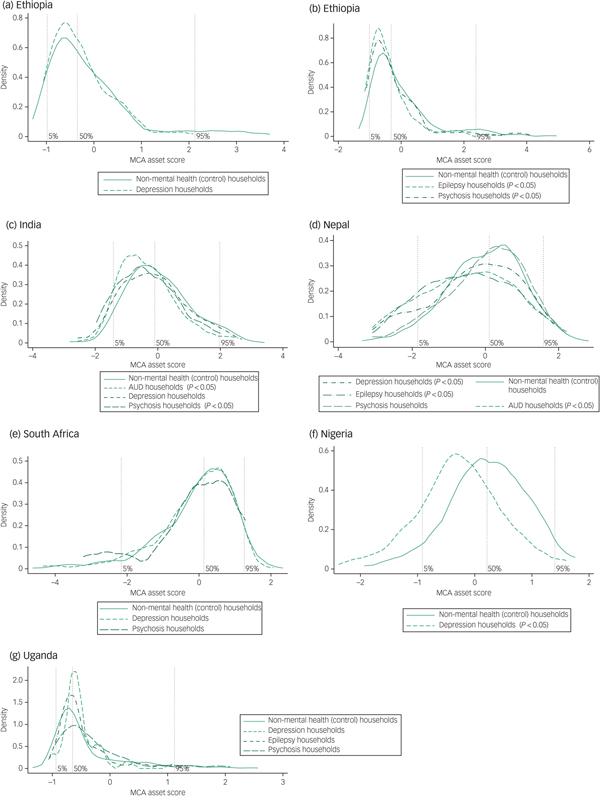
We found a greater density of non-MNS households in the highest 95th wealth percentile in all countries (Fig. 2). Conversely, there was a greater density of MNS households in the poorest 50th percentile in Ethiopia, India, Nepal and Nigeria but this was less evident in South Africa and Uganda. The greater density was more pronounced in households with psychosis and epilepsy, in keeping with the pooled analysis of income and consumption across countries (Table 2). The difference in the distribution of asset scores was significant for Ethiopia, India, Nepal and Nigeria, with the exception of the depression groups in Ethiopia and India and the small psychosis group in Nepal. The trend was most pronounced in Nigeria where 18.8% of the non-MNS households were in the highest quintile compared with 7.2% of the depression group households, and 20.3% of the control households were in the lowest quintile compared with 49.4% of the depression group households.

Fig. 2 Kernel densities of asset scores by country for mental, neurological and substance use (MNS) disorder and control (non-mental health) household groups.
Healthcare expenditure
Across most settings, households with an MNS disorder reported higher rates of any healthcare expenditure when compared with non-MNS households, with the exception of the depression group households in India, the AUD and small sample of epilepsy group households in Nepal and the depression group households in Nigeria and South Africa. In absolute terms, households with an MNS disorder reported higher healthcare expenditure than households without an MNS disorder, with the exception of the AUD and psychosis groups in India, the AUD group in Nepal and the depression group in Nigeria (Supplementary Table 6). Out-of-pocket healthcare expenditure ranged from US$0.30 per adult equivalent per month in the epilepsy group in Ethiopia, to US$5.54 in the psychosis group in Nepal. In the pooled analysis (Table 2), out-of-pocket healthcare expenditure was significantly higher in AUD and depression groups (median monthly difference: US$1.25 (95% CI 0.77 to 1.74) and US$0.50 (95% CI 0.14 to 0.86), P < 0.01) compared with non-MNS households, and significantly lower in the epilepsy group (median monthly difference: −US$0.78 (−1.29 to −0.27), P < 0.01).
There were high proportions of all households reporting catastrophic health expenditure, whether it was defined as 10% or more of effective income or as 40% of capacity to pay. Compared with control households, higher proportions of catastrophic health expenditure were reported in all MNS households in Ethiopia, depression group households in India, psychosis group households in Nepal and depression group households in Nigeria. There was lower catastrophic health expenditure for the MNS households in South Africa and inconsistent findings in Uganda. In the pooled data, there were similarly heterogeneous findings across disorder groups in relation to catastrophic health expenditure (Table 2).
Financial coping strategies
In relation to financial coping strategies, a higher proportion of households with an MNS disorder reported using current cost-minimisation strategies (for example restricting food, use of healthcare or withdrawing children from school to minimise household consumption) than households without an MNS disorder (odds ratio (OR) = 1.65, 95% CI 1.46–1.87, P < 0.01) for all MNS disorders combined (Table 2). The only exception was the small psychosis group in South Africa. These trends were significantly higher in Ethiopia (all groups), Nepal (all groups), Nigeria (depression group) and South Africa (depression group). Cost-minimisation strategies were widely used by households with an MNS disorder across all countries, including 54.8% in Ethiopia, 36.1% in India, 32.5% in Nepal, 43.2% in Nigeria, 22.7% in South Africa and 86.2% in Uganda.
Cost-management strategies (including borrowing from social networks, finding extra work, exhausting savings and taking out loans from money lenders in response to financial difficulty) were more prevalent among households with an MNS disorder than households without an MNS disorder in all countries (OR = 1.28, 95% CI 1.11–1.48, P < 0.01) for all MNS disorders combined (Table 2). Some exceptions were found in the epilepsy group in Ethiopia, the small psychosis groups in India and Nepal and the depression and small psychosis groups in South Africa. Cost-management strategies were widely used by MNS disorder households across all countries, including 69.5% in Ethiopia, 93.1% in India, 78.7% in Nepal, 84.1% in Nigeria, 61.7% in South Africa and 95.1% in Uganda.
Additionally, households with MNS disorders were consistently making use of a greater number of concurrent distress financing strategies in response to financial difficulty than households without MNS disorders (OR = 0.44, 95% CI 0.31–0.57, P < 0.01) for all MNS disorders combined (Table 2). These were significantly higher for all disorder groups in Ethiopia, AUD in India, all disorder groups in Nepal, depression in Nigeria and all disorder groups in Uganda. This trend was more pronounced for households with psychosis. The mean number of concurrent strategies being used by MNS households was 2.4 in Ethiopia, 3.4 in India, 3.0 in Nepal, 2.8 in Nigeria, 1.2 in South Africa and 4.8 in Uganda.
Discussion
Main findings
This study provides new evidence on the household economic costs associated with MNS disorders in LMICs. Despite diverse social, economic and cultural contexts in Ethiopia, India, Nepal, Nigeria, South Africa and Uganda, we found a relatively consistent pattern, namely that households living with someone with an MNS disorder are economically worse off than control households, using a variety of assessment measures. With some notable exceptions, households with an MNS disorder had lower levels of adult education (in 11 of 16 MNS disorder groups), lower housing standards indicated by access to improved sanitation facilities (10/16), lower total household income (11/16), lower effective income (9/16), lower non-health consumption (10/16), less asset-based wealth (10/16), higher healthcare expenditure (12/16) and greater use of deleterious financial coping strategies, including cost management (11/16), cost minimisation (15/16) and higher numbers of concurrent distress financing strategies (13/16).
Income, consumption and wealth differences and financial coping strategy differences between MNS and control households were more extreme for psychosis and epilepsy than for depression and AUD. This may be indicative of more pronounced lost production opportunities or more constant healthcare spending as a result of the chronic and more disabling nature of psychosis and epilepsy, but further research is required to test these hypotheses.
Our findings showed that households affected by MNS disorders have lower effective incomes available to them once their basic subsistence needs have been met, when compared with households without a person with an MNS disorder. In absolute terms these households have extremely limited resource availability to meet the (non-food) needs of their households. In contexts such as these, households are likely forced to make difficult decisions around whether to use these resources for education, housing or healthcare with substantial opportunity costs for all household members.
Interpretation of our findings
Similar to findings from a previous systematic review,Reference Lund, Breen, Flisher, Kakuma, Corrigall and Joska11 there was some heterogeneity with respect to non-health consumption comparing households with a member with an MNS disorder to those without, and this may be explained by two possible considerations. First, in settings where there were no differences between these groups, households may be mitigating risks to their non-health consumption against the impact of the MNS disorder through cost-minimisation strategies, cost-management strategies and increased access to transfers from family members, community groups and government grants. The increased use of deleterious coping strategies evident in MNS households are likely to allow those households to maintain levels of consumption, despite the resulting long-term negative consequences for the assets and livelihood of these households.
Second, where households with a member with an MNS disorder were found to have higher non-health consumption compared with the control households, this may suggest these households are making less use of healthcare (and therefore incurring a lesser amount of health consumption) when compared with the control households affected by physical health concerns.
With respect to out-of-pocket health expenditure, households that are not affected by an MNS disorder more often report no health expenditure, and in absolute terms, of those that did incur health expenditure, households affected by MNS disorder are spending a higher amount on healthcare compared with households that are not affected by MNS disorder. The households living with a person with an MNS disorder are also on average spending a greater share of their capacity to pay on healthcare, when compared with the control households. However, households that are unaffected by MNS disorders that did incur health expenditure more often met the threshold for catastrophic health spending when compared with the MNS households. This could suggest that although households that are not affected by MNS disorder make use of healthcare more infrequently, among those that do, their healthcare needs may be more acute and severe with higher costs (such as admissions to hospital) compared with households with a member with an MNS disorder who use healthcare more frequently to support longer-term, chronic care needs.
Differences between disorder groups in the pooled analysis are also worth noting: out-of-pocket payments are higher in depression and AUD groups than the psychosis and epilepsy groups. This may be because the psychosis/epilepsy group are already substantially poorer and have shifted themselves to a level of poverty that means that they no longer can spend money on healthcare. This is supported by their lower income and consumption and higher use of regressive financial coping strategies – including reducing food intake that affects the denominator for catastrophic costs. This finding may also indicate that the measurement of catastrophic healthcare costs in isolation can be misleading in situations of extreme poverty.
Implications
Perhaps one of the more striking findings was that households with a person with an MNS disorder are adopting a range of deleterious coping strategies in response to financial hardship that are significantly more regressive than households without an MNS disorder – a finding that was perhaps most consistent across disorder groups and across countries, of all the economic outcome measures we included. These coping strategies include withdrawing children from school, restricting food intake, restricting healthcare, using savings, taking out loans and accounts at shops, and asking employers and other social networks for help. Use of these strategies provides the evidence that current and future non-health consumption choices are being compromised, including savings and assets and human capital formation of children. The consequences are lifelong and can contribute to intergenerational transmission of poverty.Reference Bird25
Exceptions
Despite the overall trend that households with an MNS disorder are financially worse off, there are important exceptions (noted above). One reason for the exceptions may be the small sample sizes for some groups, for example the psychosis group in South Africa (n = 21), the epilepsy group in Nepal (n = 36), the psychosis group in India (n = 31), and the depression (n = 53) and psychosis (n = 46) groups in Uganda. Second, South Africa was an exception in several instances, possibly as a result of its extensive social welfare system, which acts as a buffer for households, reducing the economic impact of disabilities such as those associated with MNS disorders. South Africa also has a free healthcare system, despite ongoing challenges of access and quality, which may explain the lack of difference between groups in healthcare expenditure. In addition, participants from control households in South Africa were recruited from chronic disease clinics, which provide treatment for HIV, tuberculosis and chronic non-communicable diseases, and these chronic disabling conditions are also likely to have a substantial independent negative impact on household economic status in the control households. Third, Uganda was an exception in several instances, and this may be explained by both small sample sizes for two groups and the presence of a high proportion of individuals with long-term care needs in the control households.
In addition, it is important to note that each comparison is between a disorder group and its relevant comparison group, and that the comparisons were not undertaken between disorder groups. We believe this is important as the household-level economic dynamics of different disorders are likely to be very different. For example, the economic impact of AUDs include both the direct costs of consumption of alcohol as well as the disabling effects of the disorder; whereas the economic impact of depression does not carry the same direct costs, but is nevertheless disabling, reducing productivity and consuming carer time. The details of the findings per disorder and per country are presented in supplementary Tables 4, 5 and 6, and the data will be subject to further analysis through country-specific papers.
Limitations
This study has a number of limitations, which need to be noted. First, the cross-sectional survey design makes it difficult to draw conclusions regarding causality or the direction of the relationship between household economic adversity and MNS disorders.Reference Dohrenwend, Levav, Shrout, Schwartz, Naveh and Link7 Second, large-scale quantitative studies may overlook the dynamics of specific household financial strategies and attempts to cope with adversity. Third, this study did not quantify the indirect healthcare costs associated with accessing health services, potentially underestimating the rates of catastrophic health spending across the study sites. Evidence from several studies conducted in LMICs has suggested that indirect costs associated with healthcare seeking often exceed the direct costs, with some estimates indicating indirect cost burdens to be 2 to 3.6 times greater than direct cost burdens.Reference McIntyre, Thiede, Dahlgren and Whitehead2,Reference Koopmanschap and Rutten26–Reference Sauerborn, Adams and Hien30 In addition, given the levels of deprivation that exist in our study sites, lower thresholds of catastrophic health consumption should be examined.
Fourth, although our household sample(s) were recruited based on the presence of one member with an MNS disorder, identified via separate studies, we were not able to screen all household members for MNS disorder or other chronic diseases and were therefore unable to examine and control for the impact of having multiple household members with an MNS disorder or other disabling health conditions. Households within our control group could have therefore also included members affected by an MNS disorder. Fifth, by pooling data across diverse country settings (shown in Table 2), we run the risk of glossing over considerable heterogeneity in sample sizes, case detection methods and other variables. The pooled findings should therefore be interpreted with caution, and read alongside the country-specific data presented in supplementary Tables 5 and 6. Sixth, our selection of MNS disorders in this study was limited by the priorities of the Ministries of Health and the PRIME and STEPCARE studies, with which the Emerald household surveys were linked. Finally, apart from the quantile regressions, we did not conduct in-depth regression analyses in this paper, to determine which factors were associated with worse economic circumstances in households living with MNS disorders. These further analyses will be explored in more detail in country-specific publications from this data-set.
Further longitudinal research is required to examine possible causal mechanisms in the relationship between MNS disorders and household economic status in LMICs. Qualitative research in specific local settings will also be required to understand the household economic dynamics involved in living with a family member with an MNS disorder, for example the complex relationships between income, consumption, assets and financial coping strategies.
Our study includes people who were generally attending primary care facilities for a physical health complaint and were also screened positive for an MNS disorder. Although we did not conduct an assessment of physical health needs, it is likely that there were therefore high levels of comorbidity between MNS disorders and physical health problems in these participants. This has two important policy implications: first, the high comorbidity between physical health and MNS disorders in primary care populations has been frequently documented, and primary care programmes need to adopt an integrated approach that addresses both the physical and mental health needs of people who use these services. Second, our estimates of the economic burden of MNS disorders is likely to underestimate this burden in relation to the general (healthy) population, as our comparison group included people who had other physical health complaints and therefore were likely to have incurred other economic costs associated with their physical health condition.
Recommendations
There are several recommendations for policymakers. This study presents striking findings regarding the adverse household economic circumstances associated with having a family member with an MNS disorder. Protection of households from economic vulnerability, including shocks are given specific attention in the sustainable development goals, particularly goal 1.5. Our findings indicate that households living with a person with an MNS disorder constitute an economically vulnerable population, who are highly susceptible to chronic poverty and intergenerational poverty transmission and who merit development assistance. In broad terms this should come in two forms. First, improved access to evidence-based care and rehabilitation is essential, delivered using primary care and community-based platforms, as currently being developed and scaled up through PRIME,Reference Lund, Tomlinson, De Silva, Fekadu, Shidhaye and Jordans19 and other global mental health innovations.Reference Chibanda, Weiss, Verhey, Simms, Munjoma and Rusakaniko31 The strikingly low levels of health insurance cover across all countries, and the lack of access to mental health services point clearly to the need for the treatment of MNS disorders to be included in universal health coverage packages of care, as set out in the sustainable development goals.Reference Thornicroft and Patel3,Reference Ssebunnya, Kangere, Mugisha, Docrat, Chisholm and Lund32
Second, it is essential to improve financial assistance to households living with MNS disorders in the form of disability grants or cash transfers. There is robust emerging evidence for the benefits of cash transfers for economic welfare, mental health, well-being, reductions in stress (measured using salivary cortisol) and domestic violence.Reference Fernald and Gunnar33,Reference Haushofer and Shapiro34
Funding
The research leading to these results is funded by the European Union's Seventh Framework Programme (FP7/2007-2013) under grant agreement n° 305968. The funder had no role in study design, data collection and analysis, decision to publish or preparation of the manuscript. G.T. is supported by the National Institute for Health Research (NIHR) Collaboration for Leadership in Applied Health Research and Care South London at King's College London NHS Foundation Trust. The views expressed are those of the author(s) and not necessarily those of the NHS, the NIHR or the Department of Health. G.T. acknowledges financial support from the Department of Health via the NIHR Biomedical Research Centre and Dementia Unit awarded to South London and Maudsley NHS Foundation Trust in partnership with King's College London and King's College Hospital NHS Foundation Trust. G.T. is supported by the European Union Seventh Framework Programme (FP7/2007-2013) Emerald project. G.T. also receives support from the National Institute of Mental Health of the National Institutes of Health under award number R01MH100470 (Cobalt study). G.T. is also supported by the UK Medical Research Council in relation the Emilia (MR/S001255/1) and Indigo Partnership (MR/R023697/1) awards. C.H. is supported by the NIHR Global Health Research Unit on Health System Strengthening in Sub-Saharan Africa, King's College London (GHRU 16/136/54). The views expressed are those of the author(s) and not necessarily those of the NHS, the NIHR or the Department of Health and Social Care. C.H. and C.L. are supported by PRIME, which is funded by the UK Department for International Development (DfID) [201446]. The views expressed in this article do not necessarily reflect the UK Government's official policies. C.H. additionally receives support from AMARI as part of the DELTAS Africa Initiative (DEL-15-01).
Acknowledgements
We would like to thank all expert panel members who participated in this study. We are grateful to Dr Sujit Rathod of the London School of Hygiene and Tropical Medicine and Dr Ioannis Bakolis of the Institute of Psychiatry, Psychology and Neuroscience, King's College London for their support with statistical analysis. Data are available for further analysis via the first author. The questionnaires administered in the use of this study are available on request from the corresponding author. The data collected in the course of this study cannot be shared publicly as we did not obtain consent from study participants to publicly share their data.
Supplementary material
Supplementary material is available online at https://doi.org/10.1192/bjo.2019.20.


 Open access
eLetters
No eLetters have been published for this article.