


Nomenclature
- LBO
-
Lean Blowout
- DCN
-
Derived Cetane Number
- FAR
-
fuel-air ratios
- PID-controlled
-
Proportional Integral Derivative Control
- ATJ
-
alcohol to jet fuel
- IPK
-
iso-paraffinic kerosene
- HEFAs
-
hydro-processed esters and fatty acids
- SPK
-
Synthetic Paraffinic Kerosene
- NJFCP
-
National Jet Fuel Combustion Program
- F-T
-
Fischer-Tropsch
- RP2
-
Rocket Propellent 2
- i-paraffins
-
iso-paraffins
- n-paraffins
-
normal-paraffins
- c-paraffins
-
cyclo-paraffins
- R 2
-
Correlation Coefficients
- k
-
Gradient of The Linear Trend Line
- φ
-
LBO Equivalence Ratio
1.0 Introduction
The development and implementation of sustainable alternative jet fuels is an ongoing area of interest within the aerospace industry and fuel research community. To date, many alternative fuels have been proposed in an effort to mitigate concern regarding increased emissions associated with anthropogenic global warming, and to diversify supply routes away from purely relying on fossil fuel sources [Reference Khandelwal, Ubogu, Akram, Blakey and Wilson1]. Due to the ongoing energy concerns and potential regulative and statutory changes to environmental protection measures, research is focused on examining important factors thought to determine emission profiles in aero-engines, including the effect of new engines [Reference Collins and McLarty2], varying fuels [Reference Brem, Durdina, Elser, Setyan, Schönenberger, Wyss, Zeyer and Siegerist3, Reference Zheng, Ling, Ubogu, Cronly, Ahmed, Zhang and Khandelwal4] and measurement methods [Reference Petzold, Marsh, Johnson, Miller, Sevcenco, Delhaye, Ibrahim, Williams, Bauer, Crayford, Bachalo and Raper5]. As an example of emission control, Khandelwal et al. [Reference Khandelwal, Cronly, Ahmed, Wijesinghe and Lewis6] showed that larger particulates are produced by fuels with higher aromatic content. In another study [Reference Lobo, Christie, Khandelwal, Blakey and Raper7], it was shown that n-Paraffins emit lower concentrations of particulate emissions. There is a general consensus within the research community that operating gas turbines at lean equivalence ratios is the most direct and effective way to achieve a high combustion efficiency while reducing key emission parameters, such as non-volatile particulate matter and NOx. Sharma et al. [Reference Sharma, Singh, Almohammadi, Khandelwal and Kumar8] observed that higher temperatures that occur at fuel-rich burning condition cause higher NOx emissions due to the disassociation of atmospheric nitrogen into nitrites of oxygen. Focusing on lean fuel combustion can minimise NOx emissions while maintaining high combustion efficiency [Reference Menon, Eggenspeiler and Porumbel9]. Therefore, lean fuel combustion has been identified as an important aspect of aviation energy conservation and emission reduction [Reference Gupta, Malte, Brunton and Novosselov10]. There is a practical limit to the minimum fuel supply rate to a gas turbine in order for it to sustain stable combustion, however. The leaner operating a gas turbine is, the closer that engine approaches its specific lean blowout limit. In light of this practical limitation, obtaining a methodology to determine and predict the LBO limit accurately for a given gas turbine, application and fuel source is crucial [Reference Xie, Huang, Hu and Wang11].
Lean fuel combustion is on on-going area of interest for propulsion engine systems [Reference Esclapez, Ma, Mayhew, Xu, Stouffer, Lee, Wang and Ihme12]. In recent years, and increased focus on safety of operation and emission minimisation have received increased attention [Reference Xiao and Huang13]. LBO is a significant safety hazard for aeroengines and necessitates an expensive and time-consuming shutdown and restarting procedure for stationary engines [Reference Sen, Chaudhari and Mukhopadhyay14]. There are specific concerns due to the effects of new alternative fuels on LBO due to their unfamiliar combustion characteristics and lack of empirical combustion state data. This knowledge gap contributes to uncertainty with regard to the potential of fuel optimisation and the development and the certification of new fuels. This paper focuses on experimental data obtained from a variety of new aviation fuels in a gas-turbine combustor, with the aim of analysing the impact of different fuel characteristics on the LBO limit.
To ensure airworthiness and safety, a number of studies have attempted to analyse the LBO mechanism and identify key LBO precursors that predict blowout. In experiments designed to study the state of the heat flow field in a combustion chamber before flameout, Muruganandam and Seitzman [Reference Muruganandam and Seitzman15] point out that the LBO mechanism is essentially an insufficient chemical reaction combined with prolonged fuel vaporisation, poor fuel-air mixing and random heat release fluctuations. Several LBO semi-empirical correlations have been proposed to estimate the LBO performance for combustors. Among these correlations, Lefebvre’s model has been employed extensively. According to the conclusion drawn by Lefebvre, based on extensive experimental experience [Reference Lefebvre and Ballal16], LBO fuel air ratio is mainly determined by the geometry of the combustor, thermo-fluidic properties of the given mass flow, and fuel property parameters. For the physical properties of fuel, only the atomisation mass and vaporisation rate have been taken into consideration. In numerical LBO investigations, Large Eddy Simulations (LES) have been used to predict and understand the effects of fuel properties on the LBO limits in a combustor [Reference Esclapez, Ma, Mayhew, Xu, Stouffer, Lee, Wang and Ihme12, Reference Esclapez, Ma, Mayhew, Xu, Stouffer, Lee, Wang and Ihme17]. In simulation results, the recirculating gas temperature and position have been suggested as the direct main factors that cause a flameout. In this study, two fuels were simulated with different characteristics, Cat-A2 and Cat-C5, but have not been effectively analysed for the impact of the difference in fuel characteristics on LBO. However, the results of the experimental study show that A2 and C5 differ greatly in the flameout performance. Therefore, it remains doubtful whether the LES alone can effectively predict the LBO behaviour according to the fuel characteristics.
With the emergence of a variety of new aviation fuels, the influence of fuel properties on the combustion characteristics of engines has attracted increasing research attention and interest [Reference Colket, Heyne, Rumizen, Edwards, Gupta, Roquemore, Moder, Tishkoff and Li18, Reference Ahmed, Zheng, Ubogu and Khandelwal19]. In addition to the specified limitations on the chemical and physical properties of certain fuels in ASTM standards [20], few researchers have studied the equivalence ratio at LBO conditions. Esclapez et al. [Reference Esclapez, Ma, Mayhew, Xu, Stouffer, Lee, Wang and Ihme21] predicted strong fuel effects on the LBO limit by using widely employed experimental correlations. Grohmann et al. [Reference Grohmann, Rauch, Kathrotia, Meier and Aigner22] concluded that fuel differences in the LBO can be due to differences in the physical properties as well as in the chemical properties of the fuels. Won et al. [Reference Won, Rock, Lim, Nates, Carpenter, Emerson, Lieuwen, Edwards and Dryer23] determined that the LBO behaviour is dominated by the fuel boiling characteristics at low inlet air temperatures and by the chemical reactivity under high-temperature operating conditions. Significantly improved correlations were observed when the results were re-evaluated using the DCN values of initial 20% distillation cuts of all six fuels considered in this study. This indicates that fuel characteristics related to ignition parameters play an important role in LBO performance. DCN is an important parameter to determine fuel ignition characteristic and has been historically in fuel standards for road transportation. Recently DCN has found its place in alternative aviation fuels standard, to maintain the safely. Burger [Reference Burger24] found a strong correlation between the flameout parameter and the derived cetane number (DCN), which is a common analysis indicator for autoignition propensity. Stouffer et al. [Reference Stouffer, Hendershott, Monfort, Diemer, Corporan, Wrzesinski and Caswell25] also observed that low-cetane number fuels demonstrate worse LBO performance. Colborn et al. [Reference Colborn, Heyne, Hendershott, Stouffer, Peiffer and Corporan26] stated that LBO exhibited dependency on the physical properties (such as viscosity) at low temperatures and pressures, whereas chemical properties (such as DCN) are indicative at high air and fuel temperatures and pressures. All the experimental campaigns mentioned so far, however, are based on the discussion of existing refined fuels, which have a wide variety of chemical and physical properties.
Due to the improved atomisation of fuel in lean combustion, gas turbines can operate at significantly lower global fuel-air ratios than those encountered in fuel-rich combustion. Burger et al. [Reference Burger, Yates and Viljoen27] pointed out that the LBO performance correlated with flame stretch, chemical reactivity, volatility and density to different degrees in both the regions of combustor operation. The LBO process is a completive coupling mechanism, which is sensitive to many flame stabilisation aspects, including the combustor system, fuel fluid state, fuel chemical and physical properties and operating method [Reference Shanbhogue, Husain and Lieuwen28–Reference Mukhopadhyay, Chaudhari, Paul, Sen and Ray30]. In one of our previous work relationships between the fuel properties with flame color at the moment of flameout using seven different fuels have been studied [Reference Ahmed, Zheng, Ubogu and Khandelwal19]. Impact of fuel density, viscosity and aromatic content on lean blow off and blue to yellow flame area was studied using seven different fuels. It was preliminary observed that aromatic content could be changed to optimise the fuel in the lean burn state. Further analysis on these seven fuels has shown that soot formation tendency and LBO performance follow contradictory trends with increasing value of different fuel properties under observation [Reference Zheng, Cronly, Ubogu, Ahmed, Zhang and Khandelwal31, Reference Khandelwal, Zheng and Wijesinghe32]. Impact of different aromatic classification on PM has also been presented in this study. It was preliminary suggested that specific additives could be used to increase the DCN of the given fuel provides an efficient way to optimise future fuels in terms of lowering their LBO limits.
It can be seen from the above literature that majority of the research on the LBO limit has focused on quantifying the performance of various fuels with some differences in physical and chemical properties in model laboratory combustors. Majority of these studies have used fuels which are commercially available and these fuels do not have significantly different properties; for an example DCN, distillation curve. Many researchers have studied this area from the perspective of experimental and numerical research. However, according to author’s knowledge there is no detailed study where fuel properties for an example DCN have been changed systematically and evaluated on an actual existing gas turbine combustor for its impact on LBO. In the current study experiments have been conducted on three different burner states for a total 35 different variation of fuel with different properties. Larger dataset gives significant confidence in the correlations and trends being observed. The research also aims to reduce the risk of fuel certification failure for new fuels and provides effective data and detailed impact study for promoting future fuel optimisation.
2.0 Experimental setup and methodology
2.1. Experimental rig
A Rolls-Royce Tay gas turbine combustor was adopted in this study. A schematic of the Tay gas turbine combustor experimental configuration is shown in Fig. 1. A photograph of the corresponding combustion test rig is shown in Fig. 2. This combustor configuration has also been used in previous research [Reference Zheng, Cronly, Ubogu, Ahmed, Zhang and Khandelwal31]. The air supply system was powered by an industrial design standard fan meeting the BS EN ISO 5,167 standard. The fan driven motor can supply air at low pressure (101.3 $ \pm $
1 kPa) with 1% uncertainty, which is monitored and controlled by proprietary LabVIEW code. The inlet air mass flow rate was measured by an orifice flowmeter. The function of the flowmeter satisfied the BS: 5,167 standard. The fuel supply system was designed with compressed nitrogen to pressurise the fuel vessel. The fuel flow rate was controlled by two (coarse and fine) air-actuated needle valves and were measured by a Coriolis meter. A picture of the experimental combustor geometry schematic diagram and injector is shown in Fig. 3. A Rolls Royce air-assisted atomiser was used as the injector, which uses a relatively small amount of high-velocity air to atomise the fuel [Reference Lefebvre and Ballal33, Reference Wijesinghe and Khandelwal34]. The atomisation air pressure was regulated and remained constant at 4 bars.
$ \pm $
1 kPa) with 1% uncertainty, which is monitored and controlled by proprietary LabVIEW code. The inlet air mass flow rate was measured by an orifice flowmeter. The function of the flowmeter satisfied the BS: 5,167 standard. The fuel supply system was designed with compressed nitrogen to pressurise the fuel vessel. The fuel flow rate was controlled by two (coarse and fine) air-actuated needle valves and were measured by a Coriolis meter. A picture of the experimental combustor geometry schematic diagram and injector is shown in Fig. 3. A Rolls Royce air-assisted atomiser was used as the injector, which uses a relatively small amount of high-velocity air to atomise the fuel [Reference Lefebvre and Ballal33, Reference Wijesinghe and Khandelwal34]. The atomisation air pressure was regulated and remained constant at 4 bars.

Figure 1. The layout the of the experimental setup.

Figure 2. Photograph of combustion test rig.

Figure 3. The details of the combustor chamber and air-assist atomiser.
A low-voltage analog voltage controller via an NI SCXI chassis and a computer control unit were designed to control all the fuel/air valves and the provided air compressor power. The measured data from the orifice flowmeter and fuel flow Coriolis meter were recorded and displayed on the control screen for experiment monitoring purposes. In this experiment, the LBO tests were carried out under three constant air mass flow conditions: 0.2 kg/s, 0.26 kg/s and 0.32 kg/s, which will directly affect the dilution degree in burner, temperature field, flameout stretch rate, etc.
2.2. Experimental procedures
The incoming air flow was heated and sustained at 323.15K by an atmospheric line heater. In order to ensure that the gas in the pipeline is evenly heated, the heater was located near the air compressor, approximately 5m away from the combustion chamber, (the pipeline is wrapped with an insulation layer). The temperature detection point was located at the front end of the burner and formed a feedback control system with the heating controller to ensure temperature stability. The air flow was adjusted to the constant values; 0.2, 0.26 and 0.32kg/s, and the error, set by the LabView based PID control code, would not go over 3%. Prior to the point of ignition, the fuel injection rate was adjusted to 1.5g/s. This injection rate was selected for obtaining ease of ignition observed during previous studies. After ignition the combustor fuel flow was continuously altered until a stable exhaust temperature of 400°C was achieved. Next, the fuel flow was steadily decreased in steps of 0.0001g/s using a PID-controlled fuel flow drop steps. To provide steady-state operation identified by the exhaust gas temperature, a stable fuel supply was sustained for 5 minutes before reducing the fuel mass flow rate further. An instantaneous decrease in combustor upstream pressure and exhaust gas temperature helped to determine the LBO point. The process was repeated between 10 and 20 times depending on the degree of result deviation. To ensure the reliability and repeatability, only the 5 data concentrated in the highest position of the chart are selected as valid data for further analysis.
2.3. Tested fuels
Ten fuels have been tested for this study, composed of three kerosene-based fuels (A1, A2 and A3) and seven alternative fuels, the details of which are summarised in Table 1. All these fuels have been used in a wider jet fuel research program known as the National Jet Fuel Combustion Program (NJFCP) [Reference Colket, Heyne, Rumizen, Edwards, Gupta, Roquemore, Moder, Tishkoff and Li18]. This program aims to investigate the impact of alternative jet fuel implementation on engine combustion, with a focus on the topic of LBO [Reference Zheng, Ahmed, Ubogu, Zhang and Khandelwal35].
Table 1. Introduction of the tested fuels
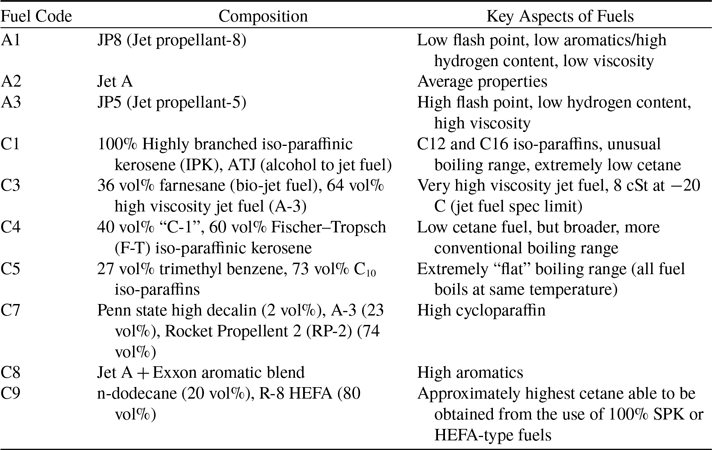
Among these fuels, A1 (JP8), A2 (Jet A) and A3 (JP5) are the conventional fuels legacy fuels used by aircraft engines currently in service for civilian and military applications. In comparison, A1 has better combustion performance because it is easier to be ignited due to its low flash point, and has lower carbonaceous emissions due to its higher H/C ratio. The opposite is conversely the worse using the same metrics A3 and A2 can be considered as between the A1 and A3.
C1 is converted from alcohol named ATJ (alcohol to jet fuel), which is 100% made of Iso-paraffins and has extremely low cetane number of 17.1. According to the literature, DCN will be an important indicator influencing LBO, so the combustion performance of C1 can be used as a valuable reference for fuels with exceptionally low valued compared to conventional fuels.
C3 contains 64% A3 (JP5) and 36% farnesane obtained from sugar cane. Farnesane (2,6,10 Trimethyl Dodecane) is used for its high DCN and ignition characteristics. It’s a bio derived fuel or extender for diesel engines. The advantages of farnesane in terms of pollutant emissions makes it a potential biofuel for diesel engines. The proportion of this component in the tested fuel far exceeds the current approved drop-in value (10%) [Reference Walls and Rios-Solis36]. Its viscosity is the highest with 8 cSt at 20°C.
C4 is a blend comprised of 60% coal to jet fuel (Sasol iso-paraffinic kerosene) and 40% alcohol to jet fuel (C1). The iso-paraffinic contents of these two mixed fuels are both respectively high, then reaching 98% after mixing, so its cetane value is relatively low like C1.
C5 is a fuel composed of C10 Iso-paraffins mixed with the aromatic compound, Trimethylbenzene (27%), which is usually used as a gasoline (petrol) additive to increase the octane rating and reduce knocking. Another key feature of this fuel is that it has an extremely flat boiling range.
C7 is made of JP 5 (A3) and Rocket Propellent 2 (RP-2) blended with decahydronaphthalene (2% decalin). Decahydronaphthalene, a polycyclic non-aromatic hydrocarbon with a double cyclohexane ring structure, is difficult to completely decompose when the fuel is burned, resulting in heavier particulate matter emissions. Rocket Propellent 2 is a form of highly refined kerosene which bears a strong similarity to jet fuel, but has very high flash point. Of all the fuels tested, C7 fuel has the highest flash point at 64°C, which means autoignition may occur relatively rarely following LBO. This fuel can be compared with the fuel with the smallest flash point, A1, as a reference to try to explore whether autoignition plays an important role in lean fuel combustion.
C8 is Jet A (A2) fuel blended with aromatic species supplied by ExxonMobil and the type information of specific aromatics is unknown. In the ASTM standard, the aromatic content in ready-to-use fuels is limited to 8% to 25% [20, Reference Pires, Han, Kramlich and Garcia-Perez37].
C9 is composed of 80% hydro-processed esters and fatty acids (HEFAs) and 20% n-dodecane. It has the highest DCN of 63.3 and this is also the top limit of DCN can be achieved from Synthetic Paraffinic Kerosene (SPK) and HEFAs fuel. A summary of the fuel physical and chemical properties is given in the Tables 2 and 3.
Table 2. Physical properties of the tested fuels

Table 3. Chemical properties of the tested fuels

3.0 Results and discussion
In this section, the LBO experimental results for three conventional fuels and seven surrogate fuels are presented, discussed and analysed at each equivalence ratio. The results are mainly focused on the effects of fuel properties on the LBO behaviour. It was observed that there are poor correlations of the LBO performance with molecular weight and viscosity. Moreover, DCN shows a strong relationship with LBO performance, and it is followed by the fuel properties of net heat of combustion, i-paraffins content and c-paraffins content. The impact of all these properties is discussed in the following sections.
3.1. Equivalence ratio at LBO
The equivalence ratio ( $\phi $
) at LBO for the ten fuels under the above three air flow conditions is directly calculated based on the recorded readings from the mass flowmeter at the LBO point. The average value for each fuel and condition is plotted in Fig. 4, and the error bar is one standard deviation of the results. It can be observed overall that as the inlet air volume increases, all fuels are extinguished at a higher equivalence ratio. This shows that an increase in the amount of inlet air will negatively impact the stability of the lean flame in the combustion chamber. This phenomenon could be due to the fact that the entry of cold air and subsequently increase oxygen supply into the chamber from the dilution hole further enhances the uncertainty of the flow field and reaction rate in the combustion chamber. The mixing degree, secondary atomisation, local incidence of autoignition and combustion reaction rates would all change when flow rate changes.
$\phi $
) at LBO for the ten fuels under the above three air flow conditions is directly calculated based on the recorded readings from the mass flowmeter at the LBO point. The average value for each fuel and condition is plotted in Fig. 4, and the error bar is one standard deviation of the results. It can be observed overall that as the inlet air volume increases, all fuels are extinguished at a higher equivalence ratio. This shows that an increase in the amount of inlet air will negatively impact the stability of the lean flame in the combustion chamber. This phenomenon could be due to the fact that the entry of cold air and subsequently increase oxygen supply into the chamber from the dilution hole further enhances the uncertainty of the flow field and reaction rate in the combustion chamber. The mixing degree, secondary atomisation, local incidence of autoignition and combustion reaction rates would all change when flow rate changes.

Figure 4. LBO equivalence ratio results of the ten tested fuels at three air flow conditions.
It also is evident from the Fig. 4 that under all the operating conditions, C1, the fuel consisting of 100% Iso-paraffins with the smallest DCN, blows out at the highest equivalence ratio ( $\phi $
). This may mean that a fuel composed of a single molecular compound performs poorly in terms of flame stability. On the other hand, this could be an impact of lower DCN value of this particular fuel. Due to lower DCN fuel does not ignites easily, and the autoignition propensity of fuel with such droplets severely limit its ability to continue burning when the fuel is lean. On the other hand, C9, which exhibits the highest DCN, has the lowest equivalence ratio (0.01944 at air flow 0.2kg/s condition). This phenomenon coincides with Won’s speculation [Reference Won, Rock, Lim, Nates, Carpenter, Emerson, Lieuwen, Edwards and Dryer23] that the LBO is highly relative to the autoignition propensity of the fuel as suggested by its DCN. Notably, except for C9, all the alternative fuels with a DCN ranging from 17 to 47 experience blowout at higher lean boundaries than that of A3. Therefore, the impact of other fuel property factors on the LBO performance cannot be ignored.
$\phi $
). This may mean that a fuel composed of a single molecular compound performs poorly in terms of flame stability. On the other hand, this could be an impact of lower DCN value of this particular fuel. Due to lower DCN fuel does not ignites easily, and the autoignition propensity of fuel with such droplets severely limit its ability to continue burning when the fuel is lean. On the other hand, C9, which exhibits the highest DCN, has the lowest equivalence ratio (0.01944 at air flow 0.2kg/s condition). This phenomenon coincides with Won’s speculation [Reference Won, Rock, Lim, Nates, Carpenter, Emerson, Lieuwen, Edwards and Dryer23] that the LBO is highly relative to the autoignition propensity of the fuel as suggested by its DCN. Notably, except for C9, all the alternative fuels with a DCN ranging from 17 to 47 experience blowout at higher lean boundaries than that of A3. Therefore, the impact of other fuel property factors on the LBO performance cannot be ignored.
Since this experimental project is a joint research project, the experimental configuration of each participating research institution varies. In order to ensure that the results of this experiment have universal comparability and to facilitate meta-data interpretation [Reference Zheng, Ahmed, Ubogu, Zhang and Khandelwal35], the results of this experiment have been standardised using the A3 results as the base value. LBO results at different air flow rates presented in Fig. 5 have been normalised against LBO readings of reference fuel A3. Using 0% as the dividing line, a negative value means that its LBO performance is better than A3, and vice versa. It can be clearly observed that C9 fuel gave the best performance and C1 fuel gave the worst performance as compared to A3. This means that, in all air mass flow operating conditions, most alternative fuels showed worse blowout resistance as compared to existing fuels. At the same time, it also indicates that when alternative fuels are used as drop-in fuel, a large amount of theoretical and experimental data is required as a guiding basis to specify strict safety indicators to ensure the safety performance of the engine’s stable combustion.

Figure 5. LBO performance at three air flow conditions normalised against A3.
3.2. Fuel property impact on LBO performance
Regarding the impact of fuel characteristics on LBO, preliminary research data obtained by the four research institutions participating in the NJFCP project shows that fuel evaporation, mixing within the combustor, and chemical reactivity are the three most important factors [Reference Peiffer, Heyne and Colket38], and this relationship is shown in Equation (1).
 \begin{equation}\phi \left( {LBO} \right){\rm{\sim }}{\left( {{1 \over {{\tau _{chem}}}} + {1 \over {{\tau _{eva}}}} + {1 \over {{\tau _{mix}}}}} \right)^{ - 1}}\end{equation}
The chemical coefficient ( ${\tau _{chem}}$
) describes the fuel burning reaction at a given temperature, pressure and local fuel/air ratio. The coefficient for evaporation (
${\tau _{chem}}$
) describes the fuel burning reaction at a given temperature, pressure and local fuel/air ratio. The coefficient for evaporation ( ${\tau _{evap}}$
) is related to the fuel properties of viscosity, density and surface tension and thus fuel temperature. The mixing coefficient
${\tau _{evap}}$
) is related to the fuel properties of viscosity, density and surface tension and thus fuel temperature. The mixing coefficient ${\tau _{mix}}$
is the function of combustor geometry and relative convective velocities. Through this formula, it can be observed that there is a linear relationship between LBO and a single factor. For this reason, the linear correlation statistical method was used in following analysis.
${\tau _{mix}}$
is the function of combustor geometry and relative convective velocities. Through this formula, it can be observed that there is a linear relationship between LBO and a single factor. For this reason, the linear correlation statistical method was used in following analysis.
Taking the combustion state where the mass flow rate is 0.2kg/s as an example, the linear regression algorithm of fuel properties and LBO performance was used to determine their correlation. The LBO results for all the fuels have been normalised against the data of A3 ( ${\phi _{fuel}}/{\phi _{A3}}$
), which are shown in the y-axis direction. Since each fuel property has its own unit and order of magnitude, the resulting linear trend line gradient (k) does not have the direct comparability. Therefore, it is necessary to standardise all the characteristic values, in order to limit them to the range of 0–1, where 0 is the minimum value of the same characteristic, 1 is the maximum value, and the rest are distributed in proportions between 0-1. The calculation method is shown in Equation (2).
${\phi _{fuel}}/{\phi _{A3}}$
), which are shown in the y-axis direction. Since each fuel property has its own unit and order of magnitude, the resulting linear trend line gradient (k) does not have the direct comparability. Therefore, it is necessary to standardise all the characteristic values, in order to limit them to the range of 0–1, where 0 is the minimum value of the same characteristic, 1 is the maximum value, and the rest are distributed in proportions between 0-1. The calculation method is shown in Equation (2).
 \begin{equation}{x_{{\rm{standardize}}\;}} = {{x - {x_{min}}} \over {{x_{max}} - {x_{min}}}}\end{equation}
Using the calibrated LBO value with the normalised fuel characteristic value ( ${\phi _{fuel}}/{\phi _{A3}}$
), scatters diagrams for each fuel metric can be made. The normalised fuel property values represented by Equation (2) are plotted along the x-axis direction. The scatter diagram for each fuel property and normalised LBO performance at the three air flow velocity conditions (0.2kg/s in blue circle symbol, 0.26kg/s in orange cross symbol and 0.32kg/s in green triangle symbol) are shown in Fig. 6. A trend line is added to the scatter chart to show slope (k) and coefficient of determination (
${\phi _{fuel}}/{\phi _{A3}}$
), scatters diagrams for each fuel metric can be made. The normalised fuel property values represented by Equation (2) are plotted along the x-axis direction. The scatter diagram for each fuel property and normalised LBO performance at the three air flow velocity conditions (0.2kg/s in blue circle symbol, 0.26kg/s in orange cross symbol and 0.32kg/s in green triangle symbol) are shown in Fig. 6. A trend line is added to the scatter chart to show slope (k) and coefficient of determination ( ${R^2}$
). In each diagram, the gradient of linear trend “k” indicates the influence trend of particular fuel property on the LBO. The downward trend line (k < 0) means that as the value of this characteristic increases, LBO occurs at a lower fuel/air ratio (improved LBO) and vice versa for upward trend line (k > 0). The trend line in each state is also in each plot and distinguished by different colors. The
${R^2}$
). In each diagram, the gradient of linear trend “k” indicates the influence trend of particular fuel property on the LBO. The downward trend line (k < 0) means that as the value of this characteristic increases, LBO occurs at a lower fuel/air ratio (improved LBO) and vice versa for upward trend line (k > 0). The trend line in each state is also in each plot and distinguished by different colors. The ${R^2}$
value represents the extent to which the established model can explain the proportion of variance of each variable within the sample data. The larger the value, the stronger the model’s ability to explain the sample data, and the better the model fits. To facilitate subsequent analysis based on these statistics, the values of k and
${R^2}$
value represents the extent to which the established model can explain the proportion of variance of each variable within the sample data. The larger the value, the stronger the model’s ability to explain the sample data, and the better the model fits. To facilitate subsequent analysis based on these statistics, the values of k and ${R^2}$
for each variable is shown in Table 4.
${R^2}$
for each variable is shown in Table 4.
Table 4. The data results of k and ${R^2}$
for linear correlation model
${R^2}$
for linear correlation model


Figure 6. Linear relationship between fuels characteristics and LBO performance.
From an overall point of view, the relationship between most fuel characteristics and its LBO performance is not statistically significant, as only the value R 2 for smoke point and DCN exceeds 0.6. This shows that most fuel characteristics when taken in isolation do not directly determine changes in LBO performance. There is interesting phenomenon observed previously that remains following normalisation. The yellow trend line representing 0.26kg/s is at the lowest position in each graph. That is because the value of the ordinate is presented in the form of ratio after normalisation of the A3 data, as previously discussed for the raw data in Fig. 5.
Regarding the degree of influence of each fuel property on performance, in addition to the growth rate, the degree of dispersion should also be taken into consideration. Even if it has a large k value is observed for a given variable, if the degree of data dispersion is very high (low R 2), this means that the reliability of its k value is low. Therefore, when measuring the importance, it is necessary to consider both growth rate (k) and coefficient of determination (R 2). These two factors have been integrated as effect index and expressed as shown in Equation (3). The effect index for each fuel variable at all the three conditions are plotted in Fig. 7.
 \begin{equation}Effect\ index = k \times R^2\end{equation}

Figure 7. Effect rank of fuel properties on the LBO performance based on the linear correlation model.
Following the normalisation technique applied using Equation (2), there are positive and negative values, the sign of which precedes the k value. When the effect index is negative, it means that as the value of the variable increases, the performance of LBO will be improved. When it is positive, the opposite is true. It can be observed from Fig. 7 that among all the considered fuel properties, DCN exerts the most significant impact on the LBO value. This is consistent with the conclusion obtained by most institutions participating in the NJFCP project using the random forest regression method [Reference Peiffer, Heyne and Colket38]. It is also worth noting that as the air flow increases, the role of DCN becomes more significant as indicated by the comparatively larger magnitude of the k value at the 0.32 vs 0.2kg/s and 0.26kg/s (−0.184 vs −0.124 and −0.135, respectively). This may be due to the fact that as the amount of intake air increases, the temperature in the combustion chamber decreases and the probability of leaner local equivalence ratio increases. Under these conditions, the fuel’s autoignition propensity plays an important in sustaining stable, steady state combustion. In other words, fuel characteristics related to ignition parameters play an important role in LBO performance. This observation agrees with the findings of Won et al. [Reference Won, Rock, Lim, Nates, Carpenter, Emerson, Lieuwen, Edwards and Dryer23].
The second most important feature, according to the effect index, is the smoke point, which is also one of the main indicators for evaluating aviation fuels’ propensity to produce carbonaceous particulate matter emissions. The higher the smoke point value, the lower the tendency of combustion to generate carbonaceous nvPM, and such fuel is generally observed as burning ‘cleaner’ than a fuel with a low smoke point. Therefore, in order to reduce the propensity of aviation fuel to generate carbonaceous nvPM, aviation fuel product specification standards strictly limit the smoke point value. However, the results of this experiment indicate that a high smoke point will have a negative impact on the performance of LBO, as shown in the corresponding variable in Fig. 7. Therefore, in terms of potential optimisation, it is challenging to obtain lower particulate matter emission performance and improved LBO performance at the same time by adjusting the value of the smoke point. The selection of potential optimised blends must adopt to these conflicting behaviours. Fuel composition could be changed to gain the desired performance, and a balanced position must be taken based on the objectives of the application in question. Studies in the literature show a general trend of smoke point decrease with an increase of aromatics and cycloalkanes content. Studies in the literature also show that the value of smoke point is significantly influenced by the content of mono, cyclo and polycyclic hydrocarbons, although this is a significant field of interest as to what property of aromatic content determines this behaviour [Reference Menon, Eggenspeiler and Porumbel9]. As the content of these two molecules increases, the smoke point decreases. This may also be the reason why the effect value of the proportion of C-paraffins is in the fourth place and potentially improves LBO, opposite to the influence of smoke point. In other words, high aromatics and high C-paraffins content have potential benefits for LBO performance. This can be observed from the Fig. 6, which shows a decreasing LBO trend with increased aromatic content. This is possibly due to the fact that the molecular structure of aromatics and C-paraffin are relatively stable, and it takes longer to burn, causing a certain delay in flameout. The longer burning time helps to ignite subsequent droplets, thus sustaining combustion and improving the performance of LBO. The same theory can also explain why an increase in I-paraffin content (fifth importance by effect value) is detrimental to LBO. The molecules of I-paraffin are easier to decompose during combustion, so that the combustion time is shortened, and steady state combustion is more difficult to sustain as a consequence.
Another key point of discussion is the physical property of fuel such as surface tension, which is the third most important property controlling LBO according to the effect value. Surface tension is an important factor that impacts the degree of atomisation. A fuel with a larger surface tension value will cause poor atomisation, making the droplet particles larger and more difficult to fully react with oxygen. From an LBO point of view, the greater the surface tension, the larger the droplet particles, and they could be better resist being blown out, with-in certain limits of surface tension. This phenomenon is also consistent with the experimental results observed by Grohmann et al. [Reference Grohmann, Rauch, Kathrotia, Meier and Aigner22]. As the macromolecular structure of the fuel analysed previously increases reaction rates and sustains combustion, so too do the longer times to atomise and combust larger droplets, which helps the subsequent ignition of additional droplets. However, we have also observed that with an increase of air intake, the value of surface tension has decreasing influence on the improvement of the LBO value. This is potentially due to the increase in air intake, which promotes the degree of secondary atomisation of droplets, weakening the effect of surface tension, and reduces the ability to resist blowout.
For other fuel properties (net heat combustion, aromatic content, density, hydrogen content, etc.) evaluated in this experiment, there is almost no direct linear influence on the LBO value, so limited conclusions can be drawn, if any, from the effect of altering these variables. But through the above analysis, we can observe that there are several key variables that are the dominant factors in the performance of LBO, namely DCN, smoke point and surface tension. From the above analysis, it appears that both the chemical properties (DCN) and the physical properties (smoke point) are dominant factors impacting the performance of the LBO. But the physical property of fuel’s surface tension is also directly caused by the chemical molecular composition. The ignition propensity (DCN) could be due to concentration of the CH2 chemical functional group [Reference Won, Haas, Dooley, Edwards and Dryer39]. Therefore, this study predicts that at low temperature and low pressure, the chemical characteristics of the fuel play a decisive factor, and as the air supply in the combustion chamber increases, its decisiveness becomes more obvious.
DCN is used as an indicator to measure ignition performance and does not have a negative impact on emissions. The results above provide the opportunity to further optimise the LBO limit by changing the fuel properties by increasing its DCN. Therefore, there is potential to improve the DCN value of a given fuel and to measure to what extent the LBO could be optimised. These questions will be explored in the next section.
3.3. Cetane additive effect
There are several ways to adjust the DCN of a given fuel. One approach is to blend high DCN fuel and low DCN fuel, but this will inevitably cause a wide range of changes in other chemical and physical properties, most likely deleteriously. Another approach is to use a cetane additive that can potentially improve a given fuels DCN without significantly impacting any other fuel properties. For this work, a DCN additive was used as a means of potentially augmenting fuels DCN values for selected fuels in this experiment. The value of the DCN was systematically changed by addition of Di-tert-butyl peroxide (DTBP). Di-tert-butyl peroxide (DTBP)—(CH3)3COOC(CH3)3 is an DCN improver commonly used in diesel due to its low impact on fuel properties. The specific chemical reaction principle of this catalyst can be found here [Reference Daeyup, Shinichi, Hidekazu, Yoshitaka and Makihiko40]. This particular compound has not been approved for use in jet fuel to date. DTBP was chosen as compared to other potential cetane additives such as 2-ethylhexyl nitrate due to the fact that it is made up of completely organic molecule. This was important as the potential presence of nitrogen found in other cetane additives, if used, may have contributed to fuel bound NOx in other aspects of the experimental campaign outside of the scope of this work.
LBO experiments were conducted by mixing two selected fuels with different proportions of DTBP between 0% and 1% by volume. According to the research of Braun-Unkhoff [Reference Braun-Unkhoff, Kathrotia, Rauch and Riedel41], the contents of n-paraffins and i-paraffins are the dominant factors determining the DCN value. Hence, 100% n-paraffin fuel (C1) and over 99% i-paraffin fuel (Banner solvent, NP1014) were selected as the base fuels for adding the DTBP DCN additive.
The DCNs of C1 fuel was determined by ignition quality testing (IQT) analysis conducted at Southwest Research Institute USA using ASTM D6890. For evaluating the impact of DTBP addition on the DCN values of fuels, ASTM D6890 standard was used for DCN measurement at a testing laboratory named Intertek in the UK. In addition, the NJFCP fuels used previously in this study were also sent to the same facility for verification testing to ensure that all the DCN values are measured at the same location. The results showed that the difference is within a reasonable range of 3%, therefore, the DCN data measured by the commissioning agency is considered within acceptable bounds.
The value of the DCN obtained by addition of the additive to two different base fuels is shown in Fig. 8. Different fuel compositions gave different DCN responses to the additive. This is probably due to the fact that DTBP, as a strong oxide, can stimulate different levels of active free radicals when reacting with different molecules in different fuels. For both fuels, there exists a trend of weakly non-linear growth. With an increasing additive proportion, the corresponding growth trend of the DCN slightly decreases. The DCN value of the C1 fuel slowly increases from 16.1 to 23.42 with the addition of up to 1.0% of DTBP by volume. In contrast, the DCN response of the i-paraffin fuel is significantly higher to the additive content. For the Banner solvent fuel, the DCN increases by 26.7 and reaches the value of nearly 100 after the addition of only 0.35% volume of DTBP.

Figure 8. Value of the DCN in response to fuel blending with DTBP.
In addition to the above laboratory blended fuels, three more cetane changed fuels provided under NJFCP program were used in this study. The production method is confidential, but the main properties of the fuels are listed in Table 3. Fuels 31-FP, 44-FP, and 54-FP are named after their respective DCN values, as the values of the DCN for each fuel are 31, 44 and 54, respectively. The fuels have been processed in way that their properties, including density, smoke point, and net heat of combustion have similar values. The main difference is between them is their respective proportion of i-paraffins, n-paraffins and aromatics. The values of the ratio of i-paraffins to n-paraffins and their corresponding DCN show a linear relationship with a high coefficient of determination (R2 = 0.98), as shown in Fig. 9. This indicates that a higher ratio of branched alkanes compared to straight chained alkanes results in a high DCN. Braun-Unkhoff et al. [Reference Braun-Unkhoff, Riedel and Wahl42] previously proposed the hypothesis that the DCN is directly affected by the content ratio of i-paraffins and n-paraffins thereby affecting a given fuels’ capacity to resist blowout.

Figure 9. Relationship between the ratio of i-paraffins/n-paraffins and DCN for certain NJFCP fuels.
Combining the previous LBO data of the fuels tested in Section 3.2 of this work with the cetane additive blends (BannerSol and C1 blends) from Section 3.3 and the NJFCP FP fuels, the LBO results were integrated into one graph to investigate the impact of DCN on lean blow off. The Banner Solvent based DCN changed fuels are denoted as BS blends in Fig. 10, while DCN changed C1 are denoted as C1 blends. FP fuel group are the DCN specific formulated fuels according to the NJFCP program with more details given in Table 5. The data of k and ${R^2}$
for each fuel and the degree of response to DCN is show in Table 6.
${R^2}$
for each fuel and the degree of response to DCN is show in Table 6.

Figure 10. LBO fuel/air ratio results for all tested fuels with different DCN.
Table 5. The main properties of the NJFCP program DCN changed fuels

Table 6. The degree of response of different fuels to the DCN value

It can be clearly observed that all the different blends tested in this study shows varying degrees of improvement in LBO performance with increased DCN. The FP fuel has the highest slope (k) and Correlation Coefficients (R2) among all the fuels, and there is almost no linear dispersion. According to this sub-group, DCN almost completely independently describes the ability of fuel to resist blowout once significant variables such as density and net heat of combustion have been standardised, irrespective of the group type molecular composition of that fuel. However, as dataset is only for three fuels, it may be premature to generalise that the improvement in the blowout resistance capacity of this group of fuels is the solely due to the influence of DCN alone.
The LBO behaviour of the C1 group potentially shows a similar pattern to the behaviour of FP group fuels. For the C1 fuel group, its correlation and coefficient of determination are the weakest of all fuel groups, including in comparison to the blends previously tested in this work. By considering the lack of n-paraffinic content in C1 fuels, this behaviour is consistent with trends observed and discussed previously. First of all, it can be seen during fuel preparation that the DCN values for C1 do not increases significantly with increasing proportions of the additive. Additionally, after analysing Fig. 9, we know that the increase in DCN value is potentially determined by the ratio of I-paraffins and N-paraffins, with an increased proportion of I-paraffins suggesting a higher DCN. C1, however, is composed of 100% vol/vol of highly branched I-paraffins. From this analysis, there are two possibilities. One is that it is difficult to effectively convert N-paraffins and I-paraffins through a limited amount of catalyst. Second, when the N-paraffins content in the fuel is large, the base number of the denominator is too large, and the ratio change is not obvious. Regardless of the reason, the hypothesis of this work is that it may be impossible to significantly improve and effectively optimise the DCN value and subsequent LBO performance of a given fuel with high I-paraffin content using cetane improving additives alone.
As the control group bs fuel (100% I-paraffins), its LBO performance is second only to FP fuel in response to DCN and far better than pre-tested fuel. It can be considered that the catalyst has successfully optimised the ability of LBO to prevent blow-out. This may be due to the molecular structure of I-paraffins, it is easier to separate the CH* group into N-paraffins under the strong oxidising action of the catalyst. Or because the N-paraffins base is small, it is easier to increase the ratio. The speculation here are only drawn from the appearance seen in the current experiment, and the specific real reason needs to be obtained through a deeper chemical mechanism analysis.
4.0 Conclusion
This study investigated the impact of different physical and chemical properties of alternative aviation fuels on the LBO limit and phenomenon using a Rolls-Royce single-can Tay combustor. A total of ten different alternative fuels and 25 DCN changed fuel blends were tested in this study. This study provides effective data and results to facilitate future fuel optimisation and reduce the risk of a negative performance of new fuels in gas turbines.
DCN and smoke point play a critical role in increasing the LBO limit. As the air flow increases, the role of DCN becomes more significant. This is believed that, with increase of air flow, flame extinction stretch rate is larger, fuel characteristics related to ignition parameters play a more important role in LBO performance.
Since the burning time of large molecules (high content of C-paraffins and Aromatics) and large droplets (high surface tension) is long, it provides a guarantee for subsequent ignition of coming droplets and temperature maintenance of the combustion chamber, so it is helpful to prevent blowing out
At low temperature and low pressure, the chemical characteristics of the fuel play a decisive factor, and as the air supply in the combustion chamber increases, its decisiveness becomes more obvious.
DCN improver DTBP often used in petroleum is not effective for improving LBO performance of all fuels. It has a significant effect on fuels with high I-paraffins content, but it is almost ineffective for fuels with high N-paraffins content.
The FP fuels (DCN controlled by an unknown method) provided by NJCP has a linear correlation between LBO and DCN value almost 100%. But since their other important characteristics have also changed, it is not easy to draw this conclusion.
Acknowledgement
This work has been supported by University of Sheffield’s Low Carbon Combustion Centre. Some of the fuels for this work were funded by the US FAA Office of Environment and Energy as a part of the NJFCP Program. Any opinions, findings, and conclusions or recommendations, expressed in this material are those of the authors and do not necessarily reflect the views of the FAA, or other NJFCP and CLEEN sponsors.


 Open access