

I. INTRODUCTION
Wireless power transfer (WPT) is used in various biomedical applications to power telemetric devices and implants. It can be used to supply power to implanted telemetric devices for indefinite periods, without the need for batteries, battery replacement surgery, or transcutaneous wiring. There are many designs of WPT systems that have been proposed, where power requirements for implantable devices vary with the application and can range from a few milliwatts to dozens of milliwatts [Reference Baker and Sarpeshkar1–Reference Kalialakis and Georgiadis3].
Reliable measurement of system performance is needed for designing and testing WPT systems. This requires the use of a measurement system to collect real-time performance data from the implant (secondary coil circuit) in a way that does not interfere with the device performance.
Our work involves a telemetric device called the rodent implant device (RID) for a freely moving small rodent. It is suitable for subcutaneous implantation in a rat, and is suitable as a head-mounted device for a mouse. Figure 1 illustrates the concept for telemetry acquisition, where the RID is located on the head of a freely moving rodent within a small housing cage, around which the primary coil is wrapped.

Fig. 1. Small rodent WPT concept, with primary coil wrapped around a small mouse housing cage sized 300 × 190 × 120 mm3 (length × width × height).
A characteristic of WPT applications for rodent telemetry acquisition is the loose coupling between the primary and secondary coils, providing low levels of power transfer [Reference Badr, Somogyi-Gsizmazia, Delaney and Dechev2]. Our work involves such loosely coupled WPT (LCWPT) where we employ a large primary coil to transmit power to a much smaller secondary coil (implant) that is in motion. To compensate for loose coupling, the use of resonant circuit systems is employed to create boosted voltage/current levels at the secondary coil, even in the presence of low coupling coefficients [Reference Badr, Somogyi-Gsizmazia, Delaney and Dechev2, Reference Costanzo, Dionigi, Mastri, Mongiardo, Russer and Russer4].
In order to characterize LCWPT systems, some key performance parameters need to be accurately measured/obtained at the secondary circuit. These include the induced voltage, the received power, and the overall efficiency of the LCWPT system. Presently, measuring the performance of the secondary side of LCWPT systems while they are in operation can be problematic when using voltage/current probes, or coaxial cables placed directly into the primary magnetic field. A number of researchers have measured the induced voltage, the received power, or the efficiency of WPT systems with various schemes using coaxial cables, twisted-pair cables, or oscilloscope voltage/current probes. Jow et al. used a digital oscilloscope (MSO4034B, Tektronix) to measure the peak-to-peak voltage across the LC-tank that was connected to a 500 Ω resistor load, in their secondary circuit. To do this, they placed a voltage probe within the primary coil's electromagnetic field, to measure the induced voltage in the secondary LC-tank circuit, and they calculated the received power [Reference Jow and Ghovanloo5]. Pinuela et al. initially measured the induced current of their secondary using an Agilent N2783A current probe. However, they noted that the results did not reflect the true of operation of their WPT, as current probes are not capable of measuring the induced current precisely in the presence of significant electromagnetic noise. Also, they could not measure the induced voltage (V ind ) using a voltage probe across the load, because the capacitance of the probe can detune the resonance of the receiver circuit. Therefore, they measured the efficiency of their WPT system using a thermal measurement scheme. This was done by measuring the temperature of the heat sink of the receiver coil, and the temperature of their metal film resistor load, by calculating the applied DC input power to their WPT system [Reference Pinuela, Yates, Lucyszyn and Mitcheson6]. Russell et al. placed the resistor load of their secondary outside the primary field of their WPT system, and connected that load to the secondary coil via twisted-pair wires. They measured the DC voltage across the resistor load using a NI card (PCI-6025E) interfaced with LabVIEW [Reference Russel, McCormick, Taberner, Lim and Malpas7]. Zhao et al built a LCWPT system for an epiretinal prosthesis application. They measured the induced voltage by connecting a voltage probe and a ground probe across the resistor load of the secondary circuit, all of which were within the primary coil's electromagnetic field. These probes were part of a single coaxial cable, which was connected to an oscilloscope [Reference Zhao, Nandra, Yu and Tai8]. Xu et al. built a WPT system for rodent (rat) applications, where their WPT system was based on four coils: driver coil, transmitter coil, receiver coil (secondary coil), and load coil (application load). Their load coil is intended for implantation subcutaneously within the dorsal region of a rat. They likely used a coaxial cable to connect their load coil to an oscilloscope, to measure the peak-to-peak induced voltage of the load coil [Reference Xu, Wang, Gao, Mao, He and Sun9, Reference Xu, Gao, Wang, He, Mao and Sun10]. Dionigi et al. presented a secondary resonator based on a coaxial cable, which is suitable for WPT applications [Reference Dionigi and Mongiardo11, Reference Dionigi and Mongiardo12]. His work indicates that coaxial cables can affect the magnetic resonance of WPT systems.
In this work, we designed, constructed, and tested the wireless measurement system (WMS) to avoid potential measurement errors inherent with coaxial cables, twisted-pair cables, or oscilloscope probes within the primary field. The WMS is connected across the secondary load, R L of the RID to measure the induced voltage received, as shown in Fig. 3 for our LCWPT system.
This paper is organized as follows. Section I shows the research motivation for the WMS system, and other measurement systems. Section II illustrates the methodology of this work. Section III describes WPT theory. Section IV shows the WMS design for WPT system. The experimental setup is described in Section V. The experimental results are reported in Section VI. A discussion of the results is provided in Section VII. Finally, the conclusion is in Section VIII.
II. DESIGN METHODOLOGY
There are a few possible ways to measure the power transfer of LCWPT systems. These include: (i) using current probes to measure the current passing through the secondary load, R L , while it is within the primary electromagnetic field. (ii) Using voltage probes to measure the voltage across the secondary load, R L , while it is within the primary field. (iii) Placing the secondary load, R L , outside the primary field and connecting it to the secondary coil via coaxial cable or twisted-pair wires. Then, measuring the current/voltage of the load R L with oscilloscope probes.
In regards to approach (i) or (ii), Pinuela et al. found that a probe's capacitance of 15 pF was enough to detune the secondary coil from resonance. They also concluded that current probes were not capable of measuring the current accurately in the presence of significant electromagnetic fields [Reference Pinuela, Yates, Lucyszyn and Mitcheson6] due to noise. Hence, oscilloscope probes should not be used inside the primary field electromagnetic zone.
In regards to approach (iii), coaxial cables or twisted-pair cables can be used to spatially move the load R L farther away from the primary field, allowing measurement of the voltage across the load, or the current through the load, as Russell did in [Reference Russel, McCormick, Taberner, Lim and Malpas7]. However, twisted/coaxial cables add an impedance to the secondary circuit. For example, coaxial cable has an impedance of 50 or 75 Ω depending on connector type. This impedance increase may cause impedance mismatch, leading to reflected power loss in the secondary coil.
The purpose of this work is to measure the power transfer of LCWPT systems precisely using a cable-free (wireless) approach. By avoiding the use of coaxial cables, twisted-pair wires and current/voltage probes, we are able to avoid the problems described above. The design of the WMS is explained in Section IV.
We used the WMS to measure the received power using two different experimental telemetric devices: (1) a secondary coil called the air core, which consists of a simple coil wrapped around a small printed circuit board (PCB) [Reference Badr, Somogyi-Gsizmazia, Delaney and Dechev2]. (2) A variation of the air core employing ferrite rods, where four ferrite rods are placed at the corners of the PCB within the secondary coil. This configuration is denoted as the four medium ferrites (4MF). We designed and built it to improve the coupling, as explained in [Reference Badr, Somogyi-Gsizmazia, Delaney and Dechev2].
III. WPT THEORY
Electromagnetic inductive power transfer systems operate on the principle of changing magnetic fields to create alternating currents through a primary coil that induces a voltage onto a secondary coil. By Faraday's law, the resulting induced voltage (V ind ) at the secondary coil when it is parallel to the primary coil, is given as [Reference Badr, Somogyi-Gsizmazia, Delaney and Dechev2, Reference Yates, Holmes and Burdett13]:
 $$V_{ind} = \; - \displaystyle{{N_PN_S\mu _0\mu _rA_Sa_P^2} \over {2{(\sqrt {a_P^2 + \; r^2} )}^3}} \cdot jwI_P,$$
where I P is the current applied to the primary coil, N P is the number of primary turns, a P is the primary coil radius, N S is the number of secondary turns, A S is the loop area of the secondary coil, μ 0 is the permeability of free space, w is the angular frequency, μ r is the relative permeability of a specific medium, and r is the transmission distance, where r is calculated as λ/2π, where λ is the electromagnetic wavelength.
The coupling coefficient is defined as a dimensionless value that characterizes the relation between two coils (primary and secondary). For LCWPT biomedical telemetry devices, this coefficient is between 0.1 and 10%, and may vary due to coil-to-coil separation distance, coil-to-coil diameter ratio, coil-to-coil angular orientation, and other factors [Reference Badr, Somogyi-Gsizmazia, Delaney and Dechev2, Reference Abdolkhani and Hu14–Reference Badr, Somogyi-Csizmazia, Delaney and Dechev16]. The low coupling coefficient of many LCWPT systems leads to poor power transfer. Therefore, nearly all WPT systems use magnetic resonant coupling between the primary and secondary coils, to increase the efficiency [Reference Xu, Wang, Gao, Mao, He and Sun9]. Tesla first proposed the magnetic resonant technique [Reference Tesla17]. In our work, we measure overall efficiency as: (received power on the RID/DC power supplied to the primary circuit) [Reference Badr, Somogyi-Gsizmazia, Delaney and Dechev2].
There are four topologies for achieving magnetic resonant coupling between the primary and secondary coils. The topologies are SS, SP, PP, and PS for WPT systems, where the first S or P stands for series or parallel compensation of the primary winding, and the second S or P stands for series or parallel compensation of the secondary winding. In this work, the PP topology is used, as shown in Fig. 2.

Fig. 2. PP topology of primary and secondary coils.
At magnetic resonance, the reactive components cancel and the impedance is simply the real component, which is the resistive loss of the secondary tank. To achieve maximum power transfer to the load, it is recommended to use the optimum load resistance (R L ), as explained in detail in [Reference Badr, Somogyi-Gsizmazia, Delaney and Dechev2]. The maximum transferred power via the inductive link is defined as [Reference Fotopoulou and Flynn18, Reference Moura, Carvalho and Pinho19]:
 $$P_o = \; \displaystyle{{V_{ind}^2} \over {R_L}}.$$
IV. WMS DESIGN FOR WPT SYSTEMS
The main motivation for the WMS is to measure the power transfer of our LCWPT system. Given this goal, a set of design requirements for the WMS are established, and summarized in Table 1.
Table 1. Design requirements for the WMS.

Several design iterations were undertaken to create the WMS, to meet the design requirements and to achieve a robust measuring system. A high-level diagram of the WMS connected to the RID is provided in Fig. 3. The requirement to minimize volume keeps the WMS compact and lightweight. It also minimizes physical interference when connected to the RID, and allows for easy placement and orientation within the primary coil. Ideally, the WMS should not disturb the primary magnetic field, and should not have a significant effect on the system coupling. As noted in the methodology, a wireless (radio link) communication system has been designed into the WMS to transmit the measured data to an external base-station that records it. The WMS has an on-board microcontroller, a radio, and other electronics requiring power, which is supplied by a battery. This is needed since the WMS must operate independently of the WPT system, which it measures.

Fig. 3. High-level diagram of the WMS configuration.
Several detailed design notes are provided here regarding the physical construction of the WMS: (i) we used the Nordic nRF24LE1-F16Q24 system on-a-chip (SOC) with embedded microcontroller and radio, since it is a low-power design suitable for RF applications [20]. (ii) The WMS was designed as a four layers PCB that includes power (VCC) and ground planes in the middle, and two routing planes (top and bottom), for best performance in RF applications [21]. (iii) We used surface-mount devices (SMD) of size 0201/0402, since these sizes improve the RF performance and have good thermal properties [22, Reference Kim, Ryu and Han23]. (iv) We built a customized impedance matching circuit network for the RF antenna (FR05-S1-N-0-110) [24], by following the schematic circuit diagram of the QFN24 as described in [20]. (v) We avoided use of nonlinear components (such as voltage regulators or zener diodes) in the measurement stream. These components may affect the resonant frequency of the secondary circuit, as mentioned in [Reference Vandevoorde and Puers25]. (vi) We used a lithium-polymer (non-metallic) battery to power the WMS, since it is small and its composition is minimally disruptive to the primary field, which avoids the problems described in point (v). We cannot use induced power from the RID to power the WMS, since that power is variable during development experiments.
The design of the measurement circuit on the WMS is described here. The WMS measures the voltage developed across R L on the RID, which represents the application load. The value of R L is pre-selected to ensure a good impedance match with the L S CS tank and rectifier of the RID.
The WMS employs a voltage divider when making measurements. This is needed since the voltage (V M ) measured by the microcontroller cannot exceed the internal reference value of the analog-to-digital converter (ADC). The reference value is set by an internal bandgap of the microcontroller (nRF24LE1), which is nominally 1.2 V [20]. The system was simulated with Multisim software (National Instruments) to configure the resistor and capacitor values. Figure 4 shows the Multisim model with voltage labels for the simulation results. The voltage source represents the induced voltage (V ind ) from the L S CS tank of the RID. The maximum received voltage within the L S CS tank of the air core configuration is 66 V (peak-to-peak), assuming a secondary load R L of 5 kΩ, and the parameter values as listed in Table 2 (smoothing capacitor, voltage divider and filter). The voltage points at V rec , VM , and V out of the WMS simulation are plotted in Fig. 5, where V rec is 31.5 V, and V out reaches value V M after 90 µs. By using equation (3) with the parameter values of the voltage divider and the filter, V M is found to be 0.608 V, which corresponds to Fig. 5.

Fig. 4. Multisim model of the RID connected to the WMS.

Fig. 5. Voltage traces of the WMS simulation.
Table 2. Final design parameters for the WMS.

The measured voltage (V M ) is digitized using a 12-bit setting on the ADC relative to the internal reference value of 1.2 V. With values of the voltage divider resistors R 1 & R 2 as shown in Table 2, the WMS is able to measure DC (V rec ) voltages up to 62.4 V. By changing voltage divider resistors R 1 & R 2, different measurement resolution and ranges are possible, as explained in equation (3). We can ignore the voltage drop over the filter (R 3 & C 2 ), as the resistance value of R 3 is small compared with R 2 , as shown in Table 2. We can back-calculate the rectified voltage (V rec ) over the resistor load R L as follows:
 $$V_M = \; V_{rec}\displaystyle{{R_2} \over {R_1 + R_2}},$$
 $$V_{rec} = V_M \times \displaystyle{{R_1 + R_2} \over {R_2}},$$
 $$V_{rec} = \displaystyle{{V_{A/D}} \over {2^{12} - 1}} \times V_{Ref} \times G,$$
where
 $$V_M = \displaystyle{{V_{A/D}} \over {4095}} \times V_{Ref};$$
G: Voltage divider factor (R 1 + R 2/R 2), it is 52;
V ref : Internal reference (1.2 V).
The WMS is based upon a SOC from Nordic Semiconductor (SOC model nRF24LE1). This SOC includes a 2.4 GHz RF transceiver, an 8-bit microcontroller, embedded Flash memory (16 kB), and a set of on-chip analog and digital peripherals [20]. The WMS circuit schematic was designed using Altium CAD software, where the values of the electronic components (R, L, and C) are provided in the diagram of Fig. 6.

Fig. 6. Schematic diagram of the WMS.
The radio communication protocol is built into the Nordic platform, and uses a proprietary handshaking network protocol to transfer voltage data (V M ) in digital format. The communication frequency between the WMS and the base station is 2.4 GHz. For this application data were sampled and transmitted at an effective rate of 29 Hz. The transmitted data/packets are displayed and saved using a custom graphic user interface. The transmission range of the Nordic RF system is approximately 6 m, which is adequate for this application.
The microcontroller chip on the WMS is programmed by initially compiling the bootloader program on a computer, and then downloading it to the chip using a USB-connected interface board. The bootloader program is subsequently used to wirelessly upload program code using the base station. We use Keil μVision4 as a program debugging software that compiles the code and generates its hex file. Then the generated hex file is uploaded onto the microcontroller chip wirelessly.
V. WMS EXPERIMENTAL SETUP
Our LCWPT system can be divided into two parts, namely the primary circuit and the secondary circuit, as illustrated in Fig. 7. The WMS design was tested with two different RID configurations (air core and 4MF). Magnetic resonant coupling is achieved by tuning the parameters of the primary and secondary circuits such that both resonate at the same frequency.

Fig. 7. Block diagram of LCWPT system with the WMS.
Power is supplied to the primary circuit using a DC power supply. A signal generator (Agilent 33250A) provides a driver signal to a Class-E power amplifier, which is used to generate sinusoidal current (I P ) in the primary coil (L P ). The alternating electromagnetic field in the primary coil induces a sinusoidal voltage (V ind ) in the secondary coil (L S ). The induced voltage is rectified within the RID into a DC voltage (V rec ) that provides power to the application load (R L ). The V rec is measured across the load R L using the WMS as explained in Section IV.
A switching inverter is used to supply the primary coil (L P ) with sinusoidal AC current. There are many designs for power amplifier inverter circuits, categorized in Classes C, D, and E. We used the Class-E amplifier design to drive our primary coil, since it is a common approach that is used extensively. Sokal et al. demonstrated the operational characteristics of their zero-voltage-switching inverter (ZVS) [Reference Sokal and Sokal26] using this approach. The Class-E is the preferred topology as it has high power efficiency, and it minimizes the stress on the switching element. The parallel capacitance normally present in a Class-E amplifier has been replaced here by a diode where the diode allows for suboptimum operation. The antiparallel diode in the MOSFET turns on when the voltage crosses zero voltage, before the oscillation waveform reaches its minimum. This regime is referred to as suboptimum operation [Reference Lenaerts and Puers27].
Our Class-E amplifier is configured as parallel resonance, where C 4 works in combination with C tank , to create a parallel primary resonant tank, as shown in Fig. 8. We vary C 4 to adjust the resonance of the primary circuit. The series capacitor (C 3 ) shields the MOSFET from the high voltage developed by the primary resonant tank [Reference Lenaerts and Puers27]. A pulse train (V G , duty cycle 0.5) is applied at the gate driver (MIC4421). The switch used is a MOSFET (STP16NK65Z) with high power handling and nanosecond switching capabilities [28, 29]. This MOSFET was also selected due to its relatively low output capacitance (C oss ) at high V DS [Reference Sokal and Sokal30]. It is important to note that C oss is effectively absorbed by C 4 [Reference Pinuela, Yates, Lucyszyn and Mitcheson6].

Fig. 8. Class-E amplifier (parallel resonance with C tank and L p ).
For increasing the WPT efficiency, tuning peak-to-peak voltage is just as important as switching at zero-voltage-zero-current. Identification of the ideal voltage and current waveforms that minimize switching losses, led to the design of Class-E ZVS power amplifiers by Sokal et al. [Reference Sokal and Sokal26, Reference Sokal and Sokal30, Reference Sokal31]. Our power amplifier is designed to deliver a maximum sinusoidal current (peak-to-peak) of up to 7 A through the primary coil. This can generate sinusoidal voltages (peak-to-peak) of up to 2.3 kV across the primary resonant tank.
The RID has an L S CS tank and a full bridge rectifier, as shown in Fig. 9, for both the air core and 4MF configurations. The rectification is an important part of the secondary coil in a WPT system, where it is vital to efficiently utilize the generated V ind [Reference Virili, Georgiadis, Collado, Niotaki, Mezzanotte, Roslli, Alimenti and Carvalho32]. High frequency rectifiers have two loss contributions associated with the diodes; losses due to forward conduction and a high frequency loss that can be attributed to the finite switching time of the diode. The switching losses occur as a consequence of the reverse recovery time of the diode. The forward conduction losses exist due to the forward voltage of the diode and the loss associated with its non-zero series resistance. Several rectifier topologies can be implemented for LCWPT (low power applications). The small diameter of the secondary coil (L S ) and the poor coupling coefficient, make it difficult in most applications to induce a high secondary voltage (V ind ). For this reason, full-bridge rectifiers with quad diodes designed for use in ultra-high-speed switching applications [33] are preferred to rectify the induced voltage (V ind ) [Reference Vandevoorde and Puers25].

Fig. 9. RID configurations; (a) air core, (b) 4MF.
To achieve high quality factors, inductors with low effective series resistance (ESR) are required for high frequency operation, due to the skin effect and proximity effect. To reduce the ESR, multistrand Litz wires are commonly used [Reference Yang, Liu and Basham15, Reference Badr, Somogyi-Csizmazia, Dechev and Delaney34]. For implant applications, the preferred frequency range of operation is from 100 kHz to 4 MHz, where minimal biological effects have been reported, in contrast to the extreme-low-frequency band and the microwave band [Reference Puers, Schuylenbergh, Catrysse and Hermans35]. In this work, the two RID configurations employ 48 AWG Litz wire. The number of turns used in the air core and 4MF configurations is 28 turns (7 turns per layer, 4 layers). The resonant frequency of each RID configuration is a function of its own L S CS tank properties and is not adjustable. The L S CS tank employs a fixed 235 pF capacitor (C s ) for all configurations. The coil parameters (Q and L s ) of each configuration are listed in Table 3, as measured using a HP 4285A LCR meter. A HP 4193A vector impedance meter is used to measure the resonant frequency and impedance of the L S CS tank of each RID, as listed in Table 4.
Table 3. Parameters of the secondary coil of the RID configurations.
Table 4. Measured resonant frequency and the impedance magnitude of RID configurations.
The impedance match within the RID must be appropriate to minimize internally reflected power loss between the L S CS tank and the secondary load R L . When considering this impedance match, the reactive part (capacitive component) of full-bridge impedance is considered part of the L S CS tank impedance [Reference Badr, Somogyi-Gsizmazia, Delaney and Dechev2].
The primary coil is wrapped around an animal cage sized 30 × 19 × 12 cm3 (length × width × height). To mimic various angular orientations of a rodent, four experimental fixtures were constructed to hold the RID at various orientations, which are 0°, 30°, 60°, and 90°. These angles are with respect to the x–y plane and the longitudinal axis of the primary coil, as shown in Fig. 1. Each fixture holds the RID at a 3 cm height above the base of the cage, and is located in the center of the cage. Figure 10 shows the experimental setup of the complete WPT system. The output voltage of the Class-E power amplifier is measured by a high voltage probe, and the primary current (I P ) is measured by a current probe (Agilent N2893A). The high voltage and current probes are connected to the oscilloscope. Prior to each WPT experiment, a calibration procedure is performed to ensure the magnetic resonant coupling is achieved between the primary and secondary circuits. This is done by verifying (re-measuring) the RID properties, and matching the resonant frequency of the system by tuning the primary circuits. The primary circuit is tuned by adjusting the signal generator frequency and adjusting the variable capacitor (C 4) in the Class-E power amplifier.

Fig. 10. WPT experimental setup.
Most of the system losses occur as heat at either the amplifier transistor (MOSFET) or the primary coil (L P ). A temperature increase at the primary coil (L P ) is not critical because it is a passive component and more resilient to heat [Reference Vandevoorde and Puers25]. A 12 V DC brushless fan is used to achieve an air flow for forced air cooling. In addition, the heat sink on the MOSFET further enhances the heat-dissipation capabilities. Figure 11 shows the top view of the Class-E power amplifier.
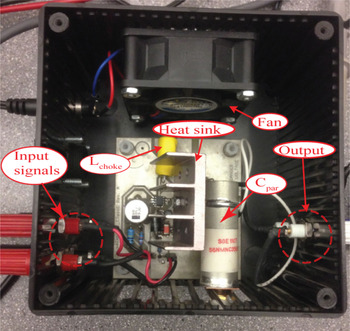
Fig. 11. Top view of the Class-E power amplifier.
The magnetic resonant properties of our LCWPT system were evaluated with and without the WMS attached. This was done by first measuring the resonant frequency of the RID L S CS tank, as listed in Table 4. The resonant frequency of 4MF was 2.057 MHz, when we measured the resonant frequency of the RID alone (without connecting the WMS). When we measured the resonant frequency of the RID with the WMS attached, we observed a resonant frequency 2.067 MHz with the 4MF configuration. This difference of frequency is only 10 kHz (0.5%), which shows that the WMS does not cause a large shift in the resonant properties for LCWPT systems.
VI. WMS EXPERIMENTAL RESULTS
The WMS was constructed and a set of experiments was conducted to test its performance. First, we examine the effect of measuring the rectified voltage (V rec ) across the secondary load (R L ) using the WMS, and compared it with measurements using a physically connected coaxial cable. The measurements using the coaxial cable were performed with one end of the cable connected to the output of the rectifier on the RID, and then running the remaining length of the coaxial cable outside the primary coil. The outside end of the coaxial cable was connected to the load resistor (R L ), where the rectified voltage (V rec ) was measured using the voltage probe (measured outside the primary coil since the R L resistor cannot reside on the RID if using direct cable-based probes). We varied the shape and orientation of the coaxial cable within the primary magnetic field using four shapes/orientations which were: straight cable (parallel to magnetic field), 45° titled cable (45° to magnetic field), S-shaped bent cable (in plane parallel to magnetic field), and circle-shaped bent cable (in plane parallel to magnetic field). Table 5 summarizes the measured voltage and the received power using both the WMS and the four coaxial cable configurations. All tests were done using the air core RID over 4 days, placed at the center of the cage, using a 2.5 A current (sinusoidal, peak-to-peak) applied to the primary coil. We observed that the measured value of the rectified voltage (V rec ) using the four shapes of the coaxial cable was not consistent from shape to shape, and also not consistent from day to day. The primary coil (cage), the power amplifier, the oscilloscope, current probe, the signal generator, and the base station remained in the same place each day. However, the secondary circuit (RID), the voltage probe, and the four shapes of the coaxial cable were set up at the beginning of the experiment each day, and taken down at the end of the experiment each day. The measured values from the WMS were very consistent from day to day. The measured values of V rec using the four shapes of the coaxial cable were higher than the values obtained using the WMS by 5–28%.
Table 5. Measured voltage V rec and received power P (mW) of air core using WMS and the four shapes of the coaxial cable.

Another type of experiment was conducted to demonstrate the performance of the WMS, and to compare the WMS to the coaxial cable. To do this, we measured the rectified voltage (V rec ) received by the RID, at 13 different locations within the cage field. In one case we used the S-shaped coaxial cable, and in the other case the WMS, to measure V rec . Figure 12 shows a map of these 13 points with their coordinates (x, y). This experiment used the 4MF configuration, a secondary load (R L ) of 10 kΩ, and 2.5 A (peak-to-peak) applied to the primary coil. Figure 13 shows contour plots of V rec measurements on two different days using both the WMS and the S-shaped coaxial cable. As before, the system was set up and taken down each day. Figures 13(a) and 13(b) show the consistency in the measurements using the WMS, based on the relative symmetry of the contour shape (about the horizontal and vertical) and the measurement magnitude (color and contour labels). Figures 13(c) and 13(d) show less consistent measurements using the S-shaped coaxial cable given less symmetrical shape, and less consistency from day to day. Table 6 lists the V rec measurements of the WMS and the S-shaped coaxial cable on Day 1 and Day 2. Two important observations can be made: The variation from day to day of the WMS measurements at similar points, is within 0.11–0.86%. However, the measurements from day to day of the S-shaped coaxial cable at similar points vary from 1.81 to 6.69%. The second observation concerns the expected values themselves. Notice that the 13 points are symmetrically distributed (horizontal and vertical) within the cage. According to theory and computer simulations in reference [Reference Badr, Somogyi-Gsizmazia, Delaney and Dechev2], the field intensity at points 1, 3, 5, and 7 should be the same. As well, the field intensity at points 9, 10, 12, and 13 should be the same. Looking at Table 6, for measured points 1, 3, 5, and 7, we can see the WMS values are within 0.90%, and for measured points 9, 10, 12, and 13 within 0.83% of each other. However, for the S-shaped cable, the measured values at points 1, 3, 5, and 7 are within 5.86%, and for points 9, 10, 12, and 13 are within 6.64%.

Fig. 12. Top view of the cage showing the locations of the 13 points.

Fig. 13. Contour plot of the V rec for the 13 points over 2 days; (a) Day 1 using the WMS, (b) Day 2 using the WMS, (c) Day 1 using the S-shaped coaxial cable and (d) Day 2 using the S-shaped coaxial cable.
Table 6. Values of voltage V rec of 4MF using the WMS and the S-shaped coaxial cable over 2 days.

An additional experiment was done to show the mobility advantage of using the WMS verses the coaxial cables. This experiment was conducted using the 4MF configuration, a secondary load (R L ) of 10 kΩ, and 1.0 A (peak-to-peak) applied to the primary coil. We attached the WMS to a long plastic rod, connected to a stepper motor outside the cage, where the WMS was at point 11 in the cage. The motor was spaced 15 cm away from the cage. We then measured V rec continuously from 0° to 360° (29 samples/s), to create the plot of V rec versus orientation, as shown in Fig. 14. In contrast, using a coaxial cable to obtain such measurements while moving through a range of angles, would be difficult, due to mechanical stiffness, as well as continuous changes to the field caused by the cable (similar to different cable shapes as listed in Table 5). This demonstrates the mobility and orientation advantages of the WMS when measuring V rec at any orientation with respect to the primary coil.

Fig. 14. Values of voltage V rec of 4MF during continuous rotation at the center of the cage, versus orientations. Note the RID receives slightly more power while inverted, since it is not centered on the rod and thus changes both its angle and vertical position within the field.
We also investigated our LCWPT behavior using different types of batteries to power the WMS. Since the WMS must provide reliable measurements over time, its power must be supplied independently (by a battery) to make its operation independent of the RID performance. We tested the use of AA, coin cell, and lithium-polymer batteries. The coin cell battery, or the lithium-polymer battery was placed in the field with the WMS. However, the AA battery was outside the cage, and connected to the WMS using twisted-pair wires. We found that the primary circuit draws more voltage and current from the DC supply when using the AA battery, or the coin cell battery, in comparison with the lithium-polymer battery. This is likely due to the metallic components of the AA or coin cell battery, which produce a load in the electromagnetic field. In addition, metallic objects near the field affect the inductance of the primary coil that leads to shifting of the operating point (resonant frequency) of the primary circuit [Reference Troyk and Schwan36]. The Class-E power amplifier compensates for the shift in resonant frequency, by drawing more DC current to maintain the sinusoidal current in the primary coil. The extra draw on the DC power supply was 0.1 A (1 V) using the coin cell batteries, and 0.3 A (2 V) using the AA batteries.
An additional note: the maximum power flows when the resistive load R L is conjugately matched to the L S CS tank circuit, as explained in [Reference Badr, Somogyi-Gsizmazia, Delaney and Dechev2]. Hence, our experimental measurements utilize a conjugately matched load (R L ) to ensure the maximum power transfer for the overall system. Each RID configuration has a different impedance magnitude (R LC ), as shown in Table 4. In order to determine the ideal resistor load (R L ) value for each RID, we tested resistor values of 1, 2.7, 5, 10, and 20 kΩ, to find the peak power transfer. For example, in the case of the air core, as shown in Fig. 15, we found that the R L value of 5 kΩ provided best power transfer. Similarly, in the case of the 4MF configuration, the R L value of 10 kΩ provided best power transfer. A Vector Impedance Meter was also used to verify the selected values.

Fig. 15. Power received in the air core configuration versus resistor loads for different currents applied to the primary coil. The RID was located at the center of the primary coil, in a horizontal (0°) orientation.
VII. LCWPT EXPERIMENT RESULTS
Experiments to measure power transfer performance of the RID (air core and 4MF configurations) were conducted with the WMS. In these LCWPT experiments, the RID was located only at the center (point 11) of the cage. The experiments varied three independent parameters: the RID orientation (0°, 30°, 60° and 90° with respect to the x–y plane of the primary coil), the matched impedance of the secondary circuit, and the current (I p ) applied to the primary coil (1, 1.5, 2, and 2.5 A peak-to-peak sinusoidal). The resulting induced voltage V rec in the RID was measured by the WMS.
A) Air core configuration
Figure 15 shows a plot of the power received by the air core configuration with different resistor loads, when the RID is located at the center of the primary coil, 3 cm above the cage floor, at a 0° orientation. The maximum power is found when using a matched load of 5 kΩ, where the maximum power is 58 mW with an applied primary coil current (I p ) of 2.5 A. Figure 16 shows the power received by the air core configuration with a matched load (5 kΩ) at 0°, 30°, 60°, and 90° orientations.

Fig. 16. Power received by the air core-based RID located at the center of the primary coil, with a 5 KΩ R L .
B) 4MF configuration
Figure 17 shows a plot of the power received by the 4MF configuration at the center of the primary coil. The 4MF configuration differs from the air core by the addition of four ferrite rods placed perpendicular to the PCB, as shown in Fig. 9 (b). The 4MF configuration required a R L value of 10 kΩ, to ensure impedance matching within the RID. Addition of the ferrites improves the received power, where the maximum received power is 86 mW at a 0° orientation with an applied primary coil current (I p ) of 2.5 A. The ferrites also help the RID to gather power when it is tilted. For example, at an angle of 30° with respect to the horizontal plane, the 4MF can receive approximately the same power as the air core configuration at 0°. The 4MF configuration receives 1 mW at the 90° orientation.

Fig. 17. Power received by the 4MF configuration at the center of the primary coil, with a 10 KΩ load R L .
VIII. DISCUSSION
The WMS collects performance data from the WPT system under test, and communicates the data wirelessly via radio link in real-time. The utility of the WMS is that it overcomes the problems that result when using directly connected coaxial cables or voltage/current probes to measure the secondary circuit. In our earlier work, we had measured the rectified voltage (V rec ) of the RID using various configurations of coaxial cables across the load (R L , located outside the primary field); however, those measurements were plagued by offset and noise problems, and produced inconsistent results. When the same length of coaxial cable was bent in different shapes (with all other parameters fixed) the V rec measurements varied by 5–27%, as shown in Table 5. This inspired the development of the WMS system presented in this paper. By using the WMS, the measurements of V rec at various orientations and positions of the RID are consistent to within 0.5% from day-to-day as shown in Tables 5 and 6, whereas those from the coaxial cables varied by up to 7% from day-to-day. Hence, measurements using the WMS are more consistent and precise in comparison with coaxial cables.
Note that the WMS is not able to measure the induced AC voltage of the L S CS tank circuit, because of a floating ground issue. This occurs since the measured voltage (V M ) over the voltage divider (Fig. 3) will be a floating signal with respect to the ADC of the microcontroller. The WMS was only designed to measure the rectified DC voltage (V rec ), as shown in Fig. 3.
When developing the WMS, we performed a rough check of the DC measurement accuracy. This was done by using a coaxial cable to measure the AC voltage directly across the L S CS tank, even though we acknowledge the problems of Section VI and Table 5. We used a 5 kΩ (R L ) resistor at the opposite end of the coaxial cable (located outside the primary cage) and measured the induced voltage across R L using a voltage probe connected to an oscilloscope. We found the induced AC voltage was 54.2 V (peak-to-peak) when driving the primary coil with (I P ) 2.5A (peak-to-peak). An AC value of 54.2 V corresponds to a rectified voltage, V rec , of 17.3 V DC, which approximately matches the measurements using the WMS, as shown in Table 5.
The power received by the RID is proportional to the square of the induced voltage (V ind ). Hence, the power transfer from primary to secondary of the WPT system can be increased by increasing the supply voltage (as long as the DC power supply is able to provide sufficient power, and V DS across the MOSFET stays below the breakdown voltage). Therefore, the received power values in Figs 15–17 are relative to the primary current, and are intended to simply show the trends in comparison with system variables. The measure of a good WPT system is demonstrated by overall system efficiency [Reference Badr, Somogyi-Gsizmazia, Delaney and Dechev2]. We observed that the matched impedance of the air core configuration differs from that of the 4MF configuration. This is due to the lower quality factor and coupling coefficient of the air core compared with the 4MF configuration.
The overall weight of the RID and the WMS is 4.8 g, while the RID alone is less than 2 g. The WMS is not intended to be mounted on the head of a freely moving mouse, rather, only the RID (with an application circuit) is intended for a mouse. No animals were used in this study, where we have instead used fixtures and a rotating motor to approximate some of the orientations that the RID would be in when attached to a freely moving mouse.
In general, the WMS system could also be used for performance measurement of various WPT systems. This could be done by modifying the configuration of the voltage dividers (R 1 and R 2) and by modifying R 3 and C 2 (filter), to allow the WMS to measure the induced DC voltage and the received power for any WPT application.
IX. CONCLUSION
This paper describes the design and testing of the WMS, which is designed to provide reliable measurements of LCWPT system performance during development of LCWPT systems. Our LCWPT system is used to transmit power to a telemetric recording device attached to a freely moving rodent. The WMS is battery powered, and transmits performance data by radio link, to avoid the measurement errors normally associated with cable-based measurement due to field interference, noise and offset. The WMS can measure rectified voltage (V rec ) values from 0 to 63 V, with 12-bit resolution, at 29 Hz, from the RID. Furthermore, the WMS was made to minimize its own interference with the resonance of the LCWPT system, and adheres to the design requirements summarized in Table 1 and parameters listed in Table 2. The WMS serves as a useful and portable tool to evaluate secondary circuit (RID) performance at various orientations and positions, without the problematic use of coaxial cables, or current/voltage probes within the primary field.
Physical prototypes of the WMS and RID configurations (air core and 4MF) were constructed. Experiments were done over a few days to demonstrate the repeatability of the WMS measurements (Tables 5 and 6), as well as experiments at various locations within the primary field (Figs 12 and 13). In addition, and the versatility was shown by continuous data collection while the WMS was rotated by 360°, as shown in Fig. 14. The WMS does not significantly affect the electromagnetic field distribution of the primary coil, as shown by Figs 13(a) and 13(b), making it a valuable measurement tool. It also has little effect on the resonance of the LCWPT system, as noted by experiments with/without the WMS. These experimental results show that the WMS provides better measurement performance (consistency and precision) and versatility, in comparison with coaxial cable-based-measurement systems.
 Basem M. Badr received the B.Sc. in Electrical and Power Systems from Mansoura University, Egypt in 2007. He worked as an Automation Engineer at Dräxlmaier, in Cairo, Egypt in 2008. He received his M.Sc. in Electrical Engineering from King Saud University, Saudi Arabia in 2011. He is currently pursuing a Ph.D. degree in Mechanical Engineering at University of Victoria, since January 2012. He is working on magnetic resonant wireless power transmission (WPT) for implantable bio-sensors/stimulators. His research interests include Energy Harvesting, Nanopositioning Control, Intelligent Control, Robotics, PLC, and Electrical Drive Motor.
 Robert Somogyi-Csizmazia received the B.Eng. degree in Electrical Engineering from University of Victoria, Victoria, BC, Canada, in 2006. From 2005 to 2007, he was employed at Schneider Electric as a test engineer for power systems. His duties included validating power meters for standards verification and writing test plans to meet new standards for communications protocols. He was consulted on the installation of alternative energy systems in remote areas while living in Mexico until 2009. At present, he is currently a Research Associate with the Neurobiology Department at the University of Victoria. His research interests include the development of wireless power transfer, design and fabrication of implantable electro-physiological devices, and wireless communication schemes.
 Kerry R. Delaney received his B.Sc. in zoology from the University of British Columbia and Ph.D. in neuroscience from Princeton University, Princeton NJ in 1987. Next he undertook postdoctoral work in neuroscience at U.C. Berkeley, New York University and AT&T Bell laboratories before being appointed to the faculty at Simon Fraser University, BC in 1992. He joined the faculty at the University of Victoria in 2004 and is currently Professor of Biology and Chair of the Department. His research program focuses on synaptic and cellular neurophysiology of olfactory sensory processing, neuromuscular transmission and the role of synaptic dysfunction in neuro-developmental disorders such as Rett syndrome, using a variety of optical and electrophysiological techniques. See web.uvic.ca/delaneylab for more information.
 Paul A. Leslie received the B.Eng. degree in Electrical Engineering from the University of Victoria, Victoria BC, Canada in 2006. From 2005 to 2013 he worked as an electrical design specialist at CanAssist at the University of Victoria designing customized accessibility technology for persons with disabilities. He has since worked as a Research Associate at the University of Victoria for the Neurobiology Department designing customized application specific inertial measurement units. His research interests include the development of wireless power transfer, inertial measurement unit design and algorithms and wireless embedded sensor designs.
 Nikolai Dechev received the B.A.Sc., M.A.Sc., and the Ph.D. degrees in 2004, all from the Department of Mechanical Engineering, University of Toronto, Toronto, Canada, in 1996, 1999, and 2004, respectively. He is currently an Associate Professor in Mechanical Engineering at the University of Victoria, Victoria, BC, Canada. His research program centers on biomedical systems design in the area of hand prosthesis. This involves aspects such as bio-signal measurements, implantable sensors, and prosthesis control. He also has expertise in MEMS sensors, and robotic micromanipulation. Dr. Dechev is a Member of the IEEE.


