


Introduction
Filters are broadly used at microwave and millimeter-wave (mm-wave) frequencies as a fundamental component in RF front-ends of wireless communication systems. Their use is to allow the transmission of signals of a certain desired pass-band with very little attenuation and rejecting other undesired frequencies. On the other hand, the ever-increasing demand for high bit rates, compact and low-cost devices, and easy integration with monolithic microwave integrated circuits has given rise to planar technology (such as microstrip) as essential to design microwave devices. Filters, dividers, or couplers, among other devices, designed in planar technology, ensure low weight, small size, and easy manufacturing processes. Corona RF breakdown is an electrical discharge appearing around the surface of a charged conductor, caused by ionization of the surrounding gas (in general, air) as the main phenomenon when the strength of the electric field is high enough [Reference MacDonald1, Reference Raizer2]. In satellite and, especially, in ground communication systems, it is an important matter to take into account, due to the increase of RF power requirements [Reference Yu3, Reference Cameron, Kudsia and Mansour4]. In consequence, special attention should be paid to the study of the behavior of this high power critical issue [Reference Anderson, Jordon, Lisak, Olsson and Ahlander5], and proposals to prevent and improve the peak power handling capability (PPHC) in microwave filters are needed. Previous works have predicted voltage and peak internal fields in waveguide filters [Reference Ernst and Postoyalko6–Reference Vanin, De Paolis and Schmitt8], showing their maximum values at the center of the cavities. Moreover, a study of corona breakdown thresholds has been carried out for arbitrarily-shaped waveguide-based filters in [Reference Pinheiro-Ortega, Monge, Marini, Sanz, Sorolla, Mattes, Vicente, Gil, Boria and Gimeno9]. On the other hand, in planar technology, corona RF breakdown has been focused on the connector of a microstrip transmission line [Reference Pérez Soler, Anza, Mattes, España, Quesada, Jiménez, Gil, Vicente, Mosig, Raboso, Boria, Gimeno and Alvarez-Melcon10–Reference Pérez Soler, Quesada, Mattes, Montero, Raboso, Pinheiro-Ortega, Anza, Vicente, Gimeno, Boria, Gil, Álvarez and Mosig12] and, more recently, the PPHC and maximum voltage peak at the open-circuit terminations in microstrip filters have been analyzed in [Reference Sánchez-Soriano, Quéré, Le Saux, Marini, Reglero, Boria and Quendo13, Reference Morales-Hernández, Sánchez-Soriano, Marini, Boria and Guglielmi14].
The main aim of this work is to enhance the PPHC in microstrip λ/2 coupled-line bandpass filters (BPFs). For this purpose, a solution for improving the peak power limit based on cover-ended resonators will be suggested. Simulated and measured results will be presented, and the feasibility of the proposed solution will be experimentally validated. Furthermore, for the sake of completeness, a commercial alternative based on an anticorona lacquer will be analyzed and compared to the previous proposed solution. This paper corresponds to an extended version of [Reference Morales-Hernández, Sánchez-Soriano, Marini, Boria and Guglielmi15], where the experimental validation of the proposed solution is included. The manuscript contents are organized as follows. In section “Description and analysis of the cover-ended resonator”, a parametric study has been carried out to analyze how the maximum electric field in air and the resonator's unloaded quality factor (Q u) are affected by the variation of the cover's dimensions. Other parameters are also studied, including the microstrip width (W), the thickness of the substrate (h), and the electric permittivity (εr). In section “Simulated results”, several microstrip BPFs will be designed, and simulated results of RF corona discharge thresholds will be computed to select the most suitable configuration of the cover-ended resonators. In section “Experimental results”, the proposed solution is validated by means of experimental measurements, and a comparison with a commercial anticorona lacquer is carried out. Finally, the main conclusions of this paper will be summarized in section “Conclusions”.
Description and analysis of the cover-ended resonator
Gas breakdown, corona discharge, or corona effect are multiple ways of knowing the physical phenomenon causing electrical discharges in gases (commonly air). Gases contain free ions and electrons, then they are not considered perfect insulator mediums when strong electric fields are applied to them. In this context, corona discharge breakdown limits the maximum peak power that microwave components can withstand without damaging them or degrading their performance. In this paper, an analysis is carried out to improve the PPHC of microstrip BPFs. For this task, we firstly need to obtain the electromagnetic fields inside the device by using the commercial software tool ANSYS HFSSFootnote 1. Afterwards, the software SPARK3D®Footnote 2 is used to compute the diffusion-type problem for the evolution of the electron density, where the previous electric field distribution is needed. In Fig. 1, we can see the proposed folded λ/2 microstrip resonator to carry out the parametric analysis presented in this section. Its resonant frequency is centered at f 0 = 1.6 GHz (L-band), where W = 2 mm and the low-loss standard substrate material Rogers RO4003C® is used (h = 1.524 mm, t = 0.017 mm, tanδ = 0.0027, and εr = 3.60, the latter value extracted from measurements). Previous studies in the literature demonstrate that the maximum electric field occurs in the cavity center of waveguide filters (see [Reference Ernst and Postoyalko6]), meanwhile in microstrip filters it occurs at the open-circuit terminations [Reference Sánchez-Soriano, Quéré, Le Saux, Marini, Reglero, Boria and Quendo13]. For the latter reason, as a way to reduce the electric field intensity in air for improving the peak power thresholds, two dielectric covers with the same substrate material are placed at zones where the voltage magnification is maximum, as shown in Fig. 1. The study presented in this section is divided into two parts. An initial analysis evaluates the variation of the maximum electric field in air as a function of its cover's geometrical dimensions, and other parameters such as W, h, and εr. Next, the variation of the resonator's unloaded quality factor Q u according to the same cover's parameters is addressed.
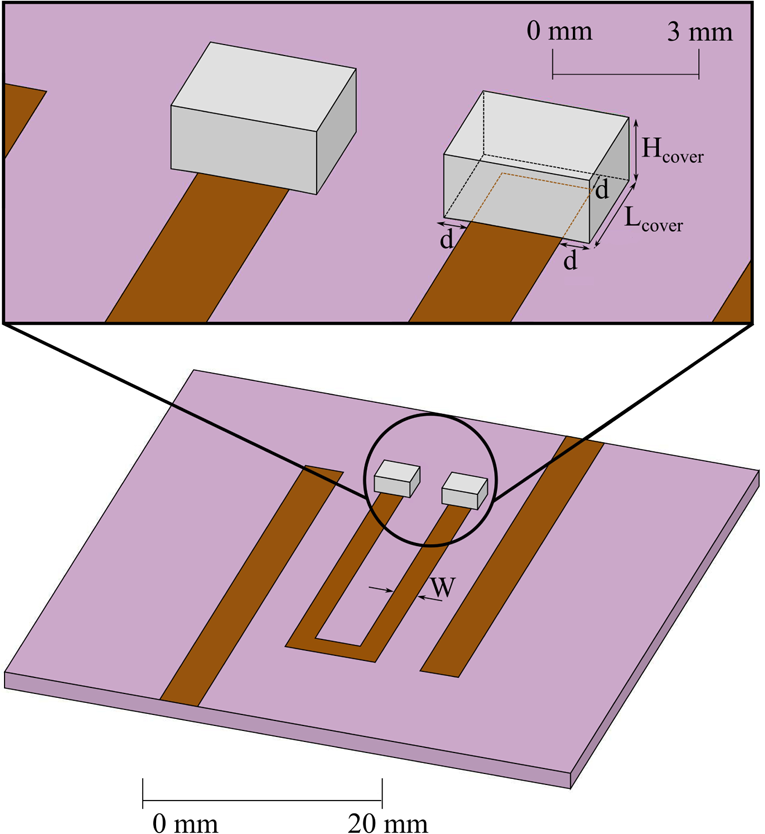
Fig. 1. Proposed resonator with dielectric covers at its ends. Cover dimensions are defined by: H cover, d, and L cover. For the sake of clarity, the covers have been drawn with a different color to that of the substrate, even the same material is used.
Study of the maximum electric field
As previously stated, a parametric study is now performed according to the variation of the maximum electric field as a function of the covers’ dimensions H cover, d, and L cover, all of them specified in Fig. 1. Next, in order to obtain more generic conclusions on the applicability of the proposed strategy, also the influence of the microstrip width, the thickness of the substrate and the electric permittivity are analyzed.
Variation of cover's dimensions
First, the variation of the maximum normalized electric field $( \vert \hat {E}_{\rm {MAX}}\vert )$ in air as a function of height (H cover) is plotted in Fig. 2(a). As it can be seen, this study has been performed for a microstrip cross-section by 2-D quasi-static simulations (for this task, ANSYS MaxwellFootnote 3 software tool has been used), so only two cover's dimensions have been needed, H cover and d. The blue line represents $\vert \hat {E}_{\rm {MAX}}\vert$
 for a resonator without covers, while the red line shows the maximum normalized electric field for different values of H cover (where d = 0.6 mm has been fixed). As we can observe, the parameter H cover has small influence on the variation of the electric field around the open-circuit terminations of the microstrip line when H cover > 0.1 mm. It is interesting to note that this effect can be justified by the fact that the fringing fields in a conventional microstrip line are stronger at the lateral sides of the conductor rather than above it. Next parameter to be studied is the influence of length d when the height of cover is fixed (H cover = 1.524 mm). As shown in Fig. 2(b), dimension d determines the total width of the cover (W cover = W + 2d). In this case, one can see that the length d has a greater impact than H cover on the electric field variation. As observed, $\vert \hat {E}_{\rm {MAX}}\vert$
 quickly decreases for values below 0.6 mm, and this trend reaches convergence for d > 0.6 mm. This second study has also been obtained by 2-D quasi-static simulations. Finally, in Fig. 2(c), the influence of parameter L cover on the variation of the maximum electric field has been represented, where H cover = 1.524 mm and d = 0.6 mm have been fixed based on the previous conclusions. In this third analysis, the whole resonator structure, as shown in Fig. 1, has been studied by using a 3-D full-wave simulator (i.e. ANSYS HFSS). Please note that for the resonator without covers, the sharp corners at both open-circuit terminations have been slightly rounded (radius equal to 0.25 mm) in order to avoid singularities (see [Reference Sirci, Sánchez-Soriano, Martínez, Boria, Gentili and Bösch16]) in the simulated results and to better represent a real implementation. In this figure, the blue line represents, once again, $\vert \hat {E}_{\rm {MAX}}\vert$
 along the resonator (0 < L < λ/2) when covers are avoided, and the red line is the 70.7% threshold reduction objective for the maximum electric field value. From these results, it is easy to observe that L cover parameter is the one presenting the highest impact on the maximum electric field variation, and we can also assert that a minimum value of L cover = 2.6 mm (2 mm+d, where d = 0.6 mm, see Fig. 2(c)) is sufficient to reach the defined field reduction goal. Please also note that in the aforementioned parametric study, the total resonator length has been slightly changed to keep the resonance frequency at 1.6 GHz in all considered cases.
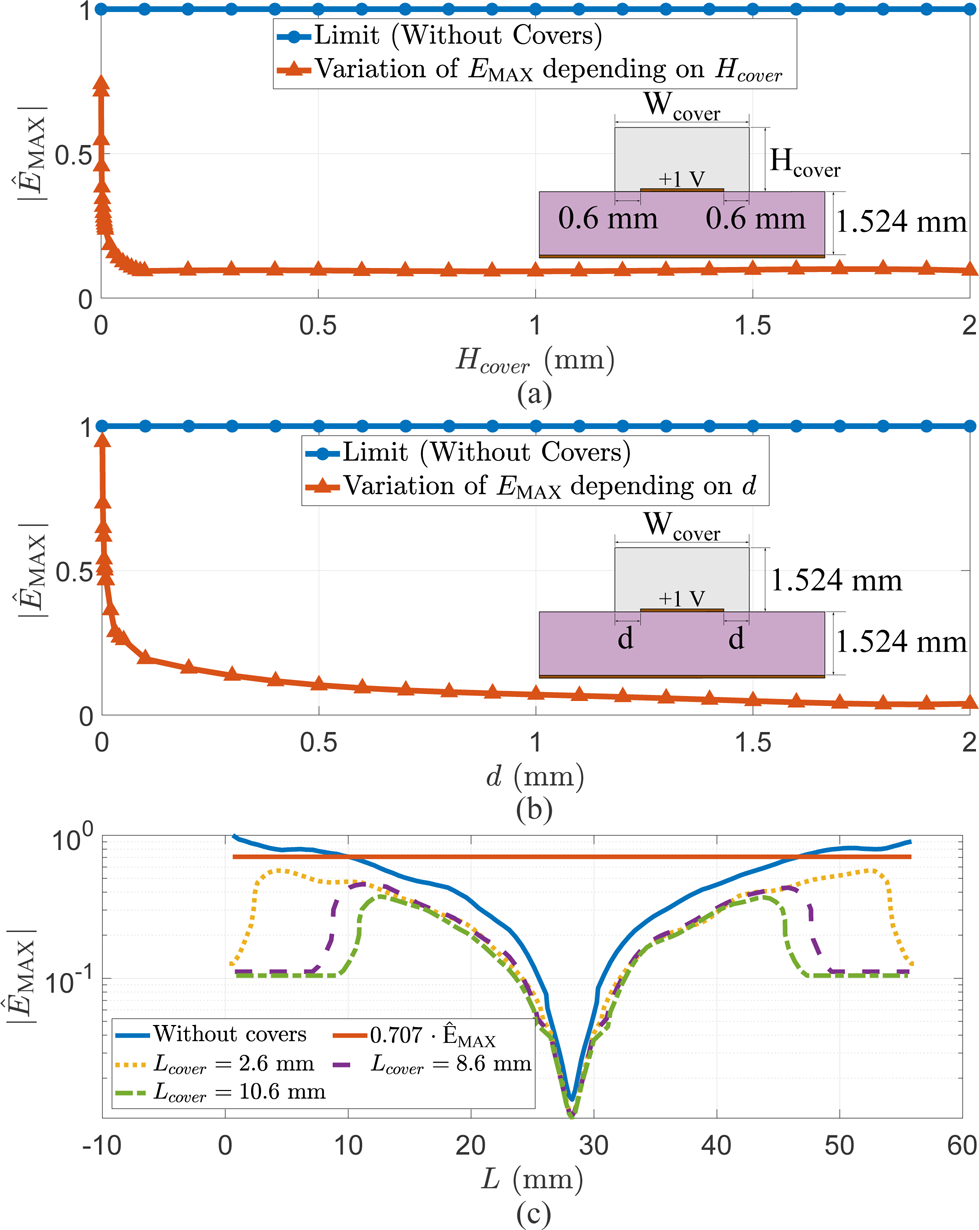
Fig. 2. Study of cover dimension variations (a) H cover, (b) d, (c) L cover. Normalized values for E MAX.
Variation of W, h, and εr
As previously indicated, the variation of the maximum electric field as a function of H cover and d is now analyzed depending on the microstrip width (W), the thickness of the substrate (h), and the electric permittivity (εr). The main aim of this study is to obtain more generic conclusions about the proposed strategy for improving PPHC when it is applied to other different configurations. It is important to highlight that this study has also been performed using ANSYS Maxwell (where a voltage excitation of 1 V has been applied). The results obtained in this case have not been normalized, in order to facilitate a better understanding of the difference between the uncovered and the covered cases. The first results are shown in Fig. 3, where each color represents different values of the width of the microstrip conductor. As we can see, all the curves show the same trend, and the dependency of |E MAX| as a function of W is minimal with respect to the cover dimensions. The next results are shown in Fig. 4, where the parameter analyzed is the thickness of the substrate material (Rogers RO4003C®), and where other possible commercial values have been studied. In this case, for an uncovered resonator (dashed lines), higher values of |E MAX| in air are obtained for thinner substrates, as expected. Nevertheless, one can see that the three solid curves (covered resonators) are very close to each other. This means that the parameter h does not play an important role when the covers are located at the open-circuit terminations of a microstrip resonator. We can, therefore, expect that similar peak power thresholds will be obtained for different thicknesses. Finally, we show in Fig. 5, the variation of the maximum electric field as a function of the electric permittivity of the substrate. In these new graphs, we can see that this parameter has the highest impact. A lower value of εr leads to a greater margin of improvement because the fringing fields are more intense and, therefore, the effect of the cover is greater. In any case, it is easy to conclude that for all cases represented in Figs 3–5, similar values of |E MAX| for a resonator with covered ends are obtained independently from the values of the parameters W, h, and εr, respectively. Based on the results presented in this section, and as it will be shown in next sections “Simulated results” and “Experimental results”, the proposed cover-ended resonator with H cover, d, and L cover dimensions (or longer) will lead to a significant enhancement of the PPHC. However, it will be necessary to take into account that bigger covers will worsen the resonator's unloaded quality factor, as it is analyzed next.

Fig. 3. Study of the variation of |E MAX| as a function of H cover and d depending on the strip width (W), where h = 1.524 mm and εr = 3.60. Dashed lines represent |E MAX| of an uncovered resonator.

Fig. 4. Study of the variation of |E MAX| as a function of H cover and d depending on the substrate thickness (h), where W = 2 mm and εr = 3.60. Dashed lines represent |E MAX| of an uncovered resonator.

Fig. 5. Study of the variation of |E MAX| as a function of H cover and d depending on the electric permittivity (εr), where h = 1.524 mm and W = 2 mm. Dashed lines represent |E MAX| of an uncovered resonator.
Study of unloaded quality factor Q u
The unloaded quality factor (Q u) is a parameter for measuring the loss of a resonating element, and it defines, along with other parameters, such as the bandwidth and order, the insertion loss of the filter. Therefore, to achieve low insertion losses in microstrip filters, it is important to keep in mind not to reduce it excessively. Different methods to obtain the unloaded quality factor can be found in the literature, although we focused our study on the transmission method presented in [Reference Kajfez, Chebolu, Abdul-Gaffoor and Kishk17], applied to an under-coupled fed resonator (as shown in Fig. 1), and where the Q u is defined as

where f 0 is the resonance frequency, BW −3 dB the bandwidth at − 3 dB, and S 21(f 0) the insertion loss value (linear units) at f 0. In this section, a complementary study of the microstrip resonator proposed in Fig. 1 is carried out for extracting Q u as a function of the previous analyzed covers’ geometrical parameters. The obtained simulated results are shown in Fig. 6, where different values of Q u are plotted for multiple combinations of L cover and d. Please note that, at this point, H cover is fixed because, as it was demonstrated before, its contribution on the variation of E MAX is low when H cover > 0.1 mm. Thus, the same thickness as the substrate Rogers RO4003C® has been selected (H cover = 1.524 mm), in order to facilitate the covers’ manufacturing process. As it was introduced in the previous section, one can see in Fig. 6 that the Q u is decreased for large cover dimensions (i.e. Q u gets worse if d or/and L cover increase), so it would be necessary to reach a trade-off between Q u and the improvement of the corona discharge breakdown. The dark blue line represents the unloaded quality factor of a standard microstrip resonator without covers, whose value is around 230. If we assume a worsening margin of $< 5\%$ of the Q u value of the reference uncovered resonator (plotted by red dashed line), the selected cover's dimensions of d = 1.5 mm and L cover = 3.5 mm guarantee not only a reduction of just $3.5\%$
 of Q u, but with a noteworthy decrease of E MAX in air, that will lead to an enhancement of PPHC. Finally, it is important to highlight that the Q u value depends on the quality of the microstrip substrate. Thus, for a lossy substrate, large covers may strongly affect the value of Q u. On the other hand, if we use substrates with very low loss tangent (i.e. alumina with tanδ = 10−4), Q u factor will be less affected by the cover size. In the following section “Simulated results”, the conclusions reached along the previous parametric study will be applied to the design of microstrip BPFs, and their peak power limits will be analyzed by simulations in order to validate the feasibility of the proposed solution.

Fig. 6. Study of the unloaded quality factor Q u for the proposed resonator in Fig. 1.
Simulated results
In this section, the aforementioned strategy to reduce the maximum electric field in air of folded λ/2 resonators is applied to the design of microstrip BPFs based on hairpin resonators, where a classical method based on coupled-resonator circuits has been used [Reference Hong18]. For all cases, a BPF with center frequency f 0 = 1.6 GHz and passband bandwidth of 80 MHz (fractional bandwidth FBW = 5%) has been designed. These filters have an ideal Chevyshev response with 20 dB return loss, and they have been implemented on the substrate defined in section “Description and analysis of the cover-ended resonator” (Rogers RO4003C®). First, a conventional/benchmark third-order filter (n = 3) has been designed. From the Chebyshev lowpass prototype parameters (g 0 = g 4 = 1, g 1 = g 3 = 0.8516, and g 2 = 1.1032), we can obtain the following external quality factors and coupling coefficients:


We find from the curves shown in Figs 7 and 8 that the separations between resonators are S 1,2 = S 2,3 = 2.16 mm and the position for input and output taps is t = 2.36 mm (the feeding lines width is 3.37 mm, which corresponds to a 50 Ω microstrip line).

Fig. 7. Coupling coefficient M i,j versus separation S i,j.

Fig. 8. External quality factor Q ex versus feed position t.
Figure 9(a) shows the layout of the benchmark third-order filter prototype without covers. Next, a third-order filter by using the proposed solution has been designed (see Fig. 9(b)), where a slight optimization from the previous design has been applied to adjust the electrical response by modifying the separation between resonators and the input and output taps position. Please also note that, due to the dielectric covers, the length of the filter resonators is reduced from 28.28 to 27.35 mm. The final manufactured prototype with covers is shown in Fig. 10(a), where the coaxial connectors are also attached. One can also see the implementation of covers, which have been set at the open-circuit terminations where the voltage magnification is maximum, as indicated previously, and they have been attached by using a cyanoacrylate adhesive. In Fig. 10(b), the scattering parameters and the group delay, with and without covers, are represented for simulations and measurements. From the measurements, we can see an increase of insertion losses at f 0 from 1.07 dB (benchmark) to 1.19 dB (with covers).
Next, two fifth-order (n = 5) hairpin microstrip bandpass filters (with and without covers) have also been designed following the same steps described above. They will be useful in the following analysis, especially for comparison with the third-order filter regarding the number of covers needed. The layout of the five-pole benchmark filter without covers is shown in Fig. 9(c), and the filter where cover-ended resonators are used is shown in Fig. 9(d).

Fig. 9. Layouts of the designed microstrip bandpass filters. (a) Third-order benchmark. (b) Third-order with covers. (c) Fifth-order benchmark. (d) Fifth-order with covers.
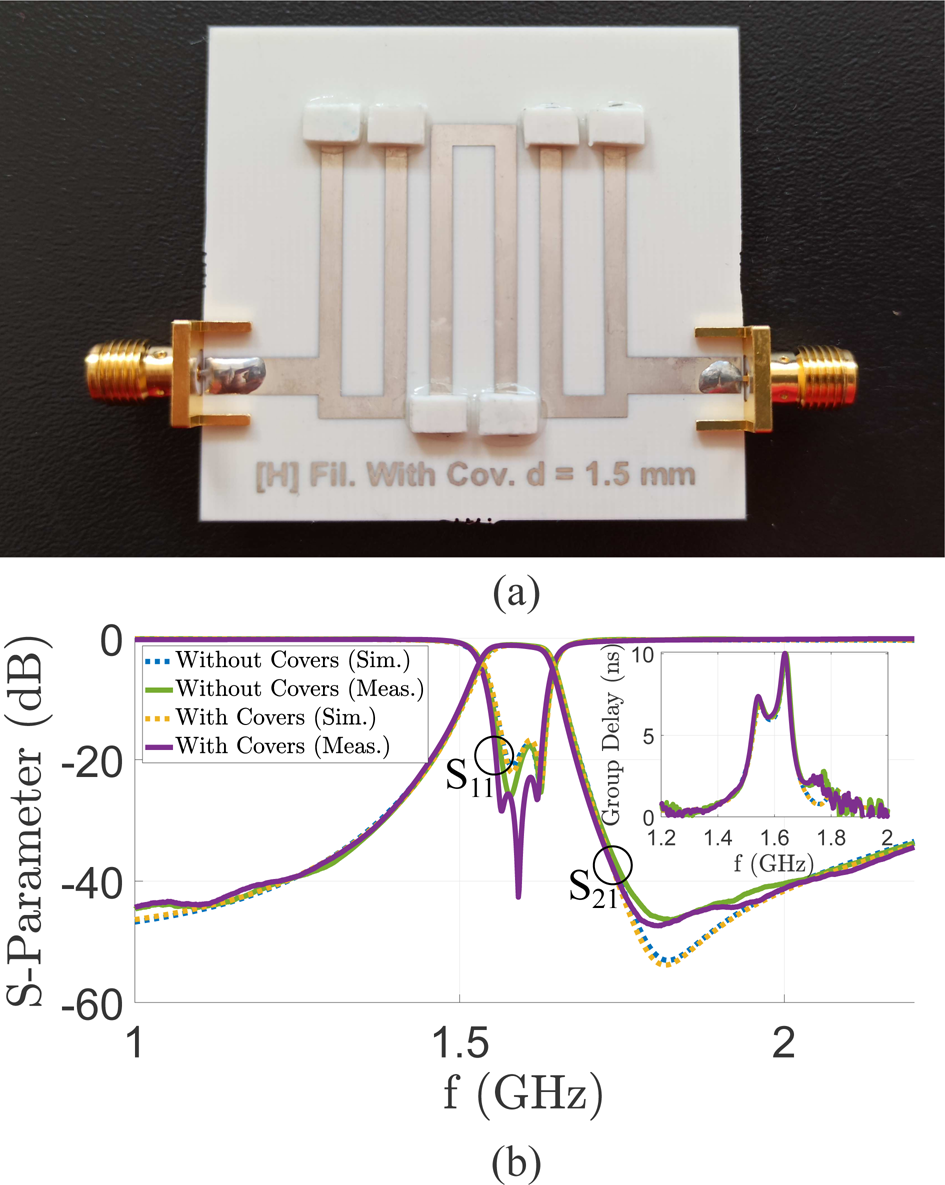
Fig. 10. Third-order filter. (a) Manufactured prototype. (b) Frequency response and group delay.
After verifying the simulated frequency responses of the designed filters, the analysis of corona discharge RF breakdown with the commercial software tool SPARK3D® is tackled. As demonstrated in [Reference Ernst, Postoyalko and Khan19], it exists a direct relationship between the filter group delay and the time average stored energy. In this paper, the analysis of corona discharge breakdown is performed at center frequency f 0 = 1.6 GHz without a loss of generality regarding the effectiveness of the proposed solution. At this frequency, the filters’ responses are rather constant in terms of insertion loss and group delay, which facilitates the power measurements in case there were any frequency drift. However, it should be noted that at the frequencies where the group delay is maximum (which are close to the filter cut-off frequencies), still lower PPHC values could be found, since the stored energy (and consequently, the voltage magnification) is the highest. Different case studies have been performed depending on the parameters d and L cover (see Fig. 11) for the fifth-order filter with covers (see Fig. 9(d)), and whose conclusions can be directly extrapolated to any filter with cover-ended resonators as they follow the same trends previously discussed in section “Description and analysis of the cover-ended resonator”. In addition, the number of required covers is also studied, since in this case, the filter order does play an important role. Some comments can be arisen from the obtained results:
(1) Variation of d dimension. It can be checked in Fig. 11(a) that if the dimension d of covers is increased for a fixed value of L cover = 2 mm+d, corona discharge breakdown thresholds improve slightly, as previously stated in section “Variation of cover's dimensions”. Nevertheless, this improvement is limited by the reduction of Q u. A good compromise for this parameter is d = 1.5 mm, since a smaller width could also make the covers’ manufacturing process more difficult.
(2) Variation of L cover dimension. In Fig. 11(b), one can appreciate that for larger L cover dimension, corona breakdown threshold is improved, and its contribution is higher than dimension d. Similarly to the parameter d, L cover also causes a reduction of the resonators’ unloaded quality factor, so a cover length of 2 mm+d guarantees a good improvement, with a very small reduction of Q u, and consequently, an almost insignificant increase of insertion losses (see Fig. 6).
(3) Study of elimination of covers in some resonators. Finally, as we can see in Fig. 9(d), there are not covers in the fifth resonator. For the five-pole filter, simulations with SPARK3D® have shown that first, second, third, and fourth resonators have the possibilities to generate corona breakdown at center and/or critical frequencies, due to their higher voltage magnification (see [Reference Sánchez-Soriano, Quéré, Le Saux, Marini, Reglero, Boria and Quendo13]). This does not occur in the fifth resonator, where the stored energy is the lowest one (see [Reference Ernst and Postoyalko6]), thus, the use of covers can be avoided in this resonator. However, as shown in Fig. 9(b), covers at the last resonator for the third-order filter can not be removed due to its stored energy is still high enough. As proof of this evidence, Fig. 12 shows the electron density at f 0 for both third and fifth uncovered filters. As shown, the electron density on the open-circuit terminations of the third resonator in Fig. 12(a) is higher than the electron density on the fifth resonator in Fig. 12(b), where the same electron density scale has been applied for both representations. In this regard, it is noted that the presented fifth-order filter with covers is obviously reciprocal, but it is worth noting that it will be necessary to distinguish between input and output ports under large applied power signals, due to its asymmetrical layout. In contrast, the third-order filter will not need the identification of its ports considering that it is completely symmetrical, for both electrical and power behaviors.

Fig. 11. Corona discharge breakdown for the fifth-order filter shown in Fig. 9(d). (a) Variation of d dimension (fixed value of L cover = 2 mm+d). (b) Variation of L cover dimension (fixed value of d = 0.6 mm)

Fig. 12. Electron density for filters without covers. f 0 = 1.6 GHz, Pressure = 10 mbar, and T = 293 K. (a) Third-order. (b) Fifth-order.
Experimental results
Cover-ended resonators
In view of the above results, a possible solution to enhance the corona discharge breakdown thresholds is to use covers with dimensions H cover = 1.524 mm, d = 1.5 mm, and L cover = 2 mm+ d = 3.5 mm. These covers should be placed on the open-circuit terminations, where the electron density is maximum, as previously shown in Fig. 12. In order to validate the power breakdown enhancement when covers are installed, a measurement campaign has been carried out at the European High-Power RF Space Laboratory (Valencia, Spain) focused, by way of illustration, on the previously designed third-order filters: the benchmark filter with conventional resonators (Fig. 9(a)) and the proposed solution with cover-ended resonators (Fig. 9(b)). In Fig. 13, we can see the scheme of the test-bed configuration used for corona breakdown detection. A pulsed signal with the common measured carrier frequency at 1.58 GHz (which corresponds to the measured center frequency of prototypes), low width (20 μs), and low duty cycle ($2\%$ ) has been used in order to avoid any self-heating effect in the devices under test (DUT). The implemented filters have been measured in a pressured controlled chamber from 1 to 1013 mbar at ambient temperature (22 °C) in order to get their respective Paschen curves. The maximum applied signal power of the test-bed is 440 W. Five different methods have been used for the corona discharge detection: third-harmonic detection, nulling of the forward/reverse power at the operation frequency, insertion and return loss monitoring, a broadband diode, and an electron probe. When two or more of these methods were detected, the corona discharge breakdown was considered to have occurred. Moreover, a video camera for visual inspection of the recording has been used, and some captures of corona discharges will be shown next. Figure 14 shows the simulated and measured Paschen curves for both third-order filters (with covers and without covers). It is important to highlight that, due to the fact that the maximum applied power is limited to 440 W, an extrapolation has been carried out for estimating corona discharge thresholds at pressures where power levels are higher, taking into account the approximately linear behavior of Paschen's law at high pressures. From the measured data of Fig. 14, one can see that, as expected, the obtained power thresholds are higher than simulations in SPARK3D® (see [Reference Sánchez-Soriano, Quéré, Le Saux, Marini, Reglero, Boria and Quendo13]), mainly for the increase of the insertion losses with regard to the simulated frequency response. As we can see in Fig. 15, the obtained measured PPHC enhancement between the benchmark and the proposed solution prototype is around 3.1 dB for high pressures (above 200 mbar). These results confirm the decrease of the electric field at the open-circuit terminations of the resonators, where the voltage magnification is maximum, and the improvement of the corona discharge thresholds by using the proposed solution. In order to check the zones where corona discharge occurs for both third-order measured filters, the obtained captures of the video camera located inside the pressure chamber are included in Fig. 16. For the benchmark prototype without covers (see Fig. 16(a)), one can easily see that, as expected, corona breakdown is taking place at the open-circuit terminations of the first and second resonators, while for the filter where covers are used (see Fig. 16(b)), the spark is situated at the same resonators, but, in this case, it appears after the position of the covers around the surface of the conductor layer in contact with air.
Anticorona lacquer
Finally, and for the sake of completeness, an additional solution for improving corona discharge thresholds is presented, and a brief discussion will be carried out to analyze it in comparison with the covers’ solution. This second proposal lies in the application of a commercial anticorona lacquerFootnote 4, based upon an acrylic copolymer, which is primarily designed to protect printed circuit boards and other electronic equipment. After applying one layer of the anticorona lacquer over the designed third-order benchmark prototype, the scattering parameters are obtained. A thickness around 35μm has been measured by using a micrometer. A displacement of 13 MHz of the filter response and an increase of + 0.26 dB of the insertion loss with respect to the benchmark prototype were observed. On the other hand, as previously checked in section “Simulated results” with regard to the three-pole filter with cover-ended resonators, the frequency response is only shifted 4 MHz and the insertion losses are only increased by + 0.12 dB. Greater thicknesses of the anticorona lacquer have been avoided in order to reduce higher values of insertion losses and frequency shift. The corona breakdown improvement of this additional prototype, where anticorona lacquer is applied, has been also validated during the measurement campaign using the same test-bed configuration. The obtained power thresholds are represented in Fig. 14, where similar values to those presented by the benchmark prototype without covers can be seen. Please note that simulated results are not included in this case due to the fact that the electrical properties of the anticorona lacquer are not specified by the manufacturer, and therefore, they are unknown. The achieved enhancement by using anticorona lacquer with respect to the uncovered prototype is plotted in green color in Fig. 15. For a medium-high pressure of 400 mbar, we can see that a measured power enhancement of about 1.1 dB has been obtained. This is significantly less than the 3.1 dB presented using our cover-ended resonators. Furthermore, it is important to note that, for higher pressures, a PPHC enhancement could be expected that is slightly higher than the one we have estimated. After observing the above results, some comments can be made about the tested commercial anticorona lacquer. Although the application of this solution is easier than the fabrication and installation of the covers, its numerous drawbacks such as the low improvement achieved and the increase of the insertion losses (probably due to its high loss tangent) result in a worse solution compared to the suggested ones with covers. Furthermore, other disadvantages can be highlighted from the lacquer, such as the high displacement of the electrical response, the difficulty of controlling the thickness when it is applied, its unknown behavior as time goes by, and its low resistance when the anticorona lacquer is in contact with other liquids like alcohol, as we have verified.

Fig. 13. Scheme of the test-bed configuration used for corona breakdown detection.
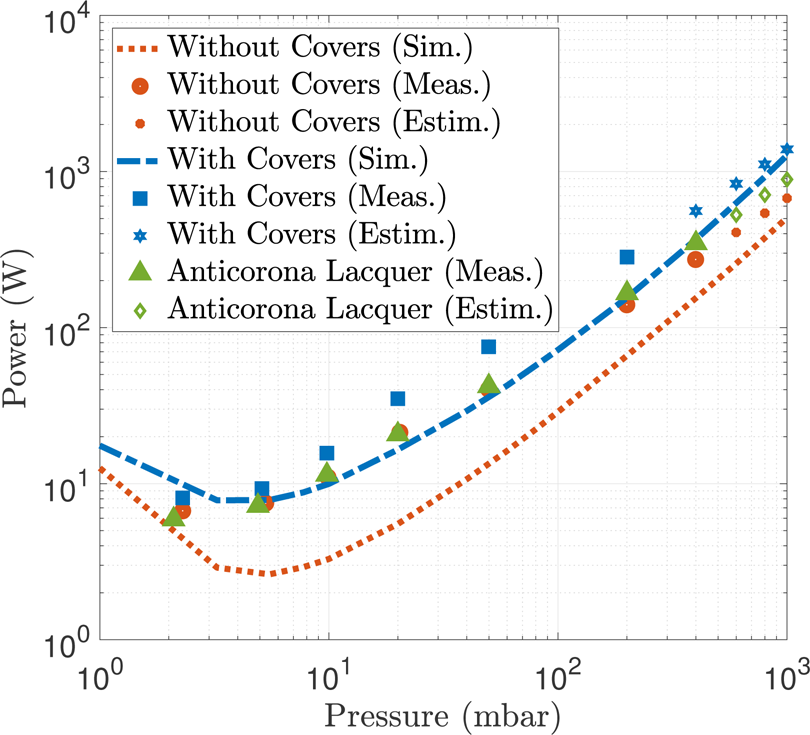
Fig. 14. Corona discharge breakdown (Paschen curves). Simulated, measured, and estimated values are plotted for the benchmark prototype third-order filter without covers (red color), filter where cover-ended resonators are used (blue color), and filter where anticorona lacquer is applied (green color).

Fig. 15. Enhancement of corona discharge breakdown threshold compared to the benchmark prototype third-order filter without covers. Filter with covers is plotted in blue color, while filter with anticorona lacquer is represented in green color.
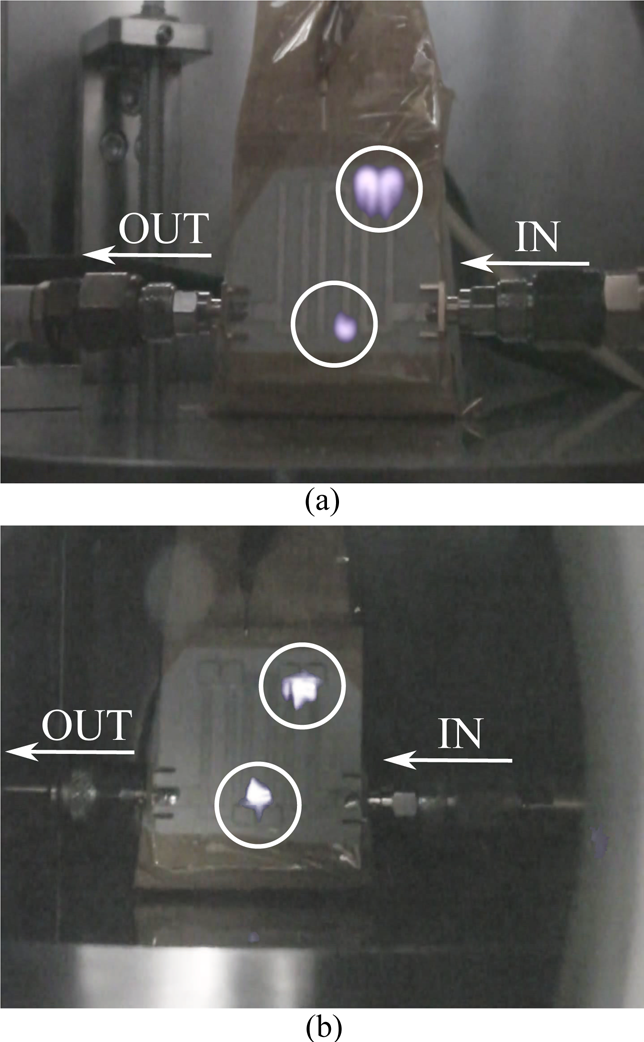
Fig. 16. Capture of corona discharges. (a) Third-order filter without covers. (b) Third-order filter with covers.
Conclusions
In this paper, a solution for improving PPHC in microstrip coupled-line BPFs has been presented. The suggested strategy has been based on the use of resonators covered with the same dielectric material as the substrate at their open-circuit terminations, where the voltage magnification is maximum. The main goal of this proposal has been to reduce the maximum electric field in air and, consequently, to enhance PPHC without hardly degrading the filter response performance. First of all, the investigation has been focused on the study of the maximum electric field (E MAX) and the unloaded quality factor (Q u) as a function of the three cover physical dimensions. The obtained results have shown that the higher impact is associated with L cover parameter, while dimensions H cover and d have shown less influence in the variation of E MAX and Q u. Due to the deterioration of the unloaded quality factor at the same time than PPHC is enhanced for larger dimensions, the importance to select a suitable covers’ size to reach an effective compromise between them has been highlighted. It has also been seen that, for high-order BPFs (n ≥ 5), it is possible to avoid covers at the last resonator (with regard to the input port) due to its low stored energy, and consequently, its low electron density at the open-circuit terminations. Subsequently, the feasibility of the proposed solution has been validated in a measured campaign, where a PPHC enhancement of 3.1 dB with respect to a benchmark prototype has been achieved for high pressures (above 200 mbar) when covers are used. Finally, an additional solution by using a commercial anticorona lacquer has been presented. The increase of the insertion losses and a low PPHC improvement of only 1.1 dB, among others disadvantages, have been shown for the lacquer-based solution.
Acknowledgments
This work has been supported by the University of Alicante through the fellowship grant UAFPU2018-054 and by the “Ministerio de Ciencia e Innovación” through the sub-projects C41 and C43 of the coordinated project PID2019-103982RB. The authors would like to thank Val Space Consortium for its contribution – Laboratories funded by the European Development Fund – A way of making Europe.
 Aitor Morales-Hernández was born in Alicante, Spain, in 1992. He received the telecommunications engineering degree from the Universitat Politècnica de València (UPV), Spain, in 2014 and the Master's degree from the University of Alicante (UA), Spain, in 2017. He was the recipient of the Extraordinary Master's Degree award. In 2019, he signed a predoctoral contract to join, as a Ph.D. student, with the Microwave and Applied Computational Electromagnetics Group (GMECA), from the Institute of Physics Applied to Science and Technologies (FACyT-UA). His line of research is related to the study and design of microwave filtering devices, focusing on their power handling capabilities.
 Miguel Á Sánchez-Soriano was born in Murcia, Spain, in 1984. He received the Master's degree in telecommunications engineering (with a Special Award) and the Ph.D. degree in electrical engineering from Miguel Hernandez University (UMH), Elche, Spain, in 2007 and 2012, respectively. In 2007, he joined the Radiofrequency Systems Group, UMH, as a Research Assistant. In 2010, he was a Visiting Researcher with the Microwaves Group, Heriot-Watt University, Edinburgh, UK. In January 2013, he joined the LabSTICC Group, Université de Bretagne Occidentale, Brest, France, as a Post-Doctoral Researcher, where he worked for 2 years. From January 2015 to September 2015, he was a “Juan de la Cierva” Research Fellow with the Grupo de Aplicaciones de Microondas (GAM), Technical University of Valencia, Valencia, Spain. Since September 2015, he has been with the University of Alicante, Alicante, Spain, where he is currently an Associate Professor. His research interests cover the analysis and design of microwave planar devices, especially filters and their reconfigurability, and the multiphysics study of high-frequency devices. Dr. Sanchez-Soriano was a recipient of the runner-up HISPASAT Award to the Best Spanish Doctoral Thesis in New Applications for Satellite Communications, awarded by the Spanish Telecommunication Engineers Association (COIT/AEIT) and of the Extraordinary Ph.D. Award from Miguel Hernández University. He serves as an Associate Editor for the journals, IEEE Transactions on Microwaves, Theory and Techniques and IET Microwaves, Antennas and Propagation and as a regular reviewer for more than 20 journals, including the IEEE Microwave and Wireless Components Letters, IET Electronics Letters, IEEE Access, and several IEEE international conferences.
 Stephan Marini was born in Cagli, Italy, in 1976. He received the Laurea degree in electronics engineering from the University of Perugia, Perugia, Italy, in 2001, and the Ph.D. degree in telecommunications from the Universidad Politécnica de Valencia, Valencia, Spain, in 2005. In 2001, he joined the Departamento de Comunicaciones, Universidad Politécnica de Valencia, where he was involved in the framework of the European Union Project – Millimeter-Wave and Microwave Components Design Framework for Ground and Space Multimedia Network (MMCODEF). Since 2005, he has been a Lecturer with the Departamento de Física, Ingeniería de Sistemas y Teoría de la Señal, Universidad de Alicante, Alicante, Spain, where he became an Associate Professor in 2012. In 2009, he received a fellowship from the Spanish Government for a short stay at the LEMA Laboratory, École Polytechnique Fédérale de Lausanne, Lausanne, Switzerland, as a Visiting Scientist. His current research interests include numerical methods in computer-aided techniques for the analysis and design of microwave and millimeter passive components and simulation of power effects (multipactor and corona) in passive waveguide systems. Dr. Marini currently serves as an Associate Editor for IET Electronics Letters and as a regular Reviewer for the most relevant IEEE and IET technical journals in his areas of interest.
 Marta S. Reglero received the Telecommunications Engineering degree from the Universitat Politècnica de Valencia (UPV), Valencia, Spain, in 2008. From 2006 to 2008, she was a Fellow Researcher with the Institute of Telecommunications and Multimedia Applications (iTEAM), UPV, and the Department of Applied Physics Electromagnetism and the Institute of Materials Science (ICMUV), Universitat de València Estudi General (UVEG), Valencia. Since 2008, she has been a Technical Researcher with iTEAM, UPV. Since 2010, she has been a Laboratory Engineer with the ESA-Val Space Consortium (VSC), Valencia. Her current research interests include the analysis of high-power effects on microwave devices.
 Laura Esteve received the Physics degree from the Universitat de Valencia Estudi General, Valencia, Spain, in 2009 and M.Sc.Eng. degree from Universitat Politècnica de València, València, Spain, in 2018. In 2010, she joined the ESA-VSC High Power RF Space Laboratory, Valencia, Spain. Her research interests include high-power RF effects in space applications such as Multipactor, Corona, and Passive Intermodulation.
 Vicente E. Boria was born in Valencia, Spain, in 1970. He received the Ingeniero de Telecomunicación (Hons.) and the Doctor Ingeniero de Telecomunicación degrees from the Universidad Politécnica de Valencia, Valencia, in 1993 and 1997, respectively. In 1993, he joined the Departamento de Comunicaciones, Universidad Politécnica de Valencia, where he has been a Full Professor since 2003. In 1995 and 1996, he held a Spanish trainee position with the European Space Research and Technology Centre, European Space Agency (ESTEC-ESA), Noordwijk, The Netherlands, where he was involved in the electromagnetic (EM) analysis and design of passive waveguide devices. He has authored or coauthored 10 chapters in technical textbooks, 180 papers in refereed international technical journals, and more than 200 papers in international conference proceedings. His current research interests include analysis and automated design of passive components, left-handed and periodic structures, and the simulation and measurement of power effects in passive waveguide systems. Dr. Boria has been a member of the IEEE Microwave Theory and Techniques Society (IEEE MTT-S) and the IEEE Antennas and Propagation Society (IEEE AP-S) since 1992. He is a member of the Technical Committees of the IEEE-MTT International Microwave Symposium and of the European Microwave Conference, and also the European Microwave Association (EuMA). He is an Editorial Board member of the International Journal of RF and Microwave Computer-Aided Engineering. He has been the Chair of the 48th European Microwave Conference, Madrid, Spain. He has been an Associate Editor of IEEE Microwave and Wireless Components Letters from 2013 to 2018 and IET Electronics Letters from 2015 to 2018. He currently serves as a Subject Editor (Microwaves) for IET Electronics Letters. He serves as a regular Reviewer for the most relevant IEEE and IET technical journals in his areas of interest.
 Marco Guglielmi was born in Rome, Italy, in December 1954. He received the Laurea degree in ingegneria elettronica from the University of Rome La Sapienza, Rome, in 1979, where he attended the Scuola di Specializzazione in Elettromagnetismo Applicato, in 1980, the M.S. degree in electrical engineering from the University of Bridgeport, Bridgeport, CT, USA, in 1982, and the Ph.D. degree in electrophysics from Polytechnic University, Brooklyn, NY, USA, in 1986. From 1984 to 1986, he was an Academic Associate with Polytechnic University, where he was an Assistant Professor, from 1986 to 1988. From 1988 to 1989, he was an Assistant Professor with the New Jersey Institute of Technology, Newark, NJ, USA. In 1989, he joined the European Space Agency as a Senior Microwave Engineer at the RF System Division, European Space Research and Technology Centre (ESTEC), Noordwijk, The Netherlands, where he was in charge of the development of microwave filters and electromagnetic simulation tools. In 2001, he was appointed the Head of the Technology Strategy Section, ESTEC, where he contributed to the development of management processes and tools for the formulation of a European strategy for Space Technology Research and Development. In 2014, he retired from the European Space Agency. He is also holding the position of Invited Senior Researcher with the Polytechnic University of Valencia, Valencia, Spain. Dr. Guglielmi has been elevated to the grade of Fellow of the IEEE in January 2013 for contributions to multimode equivalent networks and microwave filter design. In 1981, he was awarded a Fulbright Scholarship, Rome, and the Halsey International Scholarship Programme (HISP) from the University of Bridgeport.


 Open access