


SIR,
Reference Gurnell and FennGurnell and Fenn (1985) have provided a valuable description of the spatial and temporal variations of electrical conductivity in the pro-glacial stream of the glacier de Tsidjiore Nouve, Switzerland. Comparison of their measurements of the spatial variation of pro-glacial stream conductivity with some I took in the same month (July 1981) at the nearby Gornergletscher shows several points which may be of value in future work.
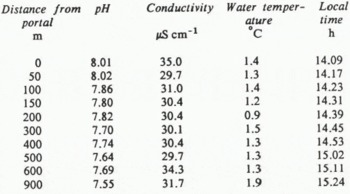
Table I shows the longitudinal profile of Gornera water quality I measured from the glacier portal to the Grande Dixence Prise d’Eau on the afternoon of 19 July 1981 in a rather severe snowstorm (air temperature = 3.5–5.6 °C, barometric pressure = 0.790 bar at portal). The observed conductivity is neither constant, nor slowly increasing, as would be expected during down-stream solute acquisition. Instead, both the conductivity and water temperature vary in an approximately random fashion. This is caused by sampling different parcels of water as they travel downstream.
A “water parcel” is used here as an operational approximation to a “water particle”, which is an infinitesimally small volume of water used to describe fluid flow by particle mechanics (Halliday and Resnick, 1966, p. 440). Water parcels examined during the present work were 0.25 dm3, removed from the flow in a plastic beaker, and completely measured within 10–20 s. In the general case, a water parcel should represent the minimum water volume necessary to measure a chemical, or physical, water property in the field at a given time, using a given method. The uniformity of properties for several water parcels varying in length, width, or depth along a stream should be confirmed by measurements, not assumed.
Table I. 19 July 1981 Longitudinal Profile of Gornera Water Quality
Sampling an individual water parcel as it progresses down-stream uses the coordinate system developed by J.L. Lagrange, varying the spatial coordinates of the particle (x, y, z) as a function of time (t). Common Lagrangian current indicators are “drift poles”, marker floats, sheets of paper, or patches of dye (Reference PickardPickard, 1963, p. 81). Marker floats were used in this study.
The traditional approach of measuring fluid particle properties at a fixed location of the stream uses the coordinate system of L. Euler, holding the spatial coordinates of the measuring site for different fluid particles constant as a function of time. Eulerian sampling is more commonly used because there is less effort involved.
The Lagrangian sampling perspective allows direct measurement of solute changes to a water parcel as they occur. The Eulerian approach allows estimates of solute transport through time at a given location, but it fails to delineate the chemical evolution of a water particle with time. Direct measurements of the chemical evolution of a water parcel during its passage down-stream are the primary data needed to define reaction rates and understand the mechanisms of chemical weathering in the stream.
The Eulerian sampling of fluid velocity and chemistry produces time series which can be calculated into frequency and wavelength information using spectral analysis. To date, such analyses have not been used to derive chemical reaction rates or weathering mechanisms in a stream. Sometimes Eulerian sampling is combined with Lagrangian descriptions of fluid-flow equations to predict down-stream chemical property changes; for instance, the longitudinal dispersion of a chemical point-source input (Reference Gurnell and FennFischer, 1968). Unfortunately, longitudinal dispersion theory yields invalid predictions for the measured down-stream evolution of chemical tracers in natural streams, due to undetected sampling errors (Chatwin, 1971), or fundamental errors in the theory (Reference DayDay, 1975). Reference DayDay’s (1975) exhaustive field conductivity measurements of the longitudinal dispersion of salt in the mountain streams of New Zealand show that stream conductivity varies longitudinally in presently unpredictable ways, after a point-source chemical injection up-stream. It is assumed here that the flow characteristics of Reference DayDay’s (1975) mountain streams are similar to many pro-glacial streams, and that chemical erosion of a several square metres area of bedrock in a glacial stream is analogous to a point-source injection, For the above reasons, this study attempted to sample one water parcel as it moved down-stream by Lagrangian sampling.
Reference Ambach and JochumAmbach and Jochum (1973) pioneered the calculation of longitudinal dispersion coefficients with Lagrangian equations in pro-glacial streams with an excellent study of dye-fluorescence measurements versus time at Eulerian sampling stations. Reference DayDay’s (1975) field measurements show that accurate prediction of down-stream chemical concentration changes in mountain streams is not possible with present methods.
Until predictive methods are developed further, the only available way to determine chemical reaction rates in a pro-glacial stream is by direct measurement. Directly measured reaction rates will always be the standard that any field predictive method is compared against. I failed to obtain the needed direct measurements in this study. The point of this letter is to let others learn from my observations and errors, without having to repeat them.
The main difficulty encountered is that the pro-glacial stream often flows faster than one person can sample with Lagrangian stations. The ideal solution would be to deploy a floating, telemetering sensor which monitors chemical changes as the stream flows. If traditional Eulerian stations must be used, more equipment must be purchased, and marker floats should be used to identify water to be sampled. Field tests at sampling stations are necessary to determine if instantaneous Eulerian velocity measurements may be used to estimate accurately float-travel times. The 49.7% variation in observed Gornera float-travel times in 11.53 min on 2 August 1981, during constant discharge, is not encouraging in this regard.
The time to measure the profile given in Table I was 4500 s. The mean water-parcel travel time for this section of the Gornera was 390 s (n = 9), based on measurements of 474 and 495 s on 29 July; 427 s on 1 August; and 433, 401, 332, 296, 312, and 329 s on 2 August 1981 for Q from 18 to 22 m3 s−1. Travel time was determined by timing neutral buoyancy oranges tied to empty 1 dm3 plastic sample bottles by fluorescent orange surveyor’s tape, using two synchronized digital watches to within 1 s accuracy. The straight-line distance between the terminus portal and the Prise was surveyed as 731 ± 19 m, but the actual stream course was paced at 885 ± 80 m.
Although Reference Gurnell and FennGurnell and Fenn (1985, p. 109) found a maximum difference of 0.5 μS cm−1 over about 200 m in the main pro-glacial stream, Table I shows a change of 15%, 4.6 μS cm−1, in 9 min from the sites 500–600 m down-stream in the Gornera. I have also observed such significant conductivity changes in a few minutes in the pro-glacial streams of Coleman and Nisqually Glaciers in the U.S.A. It follows that steady-state stream conductivity cannot be assumed to hold generally during the brief time period required for sampling the spatial variations of pro-glacial streams by one observer.
Table I shows pH values progressively decrease down-stream, as re-aeration apparently supplies CO2 across the air-water interface faster than weathering reactions proceed. Often at Gornergletscher and Nisqually Glacier, this is not the case, and pH increases down-stream, as weathering proceeds faster than re-aeration. The relatively smooth decrease of pH in Table I implies a nearly steady-state pH profile during the 75 min sampling traverse. For any one site in the Gornera, pH was observed to vary out of phase with both water discharge and conductivity, suggesting its possible future worth in sorting out solute sources in the glacial hydrologic system.
Unfiltered, in-situ pH measurements are from 10000 to 100000 times more sensitive than conductivity in detecting acid-driven rock weathering reactions in the Gornera. This is because in-situ Gornera pH is generally in the range of 7–8 (Table I), corresponding approximately to a hydrogen-ion concentration of 10−7 to 10−8 E dm−3. For a Gornera conductivity of 30 μS cm−1 at 0–2°C, the total ionic content is about 10−3E dm−3. Since the Gornera has been shown to have a linear correlation between electrical conductivity and major cationic content of filtered samples (Metcalf, unpublished), the stream conductivity is linearly proportional to total ionic content.
Since the hydration of CO2 supplies acid for rock weathering in the Gornera, pH is a very sensitive indicator of this weathering process. To ensure that CO2 exchange does not alter pH from in-situ values, no pressure or vacuum filtration must be used prior to the measurement. I explained this poorly in Metcalf (1984). Unfiltered samples yield in-situ pH (or an approximation from CO2 transfer effects), if no rock weathering occurs during the measurement. Filtered samples suspend non-volatile ionic species concentrations at in-situ values, and allow determination of the pH when the sample is in equilibrium with atmospheric pCO2. Although the method of Reference MetcalfMetcalf (1984) is precise, it contains unknown systematic errors of 0.2–0.5 pH units without independent standardization, due to calibration with concentrated buffers. Dilute standards must be used for accurate pH measurements of pro-glacial streams (Metcalf, in press).
Table II. 9 August 1981 Longitudinal Profile of Gornera Water Quality

Table II is interpreted to show the pro-glacial stream is already equilibrated with atmospheric CO2 before reaching the glacier portal. This profile was measured as before on 9 August 1981 (Q = 15–17 m3 s−1, air temperature = 8–9°C, barometric pressure = 0.792 bar), a partly sunny afternoon. Conductivity and pH are relatively constant throughout the profile. The water appears to warm generally down-stream during re-aeration, but not in a continuous manner, due to sampling different water parcels. All variables exhibit some scatter attributable to sampling different parcels of water.
I conducted the 9 August 1981 traverse by running and jumping over the boulders between sampling locations. In summer, it is unlikely one individual will be able to sample the same water parcel at many down-stream locations on a swiftly flowing, pro-glacial stream, such as the Gornera. In winter, such sampling is just possible in a steep valley by skiing. Although an inept skier, I was able to sample this way at Nisqually Glacier in 1977 and 1984. An easier approach is to use field assistants or recording instruments, if the resources are available.
I gratefully acknowledge the extensive data on longitudinal dispersion in glacial streams furnished by Professor Dr W. Ambach, prior to planning field sampling strategies.


