


How do we investigate the full complexity of experiences of mobility among Latin America’s poor and working classes during a period of tumultuous political and economic change? More specifically, how do we investigate “class mobility” when the class terminology, the nature of the classes, and class relations to be studied are debated by policymakers, scholars, and indeed by the mobile (and nonmobile) themselves? In 2016 authors Junge, Klein, and Mitchell confronted these questions when we began a three-year anthropological investigation of the political subjectivities and broader lifeways of poor and working-class Brazilians who experienced social, economic, educational, and geographic mobility during the first decade of the twenty-first century—a group once heralded as Brazil’s “new middle class” (Vicente Reference Vicente and Bartelt2013; Junge, Pereira, and Chiarelli Reference Junge, Liz Nunes Pereira and Lassance Chiarelli2020). During this decade, an extraordinary demographic transformation took place. The proportion of the population living below the official poverty line fell by more than 55% (Neri Reference Neri, de Castro, Koonings and Wiesebron2014). Indeed, during the two-term presidency of Luiz Inácio Lula da Silva (2003–2010) of the left-leaning Workers’ Party (Partido dos Trabalhadores, or PT), an estimated nine million households (approximately thirty million people) rose out of poverty. Some studies have found that per capita income continued to rise and poverty continued to decline during the first term of Lula’s PT successor, Dilma Rousseff (2010–2014) (IBGE 2015; Osorio Reference Osorio2019), although other studies have found that this progress began to reverse during that time (Quadros Reference Quadros2015). Poverty reduction on this scale was propelled by macroeconomic growth and labor-market expansion (fueled, in part, by Chinese demand for Brazilian exports), federal initiatives such as conditional cash transfer programs (most famously the Bolsa Família or Family Allowance Program), expanded access to higher education, increases in the minimum wage and the expansion of elderly pensions, and expanded labor mobilization. In a country long known for poverty and inequality (Portes and Hoffman Reference Portes and Hoffman2003), the expansion of upward economic mobility among the poor and working classes was celebrated by many as evidence of Brazil’s entrance onto the world stage as a modern nation with strong democratic—and emerging social democratic—foundations.
Combining survey methods with a range of ethnographic interviewing and observational techniques, we conducted fieldwork in the three cities of Recife, Rio de Janeiro, and São Paulo. In Year 01, we conducted a structured household survey with approximately 400 respondents in each of the three cities (yielding a total sample of just over 1,200). In Years 02 and 03, we conducted a range of ethnographic studies to delve deeply into daily life experiences and emergent subjectivities, including open-ended interviews with adult family members of different generations and key community figures such as business owners, neighborhood association leaders, church leaders, local activists and artists, and local elites.
In a separate article (Klein, Mitchell, and Junge Reference Klein, Mitchell and Junge2018), we review the contentious debates about the category “new middle class” and present a conceptual framework for understanding experiences of socioeconomic mobility and class subjectivities among the emergent demographic sector to which this moniker has sometimes been applied. In this research note, we present the methodology and resultant dataset for our Year 01 household survey, called Brazil’s Once-Rising Poor (BORP) 2016 Survey. With publication of this research note, we make the BORP 2016 Survey dataset publicly available. Footnote 1 We intend our detailed methodological account to be a resource for social scientists doing neighborhood-based survey research in other contexts, and the dataset to be of use to researchers examining relationships between economic and political change in Brazil and beyond. In particular, we wish to highlight the advantages our data offer researchers for understanding the experiences of a crucial Brazilian population during the short and pivotal period in Brazilian history between the fall of the left-wing PT governments and the rise of the hard-right Bolsonaro government.
Focused theoretical attention to a sector of the population experiencing extended socioeconomic flux reveals certain limitations of region-wide omnibus surveys typically seen in mass behavior research, such as those conducted by the Latin American Public Opinion Project (LAPOP) or Latinobarometer. First, the general preoccupation with constructing nationally representative samples in omnibus surveys means that these samples may contain too few poor and working-class respondents to generate efficient or reliable estimates of this target population. Second, while standard items on such surveys allow one to probe certain conventional, demographic aspects of socioeconomic status (e.g., income, education, occupation), they often do not address the broader range of themes germane to a holistic account of class and political subjectivities during an historical moment of poverty reduction and diverse socioeconomic mobilities (Oxhorn and Jouve-Martín Reference Oxhorn and Jouve-Martín2017).
In the first section, we recount the process of implementing our study in real, historical time, reflecting on the challenges of maintaining a critical and ethnographic perspective on class relations and labels that were intensely contested at the time, while also developing the sampling and recruitment strategy for an empirical, structured survey. Next, we introduce our household survey sample, highlighting key variables likely to be of interest to Latin Americanist scholars. Rather than summarizing all variables measured, we establish the demographic profile, mobility experiences, and political values, attitudes, and behaviors of our sample. Our goal here is not substantive analysis or explanation, but rather to introduce Latin Americanist audiences to a valuable new primary data source, BORP 2016. The portrait that emerges for this sector is one of economic precarity, heterogeneous experiences of socioeconomic mobility (and nonmobility) over the past two decades, and significant alienation from formal politics. Our methodology and data have particular promise for shedding light on certain aspects of Brazil’s electoral shift to the political right in 2018, after a long period of left-wing governance. Certain causes of that electoral shift are beyond the scope of these data, such as the electoral preferences of elites, and the political maneuvers of the judiciary. We believe, however, that this database offers a wealth of material for those who seek to understand the apparent openness among many poor and working-class Brazilians to Rio de Janeiro politician Jair Bolsonaro, a hard-right former military captain who won the presidency in 2018.
Defining the sample: Conceptual and methodological challenges
Conceptual debates about Brazil’s “new middle class”
Our project sought to examine the political subjectivities and broader lifeways of poor and working-class Brazilians who experienced various forms of mobility during the PT years. Operationalizing this aim, however, posed significant conceptual and methodological challenges. While the first generation of social-science scholarship on Brazil’s so-called new middle class (see Yaccoub Reference Yaccoub2011; Vicente Reference Vicente and Bartelt2013) inspired the genesis and initial planning for our project, we were aware of the contentious debates about how “new” and how “middle-class” this emergent demographic sector was (Neri Reference Neri2008; Souza Reference Souza2010; Pochmann Reference Pochmann2012; Vicente Reference Vicente and Bartelt2013). Our interest was not limited to those who had definitively experienced mobility in an upward direction, but extended to people who felt their lives during the PT years hadn’t changed much, or had gotten worse. Thus, when we made use of the category “new middle class” in early project dialoguing and planning, it was always ambivalent and provisional, and we often made recourse to terms such as “poor” (pobre), “working class” (classe trabalhadora), and “popular class” (classe popular) as alternatives (even as each of these brought its own presuppositions and implied exclusions).
Our interest in mobility was also complicated by the chronology of our project’s initial planning (2013–2014) and its eventual funding and implementation (2015–2018). While conceptual development and preparation of grant applications took place while Brazil’s prospects were still favorable overall, grant funding and making concrete implementation plans for our project’s objectives and methodology unfolded when Brazil was sinking into profound economic and political crises, widely regarded to have begun in June 2013 with a series of protests in all major cities. The protests initially galvanized around bus-fare increases but eventually encompassed a much wider range of concerns, including government expenditures for the World Cup and Olympic Games and corruption scandals among national politicians. By the time we initiated data collection (June 2016), the economic crisis had become severe, and a rollback of progressive social and economic policies was beginning amid the impeachment (regarded by many as a soft coup) of President Dilma Rousseff of the Workers’ Party. Apathy for all things political and frustration over increasingly precarious conditions of daily life among Brazil’s poor and working classes intensified, as many who had experienced upward mobility now fell back below the poverty line. Indeed, by the time we prepared our project’s Year 01 data collection protocol (a cross-sectional household survey), the category “new middle class” no longer objectively described our project’s target population. To capture the crisis moment in which our project was inaugurated, we increasingly employed terms such as “previously poor,” “previously ascendant,” and “once-rising poor.” Footnote 2 Our overall research question evolved from “What are the political subjectivities of Brazil’s ‘new middle class’?” to “How do poor and working-class Brazilians whose lifeways were shaped by social, economic, and geographic mobility and nonmobility understand themselves as political and economic actors at a moment characterized by political crisis and deepening economic precarity?” We view this evolution as a major strength of our project, as few empirical studies have considered the changing livelihoods and political sensibilities of Brazil’s “new middle class” in the period that followed long PT governance. Footnote 3
Statistical considerations for sampling
We faced challenging methodological concerns as we developed the sampling strategy for our Year 01 household survey, taking into consideration the various forms and directions of mobility. The intent for this survey was to produce statistically generalizable claims regarding the political values, attitudes, behaviors, and broader lifeways of individuals and households from Brazil’s once-rising poor. We treat this group as a “super-population” (i.e., as a larger, size-unspecified population from which to draw a study sample).
Some assumptions that the approach makes about the scope and homogeneity of the target population need to be addressed. Our interest was national in scope, insofar as the massive poverty reduction that had taken place in Brazil was countrywide and stimulated by federal initiatives (e.g., Bolsa Família, increases in minimum wages, expanded pensions, etc.). Yet, given the profound impact of geographic region on the everyday lives and future prospects of Brazilians, and the distinctive character of all major Brazilian cities, we were aware of the possible problems in conceptualizing our eventual sample of 1,200 respondents as a subsample of a broader national population. Having chosen three cities for fieldwork—each notoriously specific in its history and in the makeup of its residents and urban geographies—we did not conceive of our sample as representative of “urban Brazil.” Moreover, while each city has its own particularities, they are not homogeneous urban centers. Further, as anthropologists, we were interested in the lifeways of individuals along with their families and the physical spaces and communities meaningful to them. Accordingly, we made an initial decision to integrate recognized neighborhoods into our sampling strategy (rather than sampling randomly at the level of the city).
Acknowledging these limitations of a super-population approach, the sampling strategy used census tracts to construct “sampling areas” in each city—geographic units consisting in contiguous census tracts and typically overlapping with one or more recognized neighborhoods. We used census data from 2010, a moment that capped a decade of rising household incomes nationally, to identify settings for data collection in 2016 (by which time those trends had dissipated entirely).
Sampling frame and recruitment
With the above considerations in mind, we set out to identify neighborhoods in which we could reasonably expect to find high proportions of our study population, that is, “once-rising poor” Brazilians who had experienced a range of mobility forms and trajectories, including but not limited to economic mobility out of poverty. We defined the poverty line following the model used by the Brazilian Institute for Applied Economic Research (Instituto de Pesquisa Econômica Aplicada, or IPEA), a public institution that provides technical support to the federal government’s fiscal, social, and economic policy. Footnote 4 This model is based on how many monthly minimum salaries make up total household income and establishes the upper limit of the “absolute poverty line” to be per capita income of half of one minimum salary (see Barros et al. Reference Barros, Foguel, Ulyssea and Turra2006). As the 2010 monthly minimum salary was R$510 (about US$234), the poverty-line cutoff for per capita income was R$255, or about US$120. To identify census tracts with robust representation from both sides of this line, we used the income-based classificatory system employed by the Brazilian federal government’s Secretariat for Strategic Subjects (Secretaria Especial de Assuntos Estratégicos, or SAE), which is closely aligned to the IPEA system. Within the SAE system, the categories most overlapping with the study population we sought were “vulnerable” (vulneravel) and “lower middle class” (classe média baixa). These categories concentrate below and above the poverty line, respectively, and correspond to monthly per capita income ranges of R$133–239 (approximately US$75–136) and R$240–362 (approximately US$137–206). Footnote 5 To be clear, this was not a filtering mechanism for respondents. It was a criterion applied to identify neighborhoods where we could reasonably expect to find robust representation of once-rising poor Brazilians, knowing full well that such neighborhoods would also likely be home to families whose per capita incomes placed them in other SAE categories (e.g., “extremely poor” and “upper class”). Hence, we fully expected that the income profile of our resultant sample of respondents would disperse beyond the “vulnerable” and “lower middle-class” strata, and we viewed this as a desirable sampling outcome given our interest in the broader profile of neighborhoods in which the once-rising poor reside, as well as our interest in understanding changing class relations. It is also worth noting that the SAE categories overlap with, but do not directly correspond to, letter-based labeling systems frequently used in Brazil by economists and market researchers and in popular parlance. Footnote 6
To identify census tracts in each city within which the mean per capita income fell within the “vulnerable” and “lower middle-class” categories, we used data from the Brazilian Institute of Geography and Statistics (Instituto Brasileiro de Geografia e Estatística, or IBGE, 2022), the agency responsible for the census and other important national household surveys. Footnote 7 We then excluded tracts with incomplete data and tracts with extreme income inequality (which could produce income averages within our desired range but proportionately few lower- or middle-income households). We also sought areas that reflected the diversity of neighborhoods in which once-rising poor Brazilians might reside. Application of the above criteria netted 5,001 eligible census tracts between the three cities, from which we drew to construct our sampling areas.
Allowing a 5% margin of error, a 0.25 standard deviation, and a 95% confidence interval, and contemplating a conservative design effect to account for the multistage sample design and expected completion rate of 90%, we determined that a minimum sample size of 384 households in each city (rounded up to 400) was necessary for our sample to be statistically generalizable. Hence, we aimed for a total sample size of 1,200 respondents representing 400 households in each of the three cities. Census tracts were sampled to ensure the minimum sample size for each city, aiming for a fixed sample of ten households per census tract and resulting in a total of forty census tracts sampled per city.
In each city, we set out to construct four sampling areas, each made up of ten census tracts. We began by identifying qualifying census tracts (defined as falling within “vulnerable” or “lower middle-class” income categories) situated in four diverse neighborhoods within the given municipality, and aiming for variation in terms of topography, distance from the downtown center, and neighborhood history and character. We also considered neighborhoods’ suitability for planned ethnographic research components (initiated during Year 02). After identifying the first tract in each sampling area, we then moved in an outward, clockwise direction to add additional “vulnerable” and “lower middle-class” tracts until reaching a total of ten tracts per sampling area. The resultant sampling areas have different proportions of “vulnerable” and “lower middle-class” tracts and frequently have “holes” (census tracts that are either above or below the vulnerable/lower-middle-class income parameters or that fail to satisfy other inclusion criteria). Physical size, population size, and types of housing structures (e.g., stand-alone house vs. apartments) vary between and within census tracts, leading to sampling areas of different configurations. In some instances (for example, in areas with low populations or security concerns), it wasn’t possible to meet sampling targets within a census tract. Hence, some sampling areas ended up consisting of more than ten census tracts.
To recruit a representative sample of ten respondents per census tract, we divided each tract into blocks and randomly selected two blocks within which to recruit five respondents. Beginning recruitment within each block at the household closest to a randomly determined geographical point, we then moved five households to the left until we reached the target of five confirmed respondents. Footnote 8 Although the category “head of household” is frequently used in neighborhood surveys (and by IGBE), the complexity of family structure in our sampling areas made such a category unviable. In all cases, we interviewed an adult household member who claimed knowledge of the whole household.
Survey instrument and analysis
Interviews were carried out within respondents’ households and began with oral consent. Administered using tablet-based Computer-Assisted Personal Interview (CAPI) technology, interviews lasted approximately one hour and used a piloted, structured instrument with mostly quantitative questions divided into these twelve thematic sections: (1) demographic characteristics and household composition; (2) income and employment; (3) credit and debt; (4) socioeconomic mobility; (5) class label identifications; Footnote 9 (6) political values, attitudes, and behaviors; (7) use of media; (8) health; (9) social programs; (10) food; (11) consumer practices and household expenditures; and (12) travel and leisure. Questions focused on both the individual respondent and their broader household. In each city, interviews were conducted by a team of local university students and community members trained by the corresponding principal investigator and field supervisor.
Urban contexts for data collection
Each of the three cities where we collected data are major political and economic centers and nationally important hubs for cultural production. In this section, we briefly compare the cities with respect to quantitative measures of quality of life, security and violence, income inequality, and cost of living, followed by descriptions of the neighborhoods where our sampling areas were located. Basic socioeconomic characteristics for each municipality are presented in table 1. The three localities are similar across many characteristics, most notably the Human Development Index and the level of income inequality, though data indicate that Recife has somewhat lower HDI and is more unequal than São Paulo or Rio de Janeiro. Although GDP per capita varies considerably across cities, the cost-of-living-adjusted figures indicate that such differences are smaller than they initially appear. Indeed, adjusting by market housing prices nearly eliminates the difference between Recife and Rio de Janeiro and accounts for half of the apparent difference between Recife and São Paulo. Having profiled each city in this way, we reiterate that our sampling areas were not constructed to be representative of the municipalities in which they were located. As explained earlier, each city’s four sampling areas were devised to capture intracity variation and different profiles of what once-rising poor neighborhoods can look like.
Table 1. Economic characteristics of cities in BORP sample.

Sources: IBGE and IPEA. GDP per capita (real 2000 dollars) is the total 2016 municipal GDP per capita divided by 12 to reflect monthly salaries. Population data are from the 2010 census. All other figures are from 2016. GDP per capita is adjusted for cost of living based on housing prices using the December 2016 Índice FipeZap de Preços de Imóveis Anunciados provided by the Fundação Instituto de Pesquisas Econômicas (Fipe/USP). IPEA for PIB/cap: http://www.ipeadata.gov.br/Default.aspx; Gini: http://tabnet.datasus.gov.br/cgi/ibge/censo/cnv/ginibr.def; HDI: https://www.br.undp.org/content/brazil/pt/home/idh0/rankings/idhm-municipios-2010.html; Índice FipeZap: https://www.fipe.org.br/pt-br/indices/fipezap/#indice-mensal.
Each of the four Recife neighborhoods in which surveys were administered was located in a different municipal zone: Vasco da Gama, located in the hillside periphery of the mixed-class northern zone; Imbiribeira, located adjacent to affluent beachside neighborhoods; Ibura, located in the distant reaches of the southwestern zone; and Torrões, located in the flat, working-class center of the western zone, adjacent to the federal university campus. In Rio, surveys were conducted in two large favelas in the industrial northern zone (Borel, near upper-middle-class neighborhoods, and Complexo do Alemão, mostly surrounded by working-class neighborhoods); one large northern zone neighborhood (Madureira, including parts of Turiaçu, Rocha Miranda, and Osvaldo Cruz); and one large western zone neighborhood (Padre Miguel). In São Paulo, survey data was collected in different areas of the massive, mixed-class southern zone. A distinguishing characteristic of the Zona Sul is its concentration of Afro-descendant Brazilians. According to 2010 census data, pretas and pardas represent 56% of the population of the M’Boi Mirim District (which includes our Jardim São Luis and Jardim Nakamura sampling areas), and 49% in the Campo Limpo District (which includes our Parque Regina project neighborhood). In all three cities, the neighborhoods overlapping with sampling areas have a higher percentage of pardas and pretas than the city as a whole; however, this contrast was more accentuated in São Paulo.
Results
Sample characteristics vis-à-vis SAE income categories
A total of 1,204 individuals were interviewed, with proportionate representation from Recife (n = 397, 33.0%), Rio de Janeiro (n = 409, 34.0%), and São Paulo (n = 398, 33.1%). To gauge the success of our efforts to portray the residents of neighborhoods with robust representation of once-rising poor Brazilians, we looked at income in three ways. First, we compared median per capita household income for the entire sample (R$600 or US$173) to the 2016 poverty-line threshold, measured as half a minimum salary (R$440 or US$127). Footnote 10 Second, we looked at the distribution of household per capita incomes across the SAE categories, looking for concentration within “vulnerable” and “lower-middle class” subgroups (see figure 1). Third, we compared mean incomes for survey respondents from each sampling area to corresponding census-data figures for each entire sampling area. Specifically, we calculated mean respondent income for each sampling area (survey sample) and compared these figures to corresponding population-weighted income means (table 2).
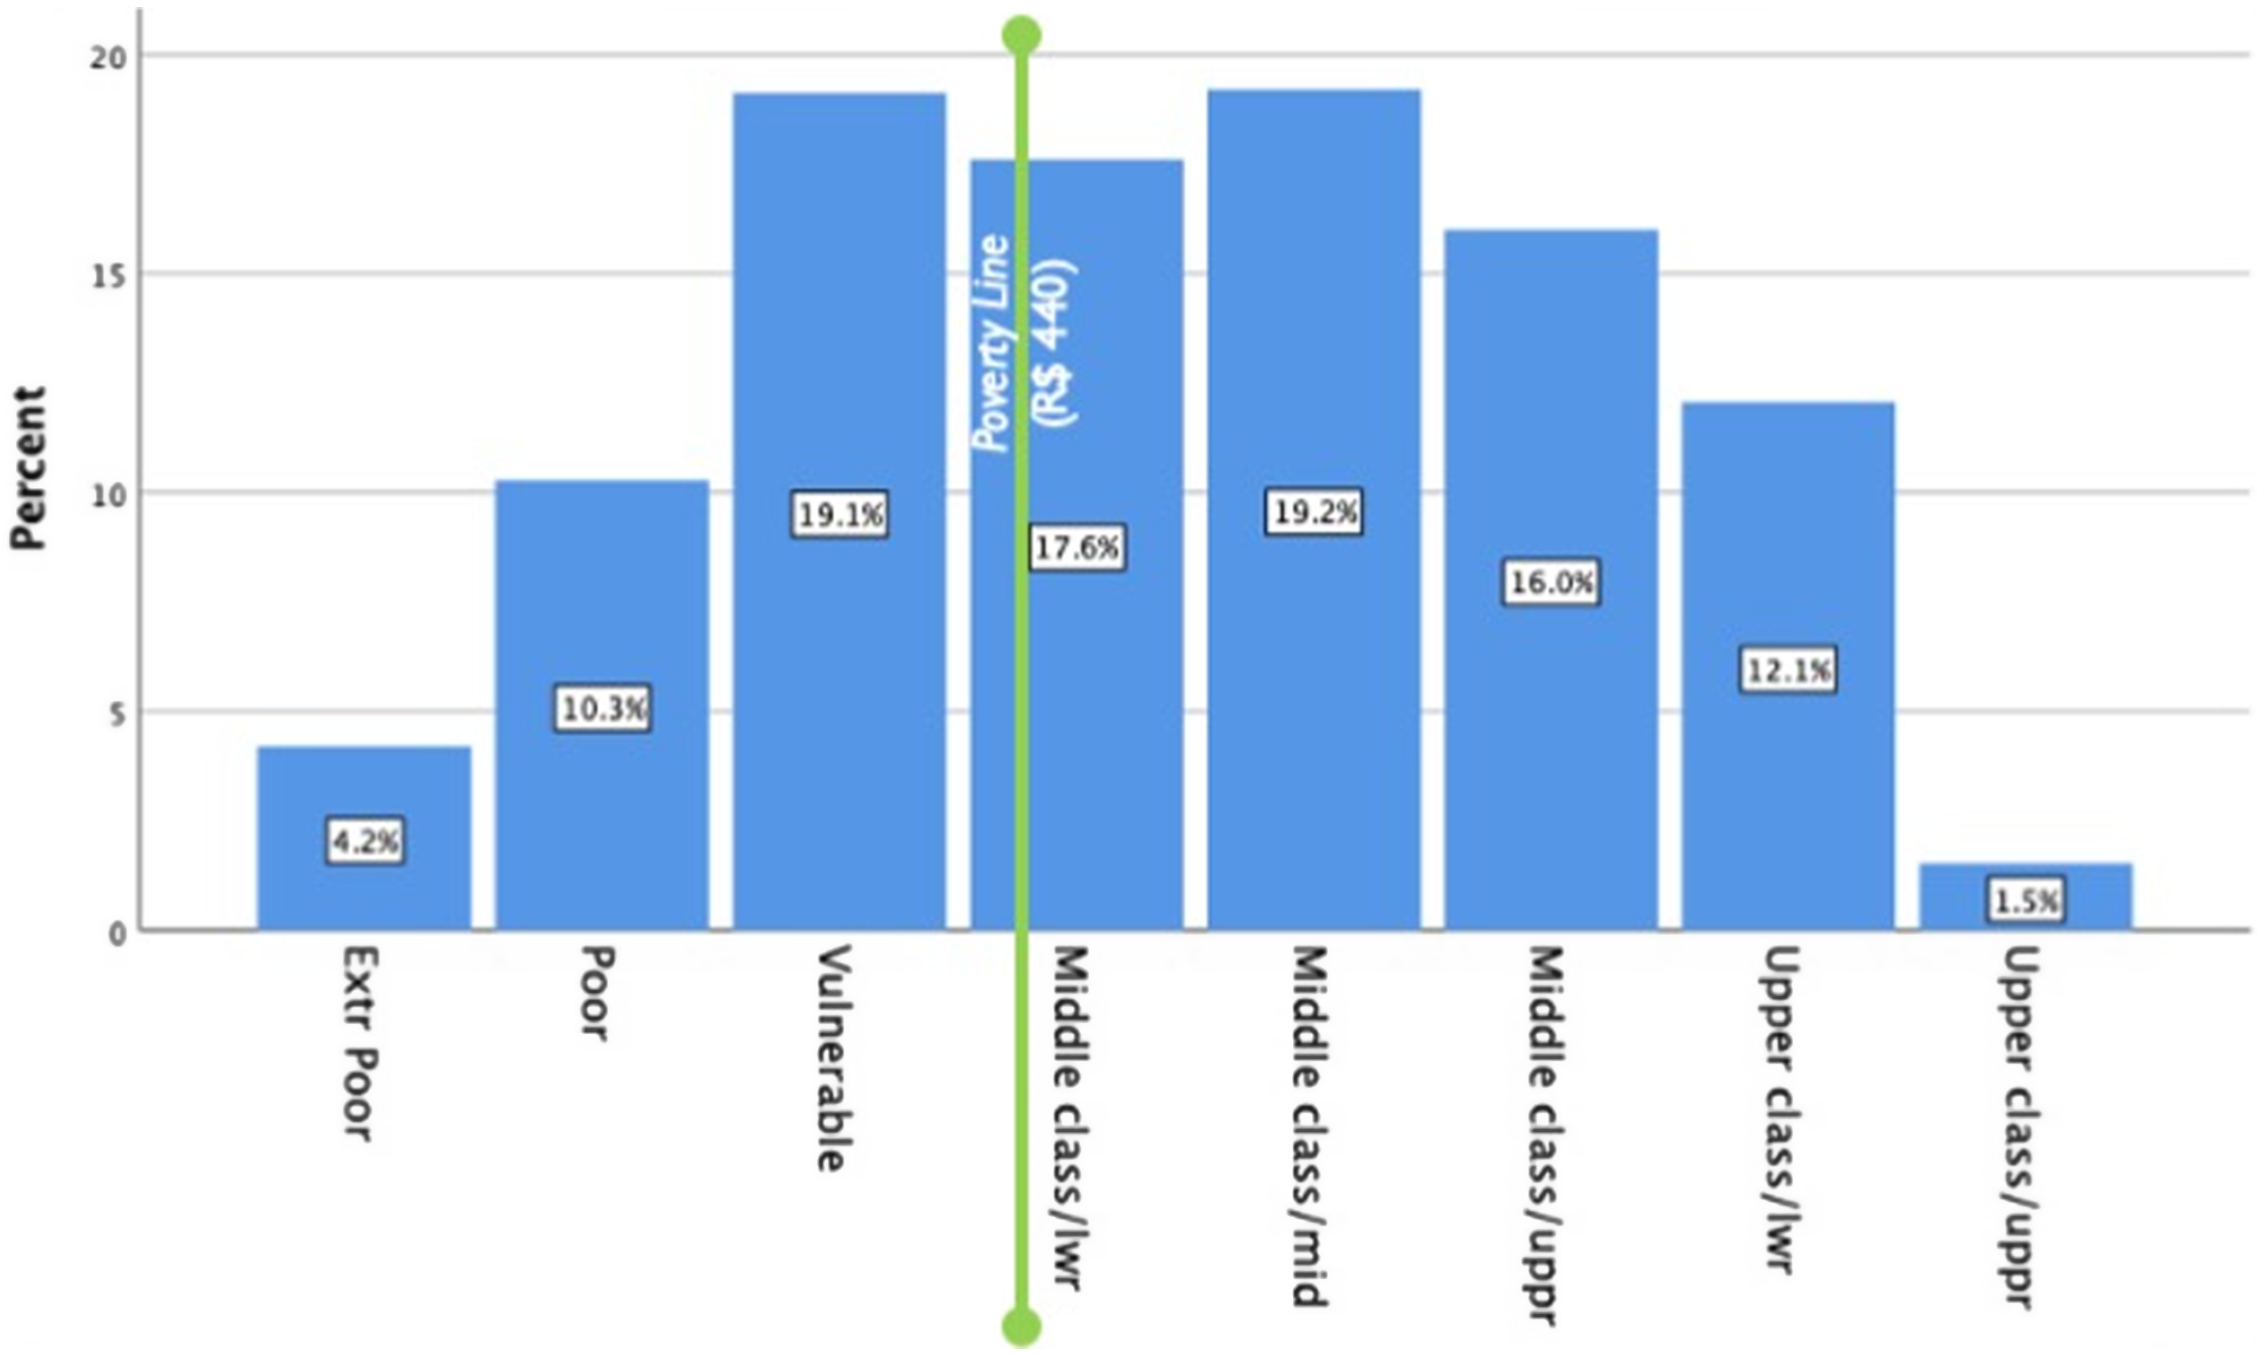
Figure 1. Study sample (n = 1,204) mean per capita household income (SAE categories).
Table 2. Mean adult income by city and sampling area.
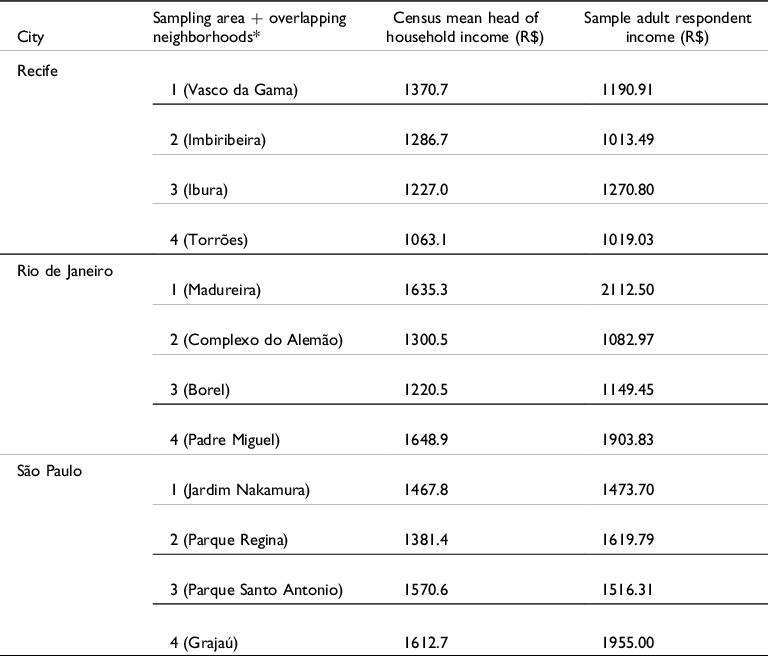
* For each sampling area, we include the name of the recognized neighborhood that most overlaps.
While there exist no definitive criteria for operationalizing “once-rising poor” (since the term encompasses a range of possible incomes and mobility trajectories), we were nonetheless encouraged that fully 82.2% of our sample fell into “poor,” “vulnerable,” and “middle-class” subgroups—groups that we would expect to find represented in neighborhoods where poor and working-class people experienced diverse mobility experiences (including downward) during the PT years. The presence of higher-income residences (i.e., in “upper-class” subgroups) in neighborhoods mostly regarded as peripheral, poor, or working-class is not surprising and reflects the heterogeneity of class geographies in Brazil’s urban landscapes. Hence, we would expect median income for our survey sample to be higher than the poverty line (and indeed it is).
By and large, the comparisons of sample-estimated and census mean income in each sampling area (table 2) indicate the strategy was successful in capturing poor and working-class neighborhoods with large numbers of our target study population (despite differences in identifying “heads of household” and “adult respondents,” as described above). There are, however, differences between the income levels found by the census and by this survey. This may reflect the socioeconomic diversity of each neighborhood, including people working in small businesses, professionals, skilled and unskilled laborers in both formal and informal sectors, and many people without remunerative employment.
Demographic and household characteristics
Demographic characteristics of the study sample are presented in table 3. Mean age was 45.8 years old, with respondents’ ages ranging from 18 to 88. Women were notably more represented in our sample than men (59.4% vs. 40.5%, respectively). More than two-fifths of respondents (43.6%) were high-school graduates, and 55.8% reported higher educational attainment than both of their parents. Slightly less than half (47.0%) of respondents identified as practicing Catholics, and 34.8% identified as practicing Evangelicals (including both Pentecostal and Neo-Pentecostal varieties of Evangelical Christianity). Other active religious practices (Afro-Brazilian, Spiritist, etc.) were reported by small numbers (less than 5%).
Table 3. Demographic and household characteristics.

With respect to race—for which we used Brazilian census categories branca (white), preta (Black), parda (Brown), amarela (Asian), and indígena (Indigenous)—more than three-quarters of respondents selected an option other than “white” (28.5% Black, 43.0% Brown, and 3.2% Asian or Indigenous).
Our overall sample of respondents is both older and more female than the national profile, likely because recruitment and interviews took place in the daytime, when working-age men are less likely to be home. (The high prevalence of violent crime in all three cities made nighttime recruitment impractical.)
Residence characteristics
Residence characteristics are presented in table 4. Overall, a large majority (82.8%) of respondents live in what they consider to be houses. Thirty-seven percent of respondents live within or adjacent to favelas (as characterized subjectively by interviewers). The mean number of residents living in the respondent’s household at the time of the interview was 3.4 (slightly lower than the 2010 national average of 3.84). Footnote 11
Table 4. Residence characteristics.

Employment status and work
Results related to employment status and work type are presented in table 5. Nearly half (48.6%) of our sample reported having worked for pay during the prior thirty days. Unemployment (not having worked in the past thirty days and presently seeking a job) was reported by 10.9% of respondents (slightly lower than the 2016 national average of 11.5%). For the employed subsample, work in the informal sector was somewhat higher than in the formal sector (55.0% vs. 43.6%, respectively). Of currently employed respondents, 35.1% reported having a “signed work card” (carteira assinada), which guarantees a variety of workers’ rights. Not surprisingly, this figure is notably lower than the national average (57.9% in 2014). Footnote 12
Table 5. Employment status and work.

With fewer than half of respondents reporting current employment and a minority of those working in the formal sector with a signed work card, the labor profile that emerges from our data appears to be one of precarity, bearing little resemblance to the conventional image of the middle class, as long argued by critics of the asserted emergence of a “new middle class.”
Income, mobility patterns, and class identifications
Results related to income, socioeconomic mobility patterns, and class label identifications are presented in table 6. Mean monthly household and per capita incomes were R$2333.6 and R$828.5 (approximately US$671 and US$238 at 2016 conversion rates).
Table 6. Income, socioeconomic mobility pattern, and class identifications.
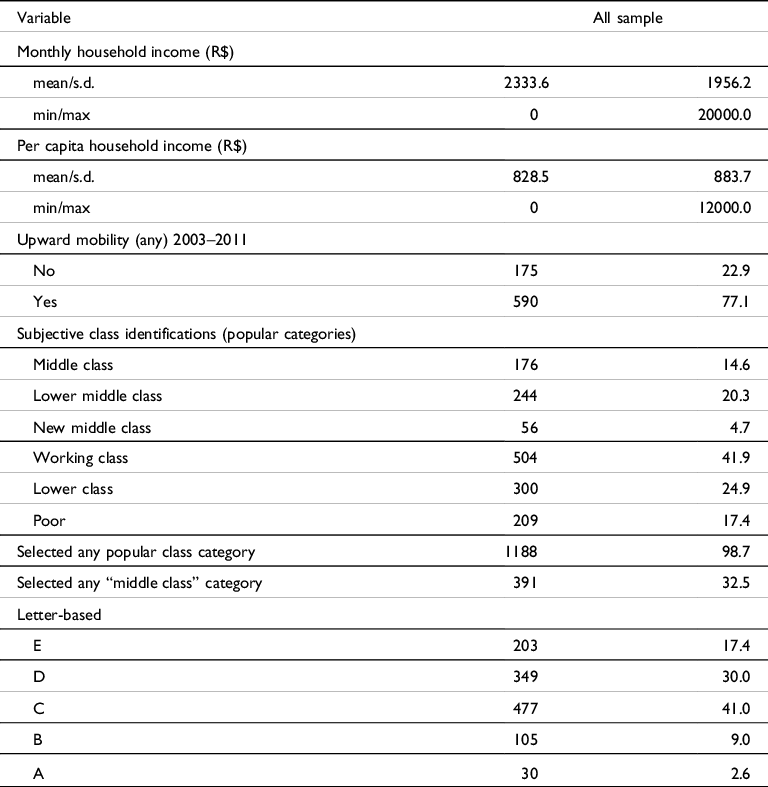
We asked respondents aged at least thirty-six to consider their families’ mobility patterns during the period 2003–2011 (the economic boom period associated with the PT years) in terms of household financial situation, overall quality of life, and perceived position on a social hierarchy. Here we present a consolidated aggregate of these measures. We found that 77.1% of respondents recounted experiencing at least one form of upward mobility. When presented with a series of popular (not mutually exclusive) class labels, the three categories for which identification was most commonly indicated were “working class” (41.9%), “lower class” (24.9%), and “poor” (16.4%). Although 32.5% of respondents identified with at least one label containing the words “middle class,” significantly fewer (4.7%) identified with the category “new middle class.”
We are not surprised that more than three-quarters of our respondents recollected at least one form of upward mobility during 2003–2011—a period associated with economic ascendance for poor and working-class Brazilians. Yet nearly a quarter did not recollect any upward mobility, which we take as an important reminder that the boom years associated with the PT administrations were, for some poor or near-poor Brazilians, not remembered in 2016 as years of improving prospects in terms of financial situation, quality of life, or position in the social hierarchy. In preliminary analysis (data not shown), we have also confirmed that the recollection of upward mobility does not vary by income level (or corresponding SAE category).
It is somewhat striking that a minority of respondents indicated identification with any single popular class label. Indeed, other than “working class” (which garnered identification from 41.9%), no label was selected by more than 30% of respondents—including labels containing the words “middle class.” Perhaps most conspicuous is the extremely infrequent identification with the label “new middle class,” a finding that could reflect the moment at which we conducted the interviews (already several years into the crisis) and respondents’ ambivalent relationship to a category celebrated by economists, marketers, and policymakers.
Civic participation and political interest
Data related to civic participation and interest in politics are presented in table 7. Among respondents, about a fifth (21.7%) reported participation in at least one form of civic activity, from a list of fifteen, during the preceding twelve months. Participation in at least one social movement was notably rare (5.7%), as was participation in a protest or demonstration since 2013 (7.3%). Interest in politics was also low, at 18.9%. In comparison to the 2016/17 round of the Americas Barometer survey in Brazil, these rates are lower than national averages, which indicate higher rates of protest (14.2%), political movement/party (22.5%), and more general civic participation (82.5%), as well as higher political interest in general (22.7%). Footnote 13
Table 7. Civic participation and political interest.

The profile of civic participation and interest that emerges here is one of relative disengagement from formal politics, characterized by nonparticipation in conventional civic activities by more than three-quarters of our sample and extremely low reported membership in social movements or civic protest experience during the crisis period. Moreover, markedly low levels of political interest suggests deep alienation from formal politics among Brazil’s once-rising poor. However, we found that 55.7% used Facebook and 62.5% WhatsApp in 2016. Just two years later, these media were the conduit of a social media campaign that was crucial to Jair Bolsonaro’s 2018 election. So, despite a disengagement from conventional civic and political activities, many people in this population were exposed to forms of political engagement through these nontraditional media.
Final considerations
Our detailed account of methodological development and implementation reveals the challenges of sampling communities subject to mobility when the categories used to quantify mobility are themselves contested and the period during which mobility ostensibly occurred has passed. Our findings suggest a “once-rising poor” that is precarious in its material conditions, in its identification with popular class labels, and in its civic engagements. These findings are compatible with an established scholarly critique (Souza Reference Souza2010; Pochmann Reference Pochmann2012; Vicente Reference Vicente and Bartelt2013; Kerstenetzky, Uchôa, and Silva Reference Kerstenetzky, Uchôa and Silva2015) of the label “new middle class” for describing either the material life conditions or class identifications of poor and working-class Brazilians who experienced different trajectories of mobility during the boom years associated with the PT administrations.
In future analysis, it will be crucial to assess (through regression modeling) how well differences in lifeways, material conditions, and attitudes among our pool of respondents can be explained by geography (city, sampling area, etc.), demographic characteristics (gender, race, age, etc.), mobility experiences, income, and employment, among other possible factors.
For our overall study sample, there are three major findings. First, our results suggest a heterogeneous profile of mobility experiences recollected by once-rising poor Brazilians for the boom years associated with the early PT administrations. As we have shown, nearly a quarter of our sample recollected no experience of upward mobility (in terms of financial situation, quality of life, or position in the social hierarchy) for the PT years. In this article, we have not presented our data on mobility recollections for the subsequent crisis period, though of course a more nuanced account of socioeconomic mobility patterns—especially vis-à-vis political attitudes—requires careful consideration of sequences and directions of recollected mobility in order to predict political values, attitudes, and behaviors. For example, do once-rising poor Brazilians whose lives improved in concrete ways during the growth years express affinity for the PT and, more generally, for the redistributive policies associated with leftist politics? Or, instead, does upward mobility during the PT years followed by downward mobility during the subsequent crisis period predict a particularly strong rancor toward the PT, for leftist policies and politicians, and even for democracy itself?
The second major finding is the clear pattern of nonidentification with popular class labels among a majority of respondents. Class identifications are prevalent (with “working class” indicated by more than two-fifths of our sample), but labels including the words “middle class” were indicated somewhat less frequently (32.5%) and “new middle class” very infrequently. Given the economic precarity that people in much of our sample face and the distance from the idealized, relatively well-off conventional middle class, that 32.5% identified in some way with the category “middle class” is surprising. More sophisticated analysis is needed to determine the correlates of class identification. For example, income, media exposure, consumer practices, or recollected mobility patterns may predict class label identifications. Our ethnographic dataset, which examines these themes in the everyday-life contexts of home, work, and leisure, will also be crucial to shed light on the complicated cultural logics underlying class identifications.
Finally, our survey has revealed a once-rising poor whose degree of political interest and civic engagements are decidedly low, although political engagement on social media has increased since we performed our survey. Indeed, the low levels of formal civic participation, social movement membership, and participation in public protest reported for our study sample—not to mention extremely low levels of interest in politics—suggest (although by no means prove) that massive poverty reduction during the PT years, and the PT’s wide popularity among the poor and working classes during most of those years, did not, in any straightforward way, produce a durable popular consensus in favor of redistributive politics. Deeper analysis of this survey dataset has great potential to contribute to an understanding of the openness among many poor and working-class Brazilians to hard-right politician Jair Bolsonaro, who beat his PT rival in 2018 to win the presidency.
Although we had no idea as we were conducting our survey, it was carried out during a moment in Brazilian history that proved unique and pivotal: the interim period between governance by the center-left and by the hard-right in Brazil. After the politically motivated removal of Dilma Rousseff from power, Brazil underwent a national return to austerity politics by nondemocratic means. This period, presided over by the center-right Michel Temer, was characterized by a rollback of progressive federal policies, a constant drumbeat of corruption accusations in mass media, and coordinated social media campaigns against politicians in general—and the left, in particular. The group studied in this survey, the once-rising poor, were the crux of the PT’s claim to be transforming Brazil. At the end of this period, with the politically motivated imprisonment of the 2018 front-runner, the PT’s Lula, large numbers of this population shifted support from the PT to the hard right. Our survey offers promising avenues of analysis for researchers seeking to understand this crucial population and this decisive historical moment.
Acknowledgements
This project was supported through a three-year collaborative grant from the National Science Foundation (grants 1534606, 1534621, and 1534655). Our research protocols were approved by institutional review boards at each principal investigator’s university (Junge: State University of New York at New Paltz, Human Research Ethics Board, protocol no. 2015-070; Klein: Portland State University, Human Research Protection Program, protocol no. 153436; Mitchell: Rutgers University, Office of Research and Regulatory Affairs, protocol no. 15-691M).
Principal investigators Junge, Klein, and Mitchell gratefully acknowledge the labor and dedication of their respective research teams in Recife, São Paulo, and Rio de Janeiro, as follows. Recife: Rodrigo Vieira de Assis (field coordinator); Gilson José Rodrigues Junior and Jailma Maria Oliveira (supervisors); and Ábia Marques Pinheiro de Lima, Amanda Martha Campos Scott, Ana Carla do Carmo, Ana Carolina Silva Cordeiro, Antonio Marques Silva Lima, Conceição de Maria Carvalho Moura, Felipe de Carvalho Souza, Gilberto Romeiro de Souza, Marília Gomes do Nascimento, Mônica Pedrosa Rangel, Nathielly Darcy Ribeiro Araújo, Pollyana Marthina de Barros da Silva, Rebecca Botelho Portela de Melo, and Sidney Oliveira Santos Filho (interviewers). São Paulo: Milena Mateuzi Carmo, Andréa Arruda Paula, Luana de Oliveira, and Alessandra Kelly Taveres de Oliveira (supervisors); and Augosto Weinfurter Pereira, Carlos Adriano Mai Bezerra, Carmen Lucia Faustino, Cristiane Uchôa Pinheiro Primo, Dandara Gomes, Dennys de Souza, Douglas Macedo da Silva, Fabiana Ivo, Gabriela Dos Santos Ferraz, Izabela Nalio Ramos, and Maria Edijane Alves de Lacerda (interviewers). Rio de Janeiro: Jana Martins Leal (field coordinator); Bruno Coutinho de Souza Oliveira and Janine Targino da Silva (supervisors); and Carolina Bittencourt Mendonça, Cecilia G. Ribeiro, Daniel Soares Rodrigues, Maria Eduarda Ota, Marina Morena Rosa Alves, Mayara Ferreira da Silva, Fábio Pacheco Gomes da Silva, Pamella Liz Pereira, Pricila Loretti, Rita Gonçalo (interviewers).


 Open access