The period from conception to 24 months of age (first 1000 d) represents a window of opportunity for nutritional interventions promoting healthy growth( Reference Black, Victora and Walker 1 , Reference Bhutta, Das and Rizvi 2 ). To design interventions that prevent growth faltering and support health in low- and middle-income settings, it is important to understand the associations between nutritional status, mode of feeding and body composition in early life.
While anthropometric markers of growth (weight, height, mid-upper arm circumference (MUAC)) are widely used, few studies are able to differentiate the accretion of fat mass (FM) v. fat-free mass (FFM). FFM accretion indexes development of organ and muscle tissue, and infancy represents a critical period in this context, as the structure and function of organs and tissues is strongly contingent on the magnitude of hyperplastic growth. A study from Ethiopia, using air-displacement plethysmography to measure body composition from birth to 6 months, found low birth weight to be associated with low FFM at birth. A large variation in fat accretion was observed during the first 6 months( Reference Andersen, Girma and Wells 3 , Reference Andersen, Girma and Wells 4 ). Follow-up of the same cohort showed positive correlations between FFM at birth and height and child development at 2 years of age( Reference Admassu, Wells and Girma 5 , Reference Abera, Tesfaye and Girma 6 ). In general, greater weight gain in infancy is associated with greater adult height and FFM, whereas from early childhood, greater weight gain is primarily associated with greater adult FM( Reference Wells, Chomtho and Fewtrell 7 , Reference Kuzawa, Hallal and Adair 8 ). Muscle mass may potentially contribute both to immediate survival( Reference Briend, Garenne and Maire 9 ) and to long-term cardiometabolic health( 10 ).
The accretion of fat may also be important for short-term survival of children. A cross-sectional study reported that 3–18 months old Gambian infants overall had less FFM and FM than UK infants as measured by the 2H dilution technique. However, whereas the reduction in FFM of Gambian v. UK children increased with age, the FM difference decreased with age, suggesting that growth faltering affects FFM more than adiposity( Reference Wells, Hawton and Darch 11 ). In line with this, a study from Uganda found low levels of leptin, indicative of low FM, to be a predictor of mortality in children hospitalised with severe acute malnutrition (SAM)( Reference Bartz, Mody and Hornik 12 ).
The influence of breast-feeding on body composition has mainly been studied in high-income countries. A meta-analysis showed that breastfed infants accumulated more fat than formula-fed infants did during the first 8–9 months. However, at 12 months, formula-fed infants had a higher FM than breastfed infants( Reference Gale, Logan and Santhakumaran 13 ). There is also an increasing number of studies showing that the composition of breast milk has an effect on body composition in the infant and thereby suggesting mechanisms for an effect on growth( Reference Eriksen, Christensen and Lind 14 ). Differences in dietary protein content and quality are also suggested to play a role in the effects on early growth via stimulation of insulin-like growth factor-1 and insulin( Reference Koletzko, Kirchberg and Hellmuth 15 ).
In Cambodia, the prevalence of undernutrition among preschool children has remained largely unchanged for the past 10 years. The 2014 Cambodian Demographic and Health Survey concluded that 32 % of children under 5 years of age are stunted; 24 % are underweight and 10 % are wasted( 16 ). Thus, Cambodia still has an urgent need to prevent undernutrition in preschool children. The main objective of this paper was to assess the role of stunting, wasting and breast-feeding as correlates of FFM and FM in Cambodian children at the ages of 6 and 15 months. The hypothesis was that associations of stunting, wasting and breast-feeding with body composition changes with age.
Methods
Study design and ethics
This longitudinal study was nested in a randomised trial investigating the effect of four nutrition interventions on prevention of malnutrition (the WinFood study, ISRCTN19918531 http://www.isrctn.com/ISRCTN19918531)( Reference Skau, Touch and Chhoun 17 ). Children received the interventions from 6 to 15 months of age. The aim of the present study was to assess stunting, wasting and breast-feeding as correlates of body composition and to test whether such associations change with age. The four intervention groups were merged for this study and statistical analyses were adjusted for the interventions, as described below. The study was conducted according to the guidelines laid down in the Declaration of Helsinki and all procedures involving human subjects were approved by the National Ethics Committee for Health Research, Ministry of Health, the Royal Government of Cambodia (no. 151 NEHR) and a consultative approval was obtained from the National Committee of Health Research Ethics in Denmark. Written informed consent was obtained from all caregivers of participating infants, and the caregivers were informed that their child could leave the study whenever they wanted to.
Study site
The study was conducted from March 2011 to March 2012 in seven rural municipalities located in two operational districts (PeaReang and Sithor Kandal) in the Prey Veng province, south-east of Phnom Penh. Prey Veng is agricultural low-land, bordering the Mekong River and recognised to be vulnerable to food insecurity. Prevalence of stunting and wasting was similar to the national level.
Study subjects
All parents of single-born infants were given an invitation for their child to participate in the WinFood study if their child was born between 15 August and 15 December 2010. Children were recruited when they had reached the age of approximately 5·5 months. On the day of recruitment, infants were seen by a paediatrician and screened for severe wasting (weight-for-length z score (WLZ) <–3), pitting oedema, clinical signs of vitamin A deficiency or anaemia (Hb <80 g/l). If any of these signs were found, the infant was excluded and referred for treatment. Infants with a history of acute or persistent diarrhoea at recruitment were also given a treatment referral and invited for a new screening 2–4 weeks later. All infants were assessed on the recruitment day (a ‘6-month visit’) and 9 months later at a ‘15-month visit’.
Body composition
Body composition was assessed using the 2H dilution technique to measure total body water (TBW) and hence FFM and FM, following the protocol developed by the International Atomic Energy Agency (IAEA)( 18 ). Each infant was given an accurately weighed oral dose of 7 g 2H oxide (99·8 % 2H2O) (Cambridge Isotope Laboratories Inc.), which was kept at 4°C until use. The 2H kit consisted of a pre-weighed 2H2O dose in a 5-ml tube, a 10-ml syringe and a needle to draw the 2H2O from the tube to the syringe. The weight of the 2H kit before dosing was recorded to the nearest 0·01 g. Furthermore, two pre-weighed paper towels were used to absorb any spilled 2H2O. With the 10-ml syringe, the 2H2O dose was administered to the child who was seated on the lap of the mother, by one of the authors (J. K. H. S.). The 2H kit and the paper towels, if used, were weighed immediately after administration of the dose and the weight was recorded to determine the dose consumed, subtracting the weight of any dose spilled on the tissues. Saliva samples were collected by two nurses. A cotton ball was put in the mouth of the child for 3–5 min. A sewing thread was tightened around the cotton ball and hung out of the mouth of the child to prevent the child from swallowing the cotton ball. The wet cotton ball was removed from the child’s mouth and put into a syringe barrel, and the saliva was pushed into a 1·5-ml cryotube. Saliva samples were stored at –20°C until they were analysed for 2H2O enrichment at St Johns Research Institute, Bangalore, India. A pre-dose saliva sample was collected before giving the 2H2O dose and a post dose was collected 3 h after the 2H2O dose was given. 2H enrichment was measured by Fourier-transformed IR spectrometer (Shimadzu Corporation) and analysed by the software developed at MRC Dunn Nutrition Unit, Cambridge, UK. The instrument was calibrated with 2H2O standards, prepared in tap water, ranging from 100 to 2000 parts per million (ppm). Saliva samples were centrifuged before analysis and the clear sample loaded on a calcium fluoride cell (path length of 100 µm) without air bubbles. Enrichment of the pre-dose sample from the child was used for background correction of post-dose samples. The samples were measured in duplicate and the CV was <1 %. Inter-assay CV (of 1000 ppm standard) for the method was also <1 %. The calculations of FFM and FM based on 2H2O-enrichment results were undertaken by calculating the TBW in kg( 18 ):
 $${\rm TBW }\;\left( {{\rm kg}} \right){\rm {\equals}dilution\; space}\,/1\hskip-3pt\cdot\hskip-2pt041\hbox{;}\,$$
 $$\eqalignno{ {\rm Dilution\; space{\equals}}& ^{{\rm 2}} {\rm H\; dose\; given\; to\; child\; }\left( {{\rm mg}} \right) \,/\, \cr & {\rm enrichment\; in \;saliva\; }\left( {{\rm mg\,/\,kg}} \right)$$
The constant 1·041 was used to correct the isotope dilution space for non-aqueous proton exchange, when calculating TBW( 18 ). To calculate the FFM and FM:
 $$\eqalignno{ {\rm FFM{\equals}TBW\,/\,hydration\; factor; }\cr {\rm FM{\equals}} {\rm weight\; of\; child }\left\;( {{\rm kg}} \right){\rm -FFM }\;\left( {{\rm kg}} \right)$$
The FFM and FM were calculated individually and adjusted using specific hydration factors for sex and age of the child( Reference Fomon, Haschke and Ziegler 19 ). All children with percentage FM <5 % were further reviewed and checked with field notes regarding any problems during the act of administering the 2H2O to the child. In case of any uncertainty regarding the amount of 2H2O dose consumed by the child, the child’s results were excluded from the analyses.
The fat-free mass index (FFMI) and the fat mass index (FMI) were calculated by FFM/length2 (kg/m2) and FM/length2 (kg/m2), respectively. These indices express FFM and FM normalised for length and are expressed in the same unit as BMI. Both FFM and FM and the corresponding indices FFMI and FMI were reported as body composition outcomes. It was anticipated that stunting, which only affects length, and wasting affecting weight-for-length could show differential correlations to body composition indicators with and without normalisation for length.
Correlates
All anthropometric measures were recorded by the same four field assistants who had been trained according to the WHO child growth guidelines( 20 ). All measurements were performed once by two different assistants and the mean measurement was used in the analysis. Weight was measured using an electronic scale (SECA scale) and recorded to the nearest 100 g. Length was measured to the nearest millimetre on locally produced length boards. Both SECA scales and length boards were borrowed from World Food Programme, Cambodia. Anthropometric z scores, length-for-age z score (LAZ) and WLZ were calculated based on WHO’s 2006 Child Growth Standards( 21 ), using WHO Anthro version 3.1( 22 ). In addition, triceps and subscapular skinfolds were measured with a Harpenden skinfold calliper (Baty International) to the nearest millimetre. If MUAC or skinfold measurements differed by more than 5 and 2 mm, respectively, both assistants had to repeat the measurement.
Breast-feeding status was determined both at the 6- and 15-month visit. To estimate whether the child was still breastfed, the question ‘Since this time yesterday, has the child been breastfed?’ was asked. In addition, a few socio-demographic variables were obtained at the 6-month visit.
Statistical analysis
Data were double-entered in Epidata version 3.1 (The EpiData Association) and analysed using R (R Core Team, 2017) with the extension packages lme4, multcomp and turkeytrend. Comparison of data for boys and girls at the 6- and 15-month visits was carried out using χ 2 tests and two-sample t tests for categorical and continuous variables, respectively. Changes in FM, FFM, FMI and FFMI from 6 to 15 months were analysed by paired t tests.
Separate linear mixed-effects models were fitted to FFM and weight. Age, sex, intervention groups of the original trial design and the interaction between visits (6 or 15 months) and either sex, breast-feeding, LAZ or WLZ categories were included as fixed effects and children and municipality were included as random (intercept) effects. Specifically, differences between categories at 6 and 15 months and changes in differences (between categories) from 6 to 15 months were estimated; the latter corresponded to test for interaction. The corresponding estimates for FM were derived from the estimates for FFM and weight using a marginal models approach( Reference Ritz, Laursen and Damsgaard 23 ). Similarly, models were fitted to BMI and FFMI and estimates were derived for FMI. For triceps and subscapular skin folds, similar linear mixed-effects models were fitted using the same fixed and random effects as for weight and FFM. For all analyses, model assumptions were checked using residual and normal probability plots, respectively. A significance level of 5 % was used. No adjustment for multiple comparisons was applied.
Results
Of 514 infants screened, 419 (82 %) were recruited for the nutrition intervention trial (Fig. 1). The mean age was 5·9 months (range: 5·0–7·9) and 53 % were boys (Table 1). At the 6-month visit, 98 % were breastfed, 15 % were stunted (LAZ <–2) and 4 % were wasted (WLZ <–2). At 15 months, these figures had changed to 78 % breastfed, 24 % stunted and 11 % wasted children, with no differences between boys and girls. Data on FFM and FM were available on 389 (93 %) infants at the 6-month visit and on 293 (82 %) at the 15-month visit (Fig. 1). In total, 413 children had FFM and FM data from at least one visit. At the 6-month visit, children without body composition data had slightly lower WLZ (0·4 v. 0·7 z scores, P<0·05) but not LAZ. There were no differences in WLZ or LAZ at the 15-month visit between children with v. without body composition data. Boys had higher weight, length, MUAC, BMI, FM, FFM and FFMI, but not FMI compared with girls at the 6-month visit. At 15 months, the sex differences remained except that boys did not have a higher FM than girls (Table 2). FM and FMI decreased between 6 and 15 months (P<0·001), whereas FFM (P<0·001) but not FFMI (P=0·09) increased. In adjusted analyses, higher weight in boys compared with girls both at the 6- and 15-month visits was mainly due to higher FFM (Table 3); similarly higher BMI in boys was mainly due to higher FFMI (Table 4). At the 6-month visit, the 0·59 (95 % CI 0·35, 0·83) kg/m2 higher BMI in boys was due to 0·49 (95 % CI 0·29, 0·68) kg/m2 higher FFMI; and at the 15-month visit, the 0·56 (95 % CI 0. 31, 0·81) kg/m2 higher BMI in boys was due to 0·45 (95 % CI 0·23, 0·66) kg/m2 higher FFMI (Table 4).
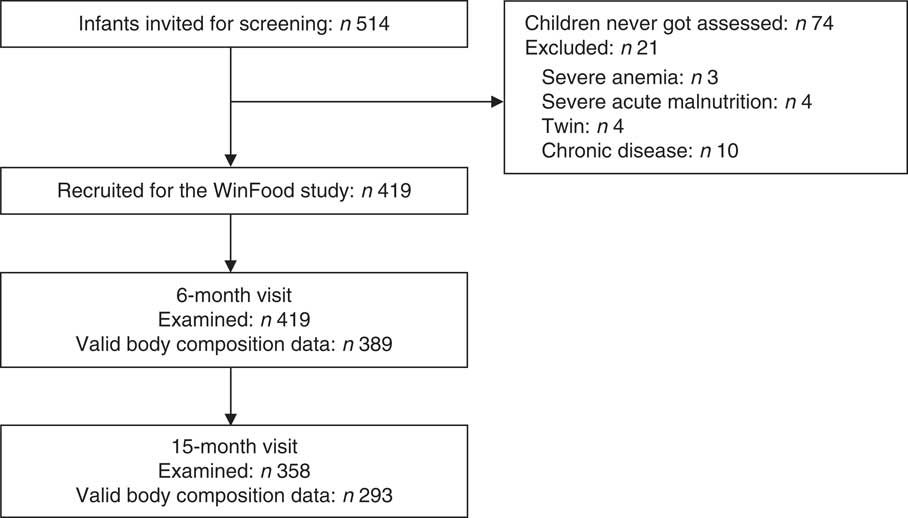
Fig. 1 Flow diagram of study participants. Definition of ‘valid body composition data’: body composition calculated from children with no uncertainty about 2H spillage, resulting in more precise calculations of fat mass and fat-free mass.
Table 1 Baseline characteristics of 419 Cambodian children (Numbers and percentages; mean values and standard deviations)

* Protected well is defined as a well with a lid.
Table 2 Breast-feeding status, anthropometry, fat mass and fat free mass in Cambodian boys and girls at 6 and 15 months of age Footnote * (Numbers; mean values and standard deviations)

MUAC, mid-upper arm circumference; LAZ, length-for-age z score; WLZ, weight-for-length z score; FM, fat mass; FFM, fat-free mass; FMI, fat mass index; FFMI, fat-free mass index.
* n (number of children in each analysis).
Table 3 Estimated mean differences in weight, fat-free mass (FFM), and fat mass (FM) within sex, breast-feeding, length-for-age and weight-for-length z score categories among Cambodian children at 6 and 15 months of age (n 413)‡ (Mean differences (Diff.) and 95 % confidence intervals)

* Significantly different from the reference category (P<0·05).
† Significant interaction, that is, change in difference between 6 and 15 months (P<0·05).
‡ Separate linear mixed-effects models were fitted to FFM and weight. Age, sex, intervention groups of the original trial design, and the interaction between visit (6 or 15 months) and either sex, breast-feeding, length-for-age or weight-for-length z score categories were included as fixed effects and children and municipality were included as random (intercept) effects. Estimates for FM were derived from the corresponding estimates for FFM and weight (with error propagation).
Table 4 Estimated mean differences in BMI, fat-free mass index (FFMI), and fat mass index (FMI) within sex, breast-feeding, length-for-age and weight-for-length z score categories among Cambodian children at 6 and 15 months of age (n 413)‡ (Mean differences (Diff.) and 95 % confidence intervals)

* Significantly different (P<0·05) from the reference category.
† Significant interaction, that is, change in difference between 6 and 15 months (P<0·05).
‡ Separate linear mixed-effects models were fitted to BMI and FFMI. Age, sex, intervention groups of the original trial design, and the interaction between visit (6 or 15 months) and either sex, breast-feeding, length-for-age or weight-for-length z score categories were included as fixed effects and children and municipality were included as random (intercept) effects. Estimates for FMI were derived from the corresponding estimates for BMI and FFMI (with error propagation).
Breastfed and non-breastfed children did not differ in weight or BMI at the 6- or the 15-month visits (Tables 3 and 4). However, FMI was reduced by 1·22 (95 % CI 0·39, 2·05) kg/m2 at the 6-month visit in non-breastfed infants (n 6, 1·4 %). At 15 months, non-breastfed infants (n 79, 22 %) no longer had lower FMI compared with breastfed infants (–0·23, 95 % CI –0·51, 0·051) kg/m2. FFMI tended to be higher in non-breastfed infants at 6 months (0·74, 95 % CI –0·002, 1·48) kg/m2 and was higher in non-breastfed compared with breastfed infants at 15 months (0·28, 95 % CI 0·03, 0·53) kg/m2.
Deficits in weight/FM/FFM (Table Reference Andersen, Girma and Wells3) and BMI/FMI/FFMI (Table 4) increased as LAZ and WLZ categories declined, that is, higher deficits were observed for LAZ and WLZ <–2 than LAZ and WLZ between –1 and –2 or –1 and 0. Stunting (LAZ <–2) was associated with reduced FM at 6 months and lower FFM at both 6 and 15 months compared with children with LAZ ≥0 (Table Reference Andersen, Girma and Wells3). Stunting was not associated with FFMI or FMI at 6 or 15 months (Table 4).
The BMI deficits associated with wasting at both 6- and 15-month visits were explained by lower FFMI as well as FMI. FMI deficits improved between 6 and 15 months for all z score categories (interaction, P<0·05, Table 4 and online Supplementary material), whereas FFMI deficit point estimates worsened for all WLZ categories. However, worsening of FFMI deficit was only significant for WLZ between –1 and 0 (–0·4 kg/m2 (–0·8; –0·03), P<0·05) (Table 4 and online Supplementary material). By comparison, the FFM deficits worsened in all z score categories (P≤0·05) and FM deficits improved for WLZ between –2 and 0 (P<0·05) from 6 to 15 months (Table Reference Andersen, Girma and Wells3 and online Supplementary material).
Compared to children with LAZ ≥0, stunted children had thinner triceps and subscapular skinfolds at 6 months but not at 15 months. Wasted children had thinner triceps and subscapular skinfolds both at the 6- and 15-month visits (online Supplementary material).
Discussion
This study showed that stunting, wasting, sex and breast-feeding status were associated with body composition in early life. Stunting was associated with a lower FMI at 6 months, but at 15 months there were no difference in FMI and FFMI compared with children with LAZ >0. For wasted children at 6 and 15 months, both FFMI and FMI were lower than that in children with WLZ >0. The non-breastfed infants had lower FMI at 15 months compared with infants being breastfed.
The study population consisted of infants from rural Cambodia who, despite a very high prevalence of breast-feeding, had stunting and wasting rates of 14 and 4 %, respectively, at 6 months of age. At 15 months, these were further deteriorated to 24 and 11 % of children being stunted and wasted, although they all had received one of the four types of nutritional supplementation between the 6- and 15-month visits, and the majority continued breast-feeding until 15 months. This pattern of worsening stunting during the complementary feeding period has been seen in many low-income countries( Reference Victora, de Onis and Hallal 24 ). It was apparently difficult to stop the decrease in LAZ and WLZ during this critical period. One possible reason could be a high prevalence of environmental enteric dysfunction( Reference Crane, Jones and Berkley 25 ).
The decrease in FM and especially in FMI seen from 6 to 15 months in this study is expected and similar to the decline observed in infants from two reference groups from the USA( Reference Fomon, Haschke and Ziegler 19 , Reference Butte, Hopkinson and Wong 26 ). This decrease is also reflected in the skinfolds and BMI during this age period seen in the WHO growth standards( 21 ).
Boys had, as expected, a higher weight and BMI at both 6 and 15 months, as is also seen in the WHO growth standards( 21 ). The higher weight and BMI were explained mainly by a higher FFM and FFMI which has also been shown in many other studies demonstrating higher lean mass in boys( Reference Bandara, Hettiarachchi and Liyanage 27 , Reference Park, Park and Kim 28 ).
Stunting/wasting
Both stunting and wasting were associated with absolute deficits in FFM and FM, with the deficits increasing with the magnitude of malnutrition. Furthermore, the deficits in FFM increased with age, whereas those for FM decreased with age in children with WLZ <0. This indicates that malnutrition disproportionately affects FFM, with this impact increasing with age.
However, after adjusting for length, that is, when using FMI and FFMI, the impact of stunting on fat-free tissue decreased and lost significance. The fat-free tissue deficit associated with stunting is thus fully explained by the reduced length, indicating that stunted children are gaining fat-free tissue in the same proportion to their length as non-stunted children.
Regarding wasting, in contrast, deficits in fat-free and fat tissue remained apparent after adjusting for length. There was a subtle worsening of the fat-free tissue deficit with age, but a notable decrease in the magnitude of fat deficit. Again, in association with age, wasted children increasingly seem to preserve fat at the expense of FFM.
Preservation of fat in infants and undernourished children was also reported in other studies. A small, cross-sectional study from the Gambia assessed FFM and FM in 3–18 months old Gambian infants against a reference group of healthy British infants( Reference Wells, Hawton and Darch 11 ). Data indicated that FFMI deficit in the Gambian infants initially increased, whereas the FMI deficit initially decreased with age. A study followed up a cohort of 320 Malawian children (median age 9·3 years, inter-quartile range 8·1–10·3) that had been treated for SAM at a younger age. Compared to their nearest sibling and age- and sex-matched community controls, the previous SAM cases had lower FFM (estimated by bioelectrical impedance analysis), lower anthropometric measurements, weaker hand grip and shorter endurance in an exercise test( Reference Lelijveld, Seal and Wells 29 ). Another study in children with SAM in the Democratic Republic of Congo analysed FM and FFM in a subgroup of children with an average age of 3 years( Reference Bahwere, Balaluka and Wells 30 ). After recovery from SAM, these children had a lower FFM than non-wasted children from the same community. However, FFMI was not different between the two groups( Reference Bahwere, Balaluka and Wells 30 ).
Mechanistically, the preferential accumulation of fat in undernourished children may be due to the lack of specific type II nutrients, such as Zn, which are required for synthesis of FFM( Reference Golden and Golden 31 ). However this scenario may also be viewed as an evolved survival strategy, stimulated by malnutrition during infancy( Reference Wells, Hawton and Darch 11 , Reference Owino, Kasonka and Sinkala 32 ). Developmental trade-offs between FM and FFM accretion are predicted by evolutionary life history theory in association with various ecological factors, and future nutritional interventions might benefit from considering this theoretical issue( Reference Wells, Nesse and Sear 33 ). The involvement of fat reserves in acute malnutrition was discussed by Bartz et al. ( Reference Bartz, Mody and Hornik 12 ). They conducted a comprehensive metabolomic analysis of children admitted with SAM and found that low levels of leptin, a marker of adipose tissue reserve, were the major biochemical factor predicting mortality. The authors further suggested that fatty acid metabolism has an important role in adaptation to acute malnutrition.
To reduce the risk of lower muscle mass and strength in wasted children, the development of new nutritional interventions should be aimed at increasing accretion of FFM. In a multifactorial study in 1609 malnourished children aged 6–23 months, twelve different nutritional supplements were given over a period of 12 weeks. FFM constituted 93·5 % of the weight increase and lipid-based nutrition supplements resulted in a 0·083 kg/m2 higher FFMI than maize–soya-blends( Reference Fabiansen, Yaméogo and Iuel-Brockdorf 34 ). This indicates that energy-dense lipid-based nutrition supplements may reduce a detrimental decline in FFM in malnourished children.
In stunted children, preservation of FM over FFM has shown conflicting long-term results. Two studies from Brazil found an association between stunting and risk of obesity in children( Reference Sawaya, Dallal and Solymos 35 , Reference Martins, Hoffman and Fernandes 36 ). A subsequent study at one of the sites found lower fat oxidation, a risk marker of obesity, in stunted compared with non-stunted children( Reference Hoffman, Sawaya and Verreschi 37 ). However, a birth cohort study in 2000 Brazilian boys found low height-for-age z score at ages 2 and 4 years to be associated with low FMI but not FFMI at 18 years of age, and low weight-for-height z score at 2 and 4 years to be strongly associated with both low FMI and FFMI( Reference Gigante, Victora and Horta 38 ) at 18 years. Thus, the birth cohort study indicated that stunting and wasting in childhood was not associated with overweight in late adolescence. In sub-Saharan Africa, a large birth cohort study found no association between stunting and later obesity( Reference Cameron, Wright and Griffiths 39 , Reference Hanson, Munthali and Lundeen 40 ) and children who had been stunted at 2 years of age had lower FFM at 22 years compared with non-stunted children( Reference Prioreschi, Munthali and Kagura 41 ). However, few studies have had access to accurate body composition methodologies, and most published studies have addressed older age groups, when linear growth is relatively canalised.
Breast-feeding
In the present study, we found that non-breastfed compared with breastfed children did not differ in BMI at the 6- or the 15-month visit. At the 6-month visit, a lower FMI was observed in non-breastfed infants, which reduced in magnitude and only remained as a trend at 15 months. FFMI was higher in non-breastfed infants at both 6 and 15 months. At the 6-month visit, only six infants were non-breastfed, and these results therefore have to be interpreted with caution. A meta-analysis found that formula-fed infants had a lower FM compared with breastfed infants at the age of 6 months, but from 6 to 12 months the formula-fed infants were gaining more FM( Reference Gale, Logan and Santhakumaran 13 ). Formula-fed infants had higher FFM compared with breastfed infants throughout infancy. The non-breastfed infants of the present study seem to have similar changes in FM and FFM as formula-fed compared with breastfed infants in the meta-analysis.
A trial in Iceland, where infants were randomised to be exclusively breastfed until 6 months of age or to be introduced to complementary food at 4 months of age, showed that the latter had a 0·33 kg (95 % CI –0·77, 0·11) lower FM at 6 months of age( Reference Wells, Jonsdottir and Hibberd 42 ). At the 15-month visit, we found that the non-breastfed children had a lower FMI compared with the children who were still being breastfed. These findings may suggest that breast milk supports the accretion of FM, which is likely to be an important energy buffer to young children at risk of undernutrition during this period of rapid growth. In the Lancet Breastfeeding series, it was concluded that there is suggestive evidence for breast-feeding protecting against later obesity( Reference Victora, Bahl and Barros 43 ). Interestingly, the protective effect was of the same magnitude in low- and middle-income countries as in high-income countries( Reference Horta, Loret de Mola and Victora 44 ). Studies on how composition of breast milk is related to later body composition of the infant is also giving new insight into the mechanisms by which early diet influence body composition. One study showed that human milk leptin content at 1 month was inversely related to total body fat, percentage FM and trunk fat at the age of 6 months( Reference Fields, George and Williams 45 ), and in another study several aspects of human milk oligosaccharides pattern at 1 month was associated with body composition at 6 months( Reference Alderete, Autran and Brekke 46 ). Furthermore, a study found that human milk adiponectin was positively associated with body weight and sum of skinfolds up to 2 years( Reference Brunner, Schmid and Zang 47 ).
Strengths and limitations
Measurement of body composition in relation to stunting and wasting in infancy and early childhood is a major strength of this article. The 2H dilution technique is considered a valuable method to quantify whole-body FM and FFM in research( Reference Wells and Fewtrell 48 ). Most earlier studies have used anthropometric measures to examine body composition, but this was questioned in several studies( Reference Jensen, Mølgaard and Ejlerskov 49 , Reference Chomtho, Fewtrell and Jaffe 50 ). The 2H dilution technique can be applied in field studies; however, in addition to being expensive, it is a technically challenging method. If the practical work of administering 2H to children and/or collecting the saliva from children is not performed properly, it can introduce under- or overestimation of FM. Meticulous administration of 2H and recording of spillage by one person resulting in more accurate measurements of FM and FFM is therefore the strength of this study. It is a limitation that data on breast-feeding only included information about ‘any breast-feeding the previous 24 h’. The duration of exclusive breast-feeding and frequency of breast-feeding after exclusive breast-feeding stopped may have influenced growth and body composition at 15 months and especially at 6 months of age. The children in the study received nutritional intervention. This may have implications on the generalisability of the results to similar children in the community who will not receive nutritional supplementation.
Conclusion
The study has shed some light on how the body deals with malnutrition in infants and young children in a food-insecure setting with a high prevalence of breast-feeding. Boys had an expected higher FFMI than girls at both the 6- and 15-month visits. Breast-feeding seemed to support accretion of FM as indicated by a lower FMI in children who stopped breast-feeding before 15 months. Stunting at 6 months was associated with lower FMI but not FFMI, whereas wasting at both 6 and 15 months was associated with both lower FFMI and FMI. The FFMI deficit increased slightly with age, but the FMI deficit decreased. Malnourished children seem to preserve body fat for immediate survival at the expense of FFM accretion. This may have long-term consequences with reduced functional outcomes and higher risk of non-communicable diseases. There is a need for further studies from middle- and low-income countries on how nutrition intake influences body composition, and how changes in body composition in early life influence growth, development and long-term health.
Acknowledgements
This work was supported by the Consultative Research Committee for Development Research (FFU); Ministry of Foreign Affairs, Denmark and the 2H dilution technique for measuring body composition was supported with financial and technical support by IAEA. The funders had no role in the design, analysis or writing of this article.
J. K. H. S., C. C., M. C., S. F., F. T. W., M. A. D., J. B., H. F., K. F. M. and N. R. designed the research project. J. K. H. S., C. C. and M. C. conducted the research. J. K. H. S., B. G., J. C. W., K. F. M., N. R., C. R. and H. F. analysed the data. J. K. H. S., B. G., K. F. M., J. C. W. and H. F. wrote the first draft of the manuscript. All authors have read and approved the final manuscript.
The authors declare that there are no conflicts of interest.
Supplementary material
For supplementary material/s referred to in this article, please visit https://doi.org/10.1017/S0007114518003884