Introduction
Snow cover on sea ice displays large variability on all temporal and spatial scales. From the perspective of marine polar climate, snow measurements have been motivated by the well-known impacts of snow on planetary albedo, sea-ice mass balance via the insulating effect of snow and snow-ice formation because of flooding. As a consequence, a focus of the field measurements has been the mapping of large-scale snow characteristics (Reference WarrenWarren and others, 1999; Reference Gerland and HaasGerland and Haas 2011), regional studies (e.g. Forsström and others, 2011) and measurements of the seasonal evolution of the snow cover (Reference Sturm, Holmgren and PerovichSturm and others, 2002; Reference Nicolaus, Gerland, Hudson, Hanson, Haapala and PerovichNicolaus and others, 2010). Recently, snow thickness over Arctic sea ice has also been investigated in detail from airborne radar measurements (Reference Kurtz and FarrellKurtz and Farrell 2011; Reference KwokKwok and others, 2011). Locally, snow thickness displays large variability on a horizontal scale of 1–100m. This variability is the result of snow redistribution due to wind-driven drift causing scouring of the snow from some areas, accumulation in others and sinking of snow mass to open leads. Accumulation of drifting snow is highly dependent on the surface roughness of the pack ice. On an ice floe, which predominantly consists of undeformed ice, accumulated snow forms snow dunes or sastrugi, but in deformed ice regions the sails of the pressure ridges are structures that efficiently collect drifting snow.
In the Arctic Ocean, snow measurements have been performed mainly in the multi-year ice regions (Reference WarrenWarren and others, 1999; Reference Sturm, Holmgren and PerovichSturm and others, 2002; Reference Alexandrov, Sandven, Wahlin and JohannessenAlexandrov and others, 2010). Considering the well-established shift of pack-ice characteristics from perennial to seasonal ice cover (Reference ComisoComiso, 2012), detailed data of snow properties over the first-year ice are needed to develop numerical models and retrieval algorithms for remote sensing.
To convert a remote-sensing measurement to a geophysical parameter, knowledge of the local-scale variability of the surface properties is necessary. The most promising method for large-scale ice thickness mapping is satellite altimetry either by laser (Ice Cloud and land Elevation Satellite (ICESat)) or radar (CryoSat), that resolves the sea-ice freeboard. In addition to the uncertainties related to determination of freeboard by spaceborne sensors, snow thickness and density are a major source of uncertainty since conversion of freeboard to ice thickness is calculated using Archimedes’ principle (Reference Wadhams, Tucker, Krabill, Swift, Comiso and DavisWadhams and others, 1992; Reference WinghamWingham and others, 2006). Typically, the footprint of the satellite measurements is 75–300m. Within this scale, the ocean surface could be composed of lead, undeformed ice floe, ridged ice floe or a mosaic of all types with uneven snow cover. For the freeboard conversion, knowledge of snow thickness as well as snow and ice densities is needed, but these variables cannot be resolved by remote-sensing methods, so the retrieval algorithms commonly assume that snow and ice densities are constant and use climatological values for snow thickness.
In order to validate the CryoSat-2 satellite data, several field campaigns have been organized since the satellite was launched (e.g. Reference GerlandGerland and others, 2011). The Norwegian Polar Institute (NPI) conducted a field campaign on board R/V Lance to the pack-ice zone north of Svalbard. Activities included measurements of sea-ice freeboard, mapping of snow cover and ridging, measurements of snow and ice densities and ice thicknesses, airborne measurements of sea-ice thickness by the electromagnetic method (Reference Renner, Hendricks, Gerland, Beckers, Haas and KrumpenRenner and others, 2013) and airborne radar and scanning laser measurements. This paper presents an analysis of the in situ freeboard and snow thickness measurements and provides detailed data on spatial variability of snow thickness for an examination of the relationship between ice types, snow thickness and freeboard.
Methods
The study region was the pack-ice region north of Svalbard (80–81° N, 12–21° E). The sea-ice cover in this region is dominated by first- and second-year ice. The modal ice and snow thickness in spring is 1.8m and shows little interannual variability (Reference Renner, Hendricks, Gerland, Beckers, Haas and KrumpenRenner and others, 2013). Snow and freeboard data were collected in seven locations between 27 April and 11 May 2011 (Fig. 1). The floes were mainly composed of first-year ice. Detailed description of the floe characteristics and conducted measurements is provided in the R/V Lance cruise report (NPI, unpublished information).

Fig. 1. Locations of the measurement sites and the CryoSat-2 overpasses between 30 April and 8 May 2011. Numbers in the map refer to the station index of the NPI ICE cruise.
Snow thickness and surface elevation measurements were performed in the standard manner using a snow stick and a rotating laser. The ocean surface was used as a reference to the laser levelling, detected from the edge of the floe or crack inside the floe. Drilling was done only after the snow and freeboard measurements, to avoid artificial flooding. Most of the measurements were done in 2.5 m spacing along a line typically crossing the floe. In some ridged regions, measurements were also performed with 1.0 m spacing in order to accommodate sampling rate on the expected horizontal variations of snow cover. Estimated measurement errors are ±1.0 cm. Altogether, 4109 m of measurement lines were surveyed during the expedition.
Several snow pits were dug at each station. Their locations were chosen to represent the variability of snow-pack in the region. Density measurements were performed using either the Japanese sampler (square shovel, 100 cm3) and weighting the snow in a plastic bag (6 g) or the metal tube (0.5 L, 560 g). The sampler type was chosen according to snow depth and layer thickness.
Results
Mean conditions
The mean of all the snow thickness measurements was 36 cm, slightly higher than the long-term mean thickness of 30–34 cm in April (Reference WarrenWarren and others, 1999). The mean freeboard was only 3 cm. The mean standard deviations (SD) of snow thickness and freeboard were 26 and 23 cm, respectively. There was a noticeable difference in snow thicknesses among the measurement sites. This was partly due to the different ages of the floes, but at all measurement sites the snow cover was much thicker around the ridges.
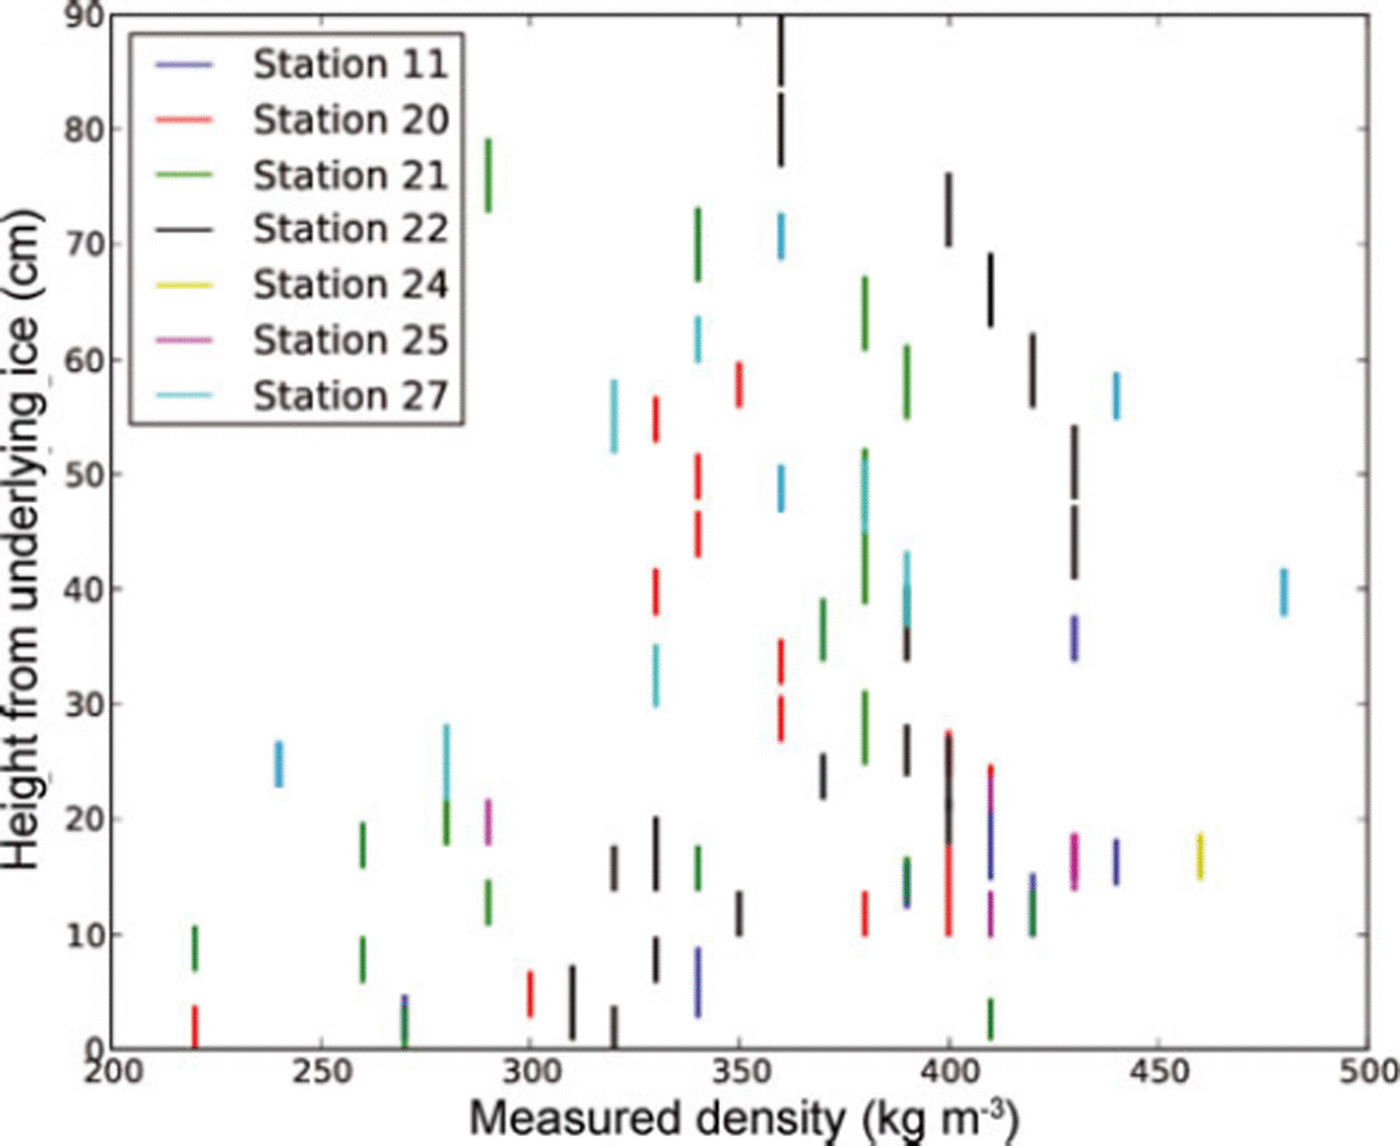
Figure 2 presents a summary of all the snow density measurements conducted. The bottom of the snowpack was often characterized by low-density layers corresponding to angular crystals and depth hoar due to high gradient metamorphism. The spread of the density values around the mean value for the higher layers of the snowpack is small. These layers mainly consist of fine and rounded grains originating from equitemperature metamorphism. Some higher-density layers are also noticeable and correspond to melt–freeze metamorphism. Average snow density was 363 kgm−3, with standard deviation of 43.6 kg m−3.

Fig. 2. Vertical averages of snow density.
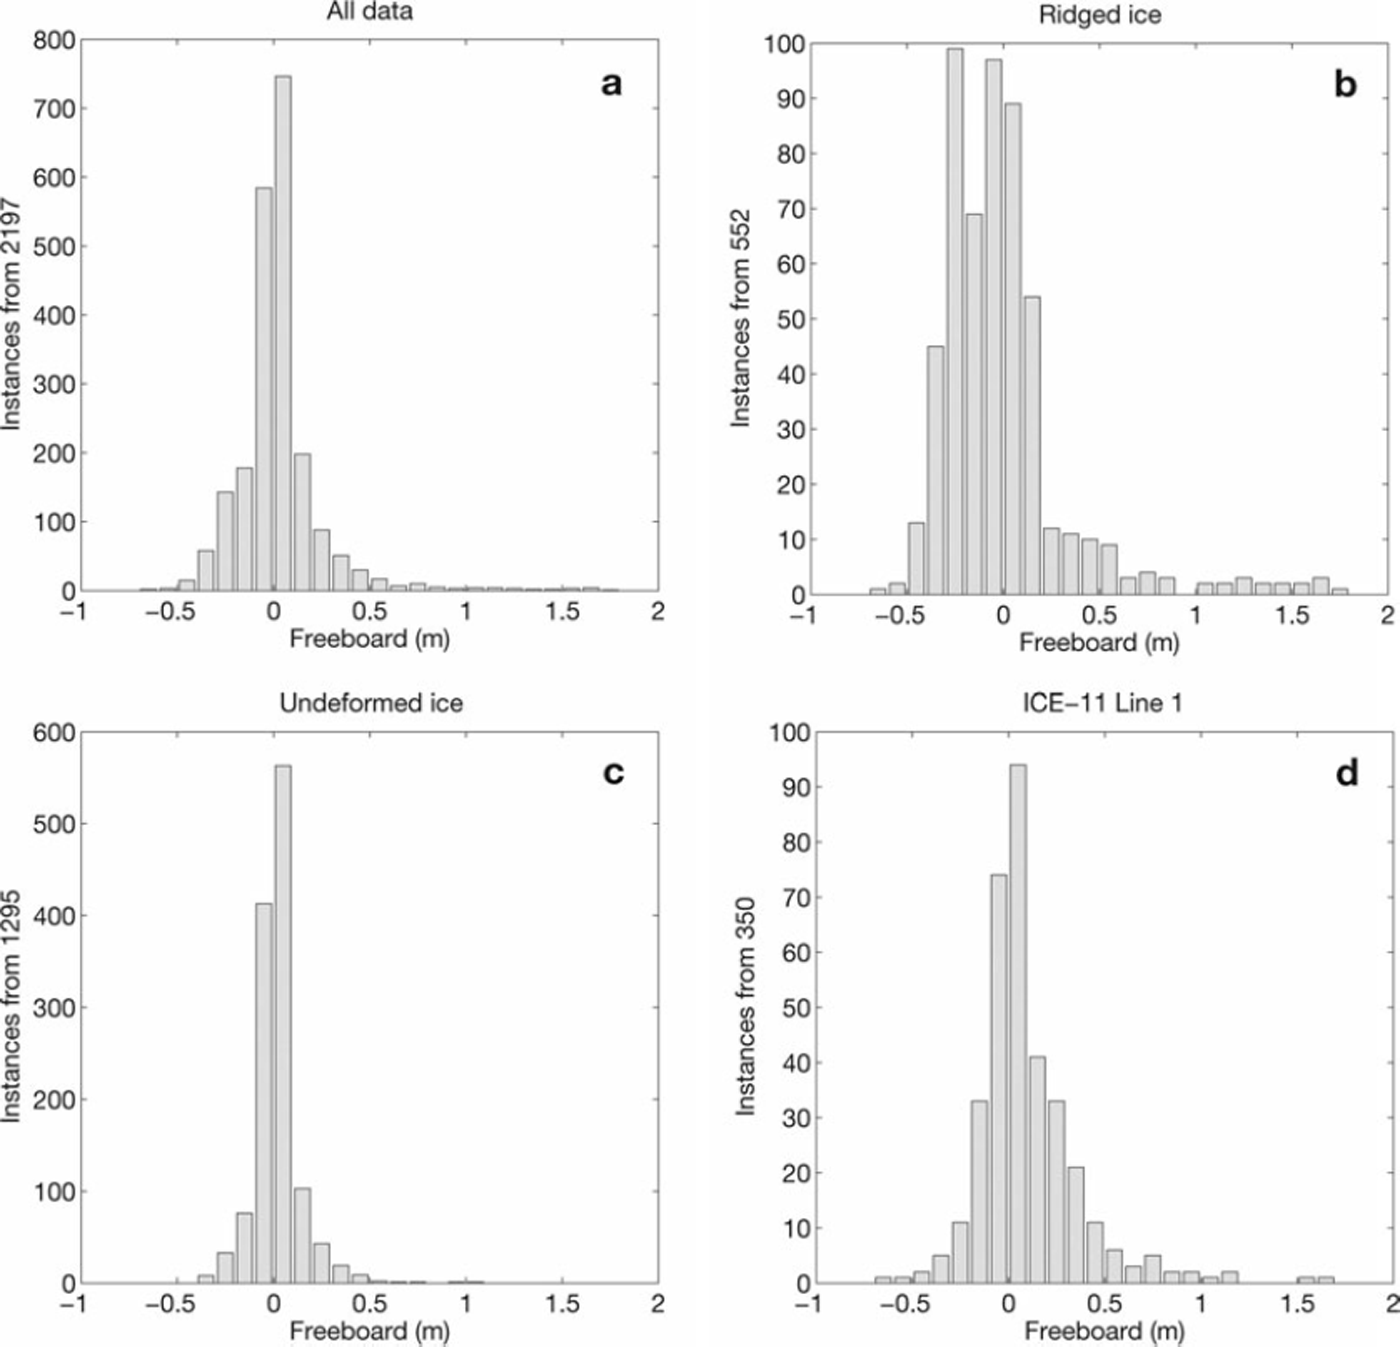
Snow thickness and freeboard height along the longest measurement line are shown in Figure 3. In order to examine snow thickness characteristics of different ice types, we calculated snow thickness and freeboard distributions separately for undeformed and ridged ice types (Figs 4 and 5) and along the longest measurement line. Over the undeformed ice areas, the mean snow thickness was 23 cm with a standard deviation of 26 cm, while in ridges it was 54 cm with a standard deviation of 29 cm. Mean freeboards were 2.4cm (SD = 12cm) and –0.3 cm (SD = 35 cm), respectively.

Fig. 3. Snow thickness, surface elevation and freeboard along the longest profile at station 21. Light gray shading indicates thickness of snow cover, and dark shading the freeboard.

Fig. 4. Distribution of snow thickness: (a) all data, (b) over the undeformed ice types, (c) ridges and (d) the long line of station 21. Averages 36, 23, 54 and 46 cm, respectively.

Fig. 5. Distribution of ice freeboard: (a) all data, (b) over the undeformed ice types, (c) ridges and (d) the long line of station 21. Averages 3.0, 2.4, –0.3 and 10.1 cm, respectively.
Spatial variability of the surface properties
For a detailed examination of horizontal variability of snow and ice thicknesses and freeboard, a two-dimensional mapping was conducted at station 11, representing typical first-year undeformed ice floe in the study region. The size of the floe was 150 m × (60–100) m, and the mapped area was 140 m × 40 m (Fig. 6). The snow thickness varied from 5 to 45 cm, the average snow thickness being 20 cm. The mean freeboard was 1.7 cm and varied between - 1 6 and 19.5 cm. The percentage of negative freeboard values was 3 1 %. There were no visible ridges or other structural breaks in the mapped area, indicating that horizontal variability of snow thickness was pure wind-induced scouring and accumulation. According to this mapping, the horizontal scale of the variation was ∼50 m. Horizontal variability of freeboard was very strongly tied to the ice thickness variability, and areas of negative freeboard were related to the degree of snow accumulation.

Fig. 6. Snow thickness (a) and freeboard (b) at station 11. Stars indicate locations of the in situ measurements.
Snow thickness, surface elevation and freeboard along the 872.5 m section are shown in Figure 2. Measurements were taken at station 21, which was established in a large floe at least 1.5 km in diameter. For the first 400 m of the measurements, the ice was only slightly deformed; the remaining part was more deformed. Ridge sails were typically 1–2 m high, the maximal values exceeding 3 m. The average snow thickness over the line was 46 cm. The mean freeboard was 10.1 cm, but negative freeboard values were also measured both in undeformed and deformed ice areas. The percentage of negative freeboard points was 36.3%.
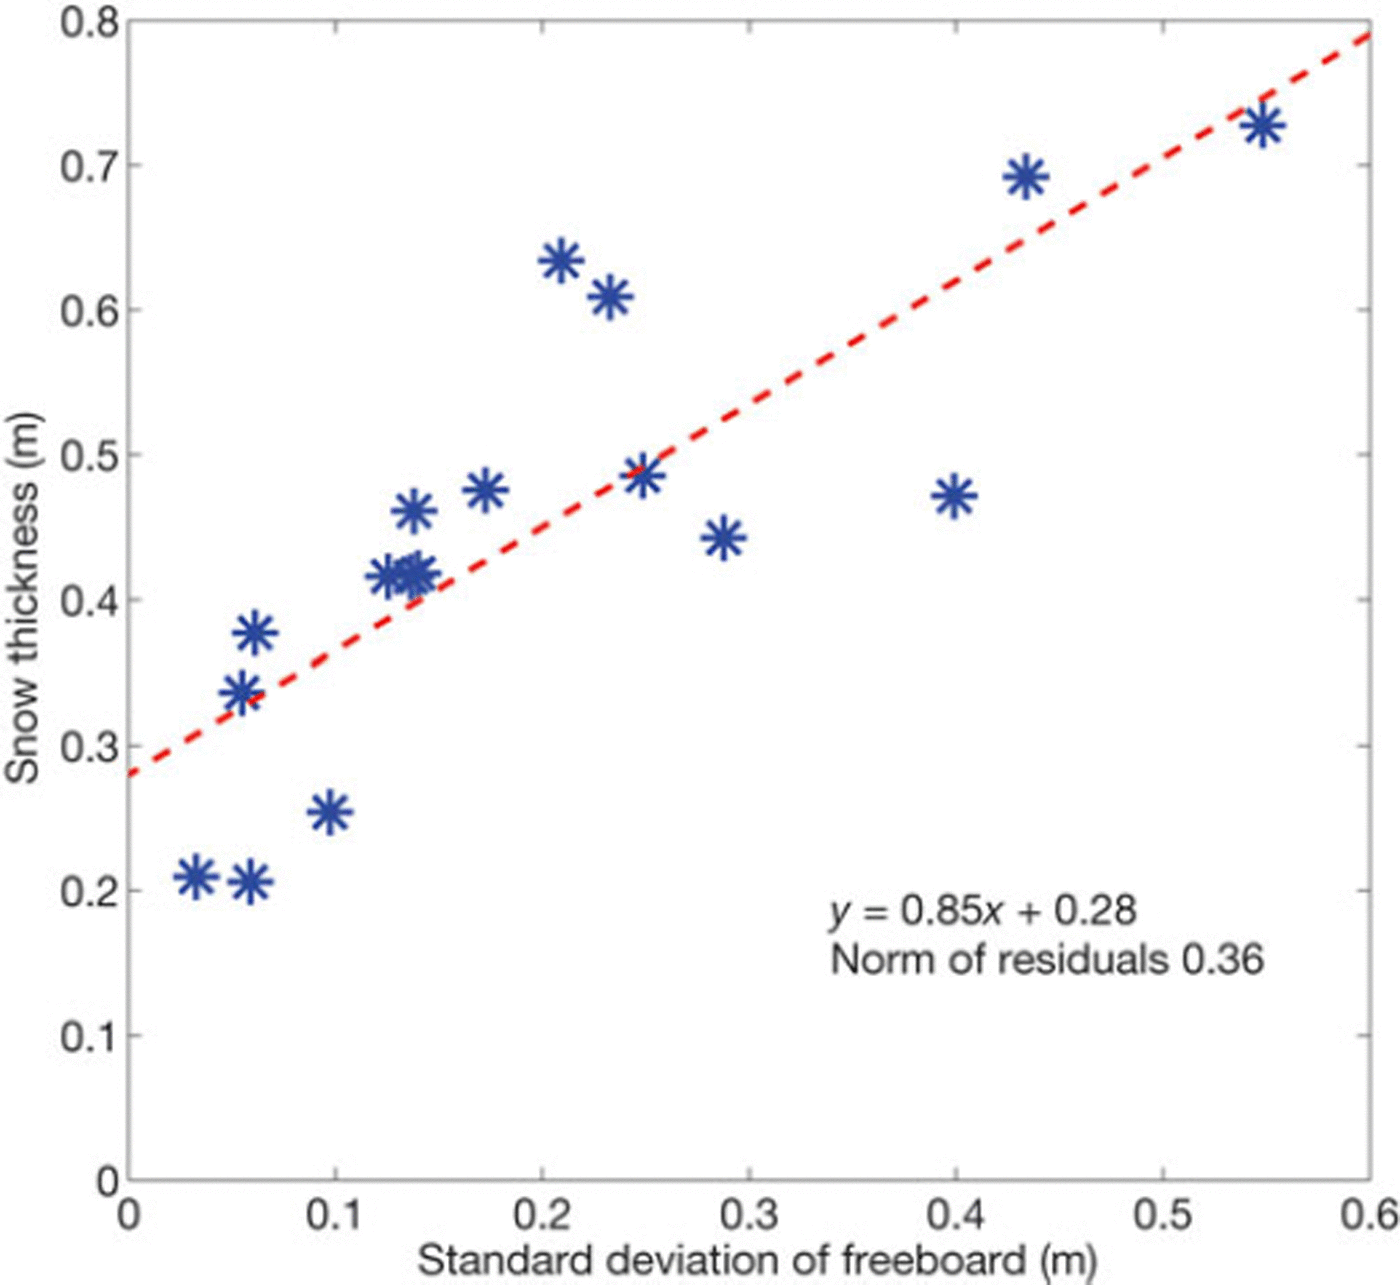
The relationship between the standard deviation of the freeboard, which can be understood as an indicator of the ice type, and snow thickness is shown in Figure 7. The standard deviation of freeboard was calculated for 50 m segments along the long measurement line (Fig. 2). The results show a clear relationship between snow thickness and surface roughness. The segments where standard deviation is <0.1 m describe undeformed ice. In these areas snow thickness varies from 20 to 40 cm on average. Increased variability of freeboard is an indicator of surface roughness or deformed ice, sails of pressure ridges in particular. In these regions the snow thickness was 40–70cm. The maximum snow thickness was 1.7 m in this measurement line.

Fig. 7. Snow thickness as a function of ice surface roughness, measured by ice freeboard standard deviation.
Discussion and Conclusions
Snow thickness distribution on the local scale and its impact on ice freeboard has not previously been examined in the degree of detail provided here. The measurements presented reveal that the snow thickness was large and the ice freeboard was negative in many locations although the sea ice was thick. However, there was not yet flooding in all locations where the freeboard was negative, indicating that the sea ice was still cold and impermeable. Regional-scale average freeboard was only 3cm, less than the expected accuracy range of CryoSat-2 satellite measurements. Using CryoSat-2 for sea-ice thickness monitoring in first-year ice regions is very challenging due to the uncertainties caused by unequal snow distribution over the pack ice. A potential solution for a more accurate sea-ice thickness retrieval method is to develop an algorithm that distinguishes the sea-ice types based on the waveforms of the backscattering echo and takes into account snow-loading differences between undeformed and deformed ice types. In some regions, the snow surface was very dense; at the top, even icy layers were observed (NPI, unpublished information). Such layers could cause a reflection of the CryoSat signal and potentially lead to too high satellite-derived freeboard measurements.
The uneven horizontal distribution of snow thickness is likely to affect the light conditions below the sea ice. On most of the floes, the snow cover was thick enough to absorb most of the solar radiation, but considering the conditions later in the spring season, areas of thinner snow cover are certainly also favorable for under-ice biota.
It would be interesting to investigate whether the local snow thickness distribution affects surface albedo and melting of the pack ice. Uniform snow cover would imply uniform surface albedo and melting rates within the scale of a floe, but the real situation is much more complicated. In general, earlier onset of melting is expected when snow cover is thinner, and the lower albedo of bare ice will accelerate the melting further. On the other hand, a slush layer due to negative freeboard increases the absorption of the solar radiation that penetrates the snow cover, which may lead to increased subsurface melting. Another snow-related mechanism that may accelerate ice-cover disintegration during the melting season is the uneven mechanical loading due to ice thickness variation. This can lead to floe fragmentation, especially near boundaries between ridged-ice and level-ice types.
Acknowledgements
We thank Harvey Goodwin for contributing in situ measurements, and the ship and helicopter crews of R/V Lance and Airlift AS for their great support. Parts of this work are elements of the projects ICE-Fluxes (Norwegian Polar Institute), PRODEX CryoSat sea ice (European Space Agency- and Norwegian Space Centre-funded) and Fram Centre Polhavet.


