


Nursing mothers provide their infants with an average of 200–250 mg of Ca/d, and as much as 400 mg/d( Reference Prentice 1 , Reference Olausson, Goldberg and Laskey 2 ). The main mechanism by which lactating mothers meet these Ca requirements appears to be a temporary increase in the mobilisation of mineral from the skeleton( Reference Ritchie, Fung and Halloran 3 – Reference Sowers, Eyre and Hollis 5 ). Bone mineral has been reported to decrease by approximately 3–6 % during the first 3–6 months after delivery, especially at sites rich in trabecular bone( Reference Krebs, Reidinger and Robertson 6 – Reference Chan, Nelson and Leung 12 ).
Theoretically, providing the body with more Ca might be expected to improve bone mineral status during lactation. Maternal dietary Ca intake has been found to have positive effects on bone health in some observational studies( Reference Krebs, Reidinger and Robertson 6 ) but not in others( Reference Laskey, Prentice and Hanratty 13 , Reference Kolthoff, Eiken and Kristensen 14 ). Few randomised placebo-controlled studies lasting for 12 months or less with 1 g/d dose in forms of calcium carbonate have been conducted to test this hypothesis on postpartum women with differed habitual Ca intakes (283–1300 mg)( Reference Cross, Hillman and Allen 15 – Reference Prentice, Jarjou and Cole 17 ). In none of these studies, extra Ca has been found to have a beneficial effect on bone mineral during lactation; However, Ca has been shown to have a modest effect after weaning. Nevertheless, the effect of Ca supplementation on bone health during lactation remains unclear, as some researchers have used small study size (fifteen women)( Reference Cross, Hillman and Allen 15 ) or measured few bone sites( Reference Prentice, Jarjou and Cole 17 ). Additionally, no studies in this area have been conducted on Asian women, whose dietary patterns, lifestyle and hereditary factors may have distinct effects on the regulation of lactation-associated bone changes. Moreover, the supplemental Ca used in previous trials had usually been Calcium carbonate. Ca absorption from animal milks has been shown to be high relative to most other sources, constituting approximately 30–35 % of total Ca absorption on average( Reference Prentice 18 ). Further investigation is required to determine whether extra Ca given in the form of milk can facilitate the bone recovery in breast-feeding women.
This randomised, double-blinded, controlled, dose–response trial aimed to examine the effects of different dosages of Ca administered for 12 months in the form of Ca-fortified milk powder on the bone mineral changes in postpartum breast-feeding Chinese women.
Methods
Subjects
This study included 150 postpartum women aged 20–35 years, living in Guangzhou. The participants were recruited from the Guangdong Women and Children’s Hospital and Health Institute between October 2009 and April 2010. All were primiparae who had delivered a normal single infant at full term and intended to breast-feed their child. We excluded the following individuals: those with a history of metabolic bone disease or medical disorders known to affect Ca and bone metabolism or with a previous fracture history; who used any hormones for >2 weeks in the past 1 year; and those with a history of milk allergy or lactose intolerance. Detailed explanations regarding the study purposes, procedure and requirements were given to the subjects. A written informed consent was obtained from all of the participants before the enrolment. The study was approved by the Ethics Committee of Chinese Center for Disease Control and Prevention.
Study design and intervention regimens
This was a 12-month randomised, double-blinded, controlled trial involving three intervention dosages of Ca. Before being admitted to the study, the subjects received a supplement (40 g of milk powder) for 1 week before delivery as a run-in to familiarise the study’s procedure. The subjects who exhibited good compliance and no side effects during the run-in phase were randomly assigned to receive 40 g of milk powder containing 300 mg of Ca and 5 μg of vitamin D (Low-Ca group) or the same milk powder additionally fortified with 300 mg of Ca (Mid-Ca group) or 600 mg of Ca (High-Ca group) for 12 months. Daily doses of 1·0 and 2·0 g of isolated milk salt (containing 29·2 and 15 % P) were added to 40 g milk powder for the groups of the Mid-Ca and High-Ca group, respectively. All of the supplements shared the same taste, colour, appearance and packaging, which were produced and provided by Nestlé SA. Each daily dose was administered in two packages (approximately 20 g/package). All of the participants were advised to try to avoid any other milk or dairy products and Ca supplements during the intervention. The clinical trial registration number of this study was ChiCTR-PRC-09000580.
Randomisation and blinding
An independent researcher used a computer-generated randomisation table with a permuted block size of 15 to assign participants to the three treatment groups receiving different dosages of Ca in a 1:1:1 ratio. Researchers who had no contact with the study participants and were not involved in data collection and analysis performed the randomisation procedure and the labelling work. The randomised codes were enclosed in sequentially numbered, identical, opaque, sealed envelopes and were drawn by the participants in the order of the final enrolment into the trial. The three supplements were identical in appearance and coded as either A, B or C, respectively, according to strict quality control procedures by the manufacturer. The participants, research assistants and investigators were masked to the treatment group allocation. The code was broken after the completion of data collection by the principal investigator. The proportions of participants who believed that they had received particular treatments did not differ significantly between the three groups, confirming that the blinding was effective (the rates of the correct estimation for the Low-Ca, Mid-Ca and High-Ca were 31, 30 and 35 %, respectively; P=0·9).
Compliance and adverse event monitoring
All of the subjects were instructed to take two packs of milk powder per d – one in the morning and one in the evening – and to keep a daily record of their milk powder consumption. The milk powder was delivered to the participants every 10 weeks, and inquiries were made about leftover packs. Compliance was assessed during the follow-up by calculating the percentage of the delivered packs consumed. Adverse events associated with the supplements were self-reported by the participants during the study.
Data collection
Anthropometric and bone mineral status measurements
Height was measured to the nearest 0·1 cm and weight to the nearest 0·5 kg with the subjects in light clothing and without shoes. BMI was calculated as weight (kg)/height square (m2).
The bone mineral density (BMD, g/cm2) and bone mineral content (BMC, g) of the total body, the spine lumbar (L1–4) and the left hip were measured at enrolment (3–7 d after delivery and before discharge from hospital) and after 12 months with dual-energy X-ray absorptiometry (DXA) (Lunar DPX; GE). The subjects wore light clothing with no metal objects during the scan. The final scans of all the skeletal sites were analysed with reference to the baseline scan to minimise errors in positioning the region of interest. To ensure quality control, a spine phantom scan was performed daily. The CV of the machine between two consecutive BMD measurements taken after repositioning for eleven subjects in same day were 0·68, 1·88, 0·87, 1·29, 1·75 and 2·59 % at the whole body, the lumbar spine, the total left hip, the femur neck, trochanter and Ward’s triangle, respectively.
Dietary intake and physical activity assessment
The assessment of dietary nutrient intakes at baseline was based on the FFQ. We asked the participants at 2–3 d after delivery to report the average intake of food per d, per week or month (depending on the frequency of intake), using the third trimester as a reference period. The participants were asked to complete a 3-d food and physical activity diary before each visit at 3, 6 and 12 months. The diaries were checked further by study investigators at the corresponding visits. Nutrients were calculated from the Chinese Food Composition Tables( Reference Yang, Wang and Pan 19 ), and the physical activity was calculated by the combination of the metabolic equivalent score (MET, kJ/kg per h (kcal/kg per h)) for each type of physical activity after multiplied by its duration per d (h/d)( Reference Ainsworth, Haskell and Herrmann 20 ).
Statistical analysis
The minimum sample size for assessing the primary outcome measures was calculated using data collected by Kalkwarf et al. ( Reference Kalkwarf, Specker and Bianchi 16 ), who observed 1·5 % difference in BMD at the lumbar spine between the Ca and the placebo group after 12-month supplementation at a dosage of 1 g/d. It was postulated that, with an sd of 2·0 % in the distribution of treatment responses, forty participants per arm could reach over 80 % statistical power to detect a 1·5 % difference in mean percentage change in the lumbar spine BMD between the high- and low-dosage groups (with a significance level of 5 %). We anticipated a 20 % dropout rate, and therefore fifty subjects were recruited in each group.
Results are expressed as means and standard deviations unless otherwise indicated. The percentage changes in outcome measures were calculated as follows: (follow-up value−baseline value)·100 %/baseline value. The Kolmogorov–Smirnov test was used to check for normality. If the data were not normally distributed, they were transformed before further analysis. The statistical analysis was performed in the following two ways. (1) The changes of BMD/BMC from baseline in all of the subjects (n 150) were subjected to an intention-to-treat analysis using one-way ANOVA; the dropouts were assigned endpoint values based on a linear regression model. In the regression model, the dependent variable was BMD/BMC at the end of the intervention, and age, group, BMI and baseline BMD/BMC were served as independent variables. The imputed values of the dropouts were calculated using the equation generated from the linear regression model. ANCOVA was used to detect the group differences after adjusting for age, pretreatment values, baseline weight, energy intake and MET. (2) Complete case analysis using ANOVA and ANCOVA was performed on subjects who completed the 12-month intervention (n 102). Age, pretreatment values, baseline weight and its change, total duration of lactation, physical activity and dietary energy intakes were included as covariates in the ANCOVA analysis. The Bonferroni test was used for post hoc multiple comparisons. The categorical variables were compared using the χ 2 test. The data collected from the subjects who completed the whole trial were subjected to step-wise multiple regression analysis to examine the independent effects of group allocation (method=enter) and the other main determinants (methods=step-wise, F-to-enter=0·05, F-to-remove=0·1). The other independent variables were similar with the covariates in the ANCOVA analysis. Statistical significance was accepted at a two-sided P value of <0·05. SPSS for Windows, version 17.0 (SPSS Inc.) was applied for the analysis.
Results
Of the 715 potential subjects that were screened, 150 were eligible and thus randomly assigned to the three treatment groups (Fig. 1). A total of 102 of the subjects completed the full 12-month study. The reasons for discontinuation were pregnancy (n 8), a change of residence or loss to follow-up (n 16) and loss of interest (n 24). The Low-Ca, Mid-Ca and High-Ca groups lost 15, 17 and 16 (P>0·05) subjects, respectively. About 97·5 % of subjects consumed dairy products, and 84·7 % of subjects took Ca supplements during pregnancy. The three treatment groups were well matched in terms of baseline anthropometrics, nutrients intake and other factors. Mean Ca intakes from foods at the entry of the study were 807, 811 and 822 mg/d in Low-Ca, Mid-Ca and High-Ca groups, respectively (P=0·9) (Table 1). There were no significant differences in baseline characteristics between subjects who completed the study and who did not.

Fig. 1 Box flow of the number of participants recruited and withdrawn from the trial. Low-Ca, low Ca group; Mid-Ca, middle Ca group; High-Ca, high Ca group.
Table 1 Baseline characteristics of the subjects (Mean values and standard deviations)
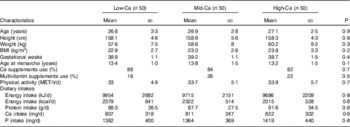
Low-Ca, low Ca group; Mid-Ca, middle Ca group; High-Ca, high Ca group; MET, metabolic equivalent score.
Table 2 summarises the characteristics of the study subjects in the follow-up period. Exclusive breast-feeding lasted for 4·6 (sd 3·3) months. A total of sixty women reported of mixed feeding their babies immediately after delivery. Of the mothers, forty-six lactated for longer than 9 months. Among the nursing mothers, forty-seven resumed their menorrhoea by 6 months after delivery. The subjects’ compliance was 76·1, 80·1 and 76·7 % in Low-Ca, Mid-Ca and High-Ca groups (P>0·5), respectively. The mean values for habitual Ca intakes at 3, 6 and 12 months postpartum were 589 (sd 176), 531 (sd 168) and 591 (sd 187) mg/d, respectively, and no differences were observed between the three groups (P: 0·226–0·785). The total Ca intake during the intervention was calculated as 769, 1067 and 1267 mg/d (P<0·001) in the Low-Ca, Mid-Ca and High-Ca groups, respectively. No adverse effects were noted, even by the women who consumed >90 % of the supplements.
Table 2 Measurements of the study subjects in the follow-up period (Mean values and standard deviations)

Low-Ca, low Ca group; Mid-Ca, middle Ca group; High-Ca, high Ca group; MET, metabolic equivalent score.
* Exclusive breast-feeding was defined as baby received nothing but breast milk.
The results of the intention-to-treat analysis are shown in Table 3. No group heterogeneities in baseline BMD values were found. After 12-month intervention, the magnitude of the BMD loss at the whole body was highest for Low-Ca group (0·93 %), intermediate for Mid-Ca group (0·56 %) and lowest for High-Ca group (0·44 %). The replenishment of the lumbar spine BMD was also most pronounced in the High-Ca group (3·32 %), followed by the Mid-Ca group (2·21 %) and the Low-Ca group (2·11 %). Similar patterns were observed in the BMD measurements for the total left hip and its sub-regions. After controlling for age, baseline weight, pretreatment values, energy intake and MET, the changes in BMD in the Low-Ca, Mid-Ca and High-Ca groups were, respectively, −1·00, −0·51 and −0·45 % for the whole body, 1·73, 1·71 and 1·94 % for the lumbar spine and −1·60, −1·35, and −0·99 % for the total left hip. However, those differences were not statistically significant with or without adjustment for covariates (P: 0·2–0·9). The findings of the complete case analysis indicated that Ca had no significant effects at either measured site (Table 4). Those results were similar after controlling for covariates (online Supplementary Table S2). In addition, neither intention-to-treat analysis (online Supplementary Table S1) nor complete case analysis (online Supplementary Tables S2 and S3) revealed any statistically significant group differences in BMC at any of the bone sites under study.
Table 3 The intention-to-treat analysis of means of bone mineral density at baseline and its percentage changes during intervention using ANOVA (Mean values and standard deviations)
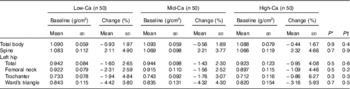
Low-Ca, low Ca group; Mid-Ca, middle Ca group; High-Ca, high Ca group.
* P for the differences of baseline values.
† P for the differences of percentage changes.
Table 4 The complete case analysis of the percentage changes of bone mineral density at measured sites using ANOVA (Mean values and standard deviations)
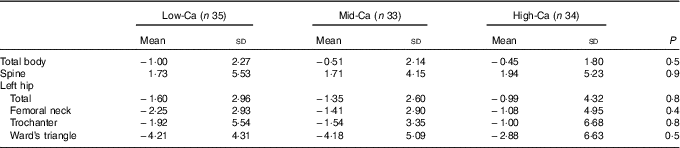
Low-Ca, low Ca group; Mid-Ca, middle Ca group; High-Ca, high Ca group.
Using multiple linear regression analysis, BMD in the whole body, the lumbar spine, the total hip and the femur neck was found to decrease by 0·20, 0·48, 0·36 and 0·38 % (all P<0·01), respectively, with monthly increments in total lactation time. With a 1-kg weight loss, the BMD of the lumbar spine, the total hip, the femur neck and Ward’s triangle decreased by 0·25, 0·17, 0·26 and 0·33 %, respectively (all P<0·05) (Table 5).
Table 5 The final models from multiple regression analysis of the independent effect of group allocation, duration of lactation and other potential predictors on percentage changes of bone mineral density at measured sitesFootnote * (β Coefficients with their standard errors)
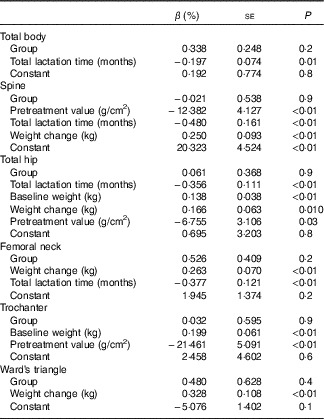
* Independent variables: the first block variable included group allocation (method enter); age, pretreatment value, the dietary intake of energy, metabolic equivalent score during the follow-up period, weight at baseline and its change and total lactation time were put in the second block (method step-wise). Significance levels for entry and removal from the model were 0·05 and 0·10. The independent variables are shown in the order they were entered.
Discussion
To the best of our knowledge, we first examined the effects of Ca supplementation on the bone mineral status of Chinese postpartum lactating women. Our findings indicated that postpartum lactating women with a mean total Ca consumption ranging from 762 to 1267 mg/d in the form of milk powder for 1 year after delivery showed similar bone mineral changes.
Cross et al. ( Reference Cross, Hillman and Allen 15 ) found that 1 g of Ca supplement administered daily for 3 months yielded none of the anticipated increase to BMD in women with a habitual Ca intake of 1100 mg/d. Kalkwarf et al.( Reference Kalkwarf, Specker and Bianchi 16 ) reported that 1 g of elemental Ca/d as calcium carbonate given for 6 months showed no effects on bone health in lactating women with a baseline Ca consumption of 614 mg/d. In addition, calcium carbonate supplementation (1 g/d) for 12 months was found to have no significant effects on the measured bone variables of sixty lactating Gambia women accustomed to a very low Ca intake (283 mg/d)( Reference Prentice, Jarjou and Stirling 4 , Reference Prentice, Jarjou and Cole 17 ). In agreement with those studies, we found that extra Ca supplementation had no beneficial effects on the bone mineral status of Chinese postpartum lactating women.
The effect of Ca supplementation on bone mineral deposition may depend on habitual Ca intake, and supplementation may primarily affect individuals with low dietary intakes of Ca. Approximately 97·5 % of the women involved in our study consumed milk and dairy products during pregnancy, and 85 % of the participants took Ca supplements. Thus, we cannot rule out the possibility that the null findings of our study are due in part to the participants’ high spontaneous Ca consumption at baseline. However, we compared the group differences among those subjects with baseline total Ca intake lower than the median value, and the results were similar (data not shown). In addition, as previously mentioned, a 1-g Ca intervention was found to have no effects on Gambia women with a habitual Ca intake of only 283 mg/d( Reference Prentice, Jarjou and Cole 17 ). Additional studies are required to determine the effects of Ca supplementation on breast-feeding women with a low habitual Ca intake.
The effects of the supplements on our participants may also have been masked by factors such as lactation duration, weight change, physical activity and intake of other nutrients. However, the three supplements administered in this study had similar nutrient profiles. The participants were asked to maintain their usual dietary habits and patterns of physical activity throughout the study. The three treatment groups exhibited comparable changes in dietary energy and nutrient intake and physical activity levels. Unlike Kalkwarf et al. ( Reference Kalkwarf, Specker and Bianchi 16 ), we did not schedule and individually differentiate lactation period and weaning time, but no statistically significant group differences were observed in breast-feeding time. Therefore, it is very unlikely that these covariates generated bias in our results.
Another alternative possibility for our negative results may be that 12 months was not long enough for some of the changes in bone mineral to take effect. Late lactation and the period immediately post-weaning have been thought to be times of bone recovery( Reference Prentice 1 ). Studies have shown that both intestinal Ca absorption and renal retention of Ca increase after weaning( Reference Kalkwarf, Specker and Heubi 21 ). Additionally, studies on rodents have shown a dramatic increase in bone formation during weaning compared with the lactation period( Reference Ardeshirpour, Dann and Adams 22 , Reference Bowman, Siska and Miller 23 ). These findings suggest that extra Ca intake may facilitate bone mineral replenishment during weaning. This observation is supported by the pattern of the lumbar spine bone loss recovery in Ca-supplemented and placebo groups observed by Karkwarf et al.( Reference Kalkwarf, Specker and Bianchi 16 ), who reported a significantly greater increase in bone density in Ca-supplemented group than in placebo group (5·9 v. 4·4 %; P<0·001). In our trial, more than half of the mothers nursed their babies for longer than 9 months, and 3·9 % of women were still breast-feeding at the time of the 12-month DXA scan. For 55·8 % of the mothers, the final measurements were taken <3 months after the cessation of breast-feeding, allowing insufficient time for their bone to respond to the extra Ca. More time may be needed for small incremental benefits to accrue into a measurable outcome. Prolonging the intervention period may augment bone gain of the subjects with higher supplemental Ca. However, an open design of lactating women with a scheduled lactation period of 6 months indicated that daily oral Ca supplements of 1 g had a transient effect on bone loss, which was negligible at 18 months postpartum( Reference Polatti, Capuzzo and Viazzo 7 ). More research is necessary to elucidate the influence of the duration of supplementation.
In studies on biomarkers of bone turnover, extra Ca has been found to have no direct or little effect on the physiological mechanisms that furnish Ca for breast milk production( Reference Prentice, Jarjou and Stirling 4 , Reference Laskey, Prentice and Hanratty 13 , Reference Kalkwarf, Specker and Ho 24 ). It has been proposed that the alteration in Ca and bone metabolism that accompanies human lactation is a physiological, homoeorhetic response. Many other factors may be involved in directing the Ca flux out of and into the bone( Reference Prentice, Jarjou and Stirling 4 , Reference Sowers, Zhang and Hollis 25 ). Parathyroid hormone-related protein derived from the mammary gland has been identified as a prime physiological mediator of bone loss during lactation, in combination with the suppressed oestrogen levels characteristic of lactation( Reference Sowers, Hollis and Shapiro 26 , Reference Dobnig, Kainer and Stepan 27 ).
There were several limitations in the present study. First, we experienced a 32 % dropout rate. However, the subjects who completed and those who withdrew from the trial had similar baseline characteristics. Although large samples are generally needed to verify negative findings, we believe that it is unlikely to find a clinically meaningful effect of Ca on BMD even with a larger sample size, because the BMD changes observed were very small, well within the error of the measurement and would generally not be considered clinically significant. Second, the source of Ca supplement in the present study was milk salt, which also contained other micronutrients except for Ca (online Supplementary Table S4). However, the content of those nutrients was far below their habitual consumption compared with Ca. Although some of them are also bone-related nutrients, their effects tended to be very small. Third, our study may also have been limited by the absence of a placebo group. We chose not to set up a placebo group, because nearly all the subjects habitually consumed dairy products, and the high consumption of dairy products by Chinese lactating women has also been confirmed by Chen et al.( Reference Chen, Wang and Han 28 ). Therefore, the habitual Ca intake of the participants in the group receiving 300 mg of Ca supplements and avoid other forms of dairy products may well represent that of Chinese lactating women. Fourth, the women were already consuming the supplemented milk powder when the baseline measures were taken. However, the duration was very short (1 week) relative to the length of bone remodelling cycle (6 months)( Reference Hadjidakis and Androulakis 29 ) and the intervention period (12 months); therefore, this would not affect our estimates. Moreover, we did not assess vitamin D intake because of the absence of data on the vitamin D content of food in China. We also have not determined the participants’ vitamin D status, owing to the limited grants. However, milk powder administered to all of the groups contained the same amount of vitamin D (5 μg/d), which was below the dietary reference intake for vitamin D, established by the Institute of Medicine (15 μg/d)( Reference Ross, Taylor and Yaktine 30 ). This dosage, which was applied to all women, in addition to the randomised parallel trial design of the study, makes it very unlikely that variation in vitamin D intake biased our results.
In summary, postpartum lactating women with a mean total Ca intake ranging from 762 to 1267 mg/d exerted similar influences on the bone mineral status through 12-month milk powder intervention.
Acknowledgements
The authors are grateful to the participants joined in this study and to the doctors and nurses facilitating both the recruitment of participants and the interviews.
The study was supported by the 11th Five Year Key Programs for Science and Technology Development of China (no. 2008BAI58B02).
Y.-X. S. and X.-G. Y. conceived and designed the study and obtained the grants; Z.-Q. Z. and R.-Q. W. collected the data; Z.-Q. Z. and Y.-M. C. analysed the data; Z.-Q. Z. wrote the draft paper; and Z.-W. H. and Y.-X. S. critically revised the paper. All authors approved the final submitted version.
The authors declare no conflicts of interest.
Supplementary material
For supplementary material/s referred to in this article, please visit http://dx.doi.org/doi:10.1017/S0007114515003967


