


1. Introduction
Low dimensionality often leads to the emergence of fascinating physical phenomena and the development of advanced materials, for example, the quantum Hall effect, graphene and topological insulators. Reduction of dimensionality is also sometimes desired for effective modelling and efficient simulation. Turbulence, as one of the great unsolved mysteries in classical physics, is three-dimensional (3-D) in nature, and it has an enormous number of degrees of freedom (Frisch Reference Frisch1995). In some circumstances, confinement in one dimension leads to a two-dimensional (2-D) turbulence system, where a novel dual-cascade scenario is predicted and observed (Boffetta & Ecke Reference Boffetta and Ecke2012). Further geometrical confinement leads to a quasi-one-dimensional (quasi-1-D) geometry, for example, a long pipe, an air duct and a deep well. However, turbulent flows in such quasi-1-D geometries are much less explored compared with their 2-D and 3-D counterparts. In this study, we take Rayleigh–Bénard (RB) convection (RBC) as a platform to explore the effect of quasi-1-D geometry on heat transfer.
RBC is a paradigmatic system for the study of thermal convection that occurs widely in nature and in daily life (Ahlers, Grossmann & Lohse Reference Ahlers, Grossmann and Lohse2009; Lohse & Xia Reference Lohse and Xia2010; Chillà & Schumacher Reference Chillà and Schumacher2012; Xia Reference Xia2013). It concerns the flows in an infinite slab of fluid layer that is heated from below and cooled from above. However, most of the existing experiments, numerical simulations and theoretical analyses are carried out in 3-D domains with a finite aspect ratio  $\varGamma$, which is defined as the ratio between the horizontal scale and vertical scale of the convection domain (with a typical value of about one). Extending the convection domain to large aspect ratio ( $\varGamma > 1$) significantly changes the flow structure but has only a minor effect on heat transport (Funfschilling et al. Reference Funfschilling, Brown, Nikolaenko and Ahlers2005; Pandey, Scheel & Schumacher Reference Pandey, Scheel and Schumacher2018; Stevens et al. Reference Stevens, Blass, Zhu, Verzicco and Lohse2018; Zhu & Zhou Reference Zhu and Zhou2021).
On the other hand, experiments and simulations conducted in quasi-2-D RB cells reveal a novel flow regime, i.e. the ‘plume-controlled’ regime (Huang et al. Reference Huang, Kaczorowski, Ni and Xia2013; Chong et al. Reference Chong, Huang, Kaczorowski and Xia2015; Xia et al. Reference Xia, Huang, Xie and Zhang2023), for which the transport properties of the system are controlled by the coherence of thermal plumes rather than the boundary layer. Nevertheless, quasi-1-D RBC is much less explored, in which the increased drag from the lateral sidewall will inevitably change the flow morphology as well as the heat transport behaviour. Until most recently, simulations of quasi-1-D RBC have been conducted as a way of saving computational resources in order to push the Rayleigh number to the highest attainable values (Hartmann et al. Reference Hartmann, Chong, Stevens, Verzicco and Lohse2021; Shishkina Reference Shishkina2021; Ahlers et al. Reference Ahlers, Bodenschatz, Hartmann, He, Lohse, Reiter, Stevens, Verzicco, Wedi and Weiss2022). However, experimental studies on quasi-1-D RBC are rare (Roche et al. Reference Roche, Gauthier, Kaiser and Salort2010; de Wit et al. Reference de Wit, Aguirre Guzmán, Madonia, Cheng, Clercx and Kunnen2020), especially for the measurement of heat transfer near the onset of convection, which suffers from severe sidewall heat leakage (Zhang, Chong & Xia Reference Zhang, Chong and Xia2019).
With the above in mind, in this study, we designed a honeycomb structure that divides a traditional RBC cell into dozens of parallel-connected slender convection domains. Heat transport measurements were carried out for flow states ranging from the onset of convection to fully developed turbulence. We also conducted complementary direct numerical simulations (DNS) to explore the different flow regimes in great detail.
The rest of the paper is organized as follows. In § 2, brief introductions to the experimental and numerical set-ups are provided. Then the main results and discussions are presented in § 3, which is further divided into four subsections. In § 3.1, we present the measured onset Rayleigh numbers as functions of different aspect ratios. The effective  $Nu$–
$Nu$– $Ra$ scaling after the onset of convection is discussed in § 3.2. In § 3.3, the flow states are explored in more detail using the DNS data. The corresponding heat transfer regimes and the phase diagram are summarized in § 3.4. Finally, we conclude the present work with § 4.
2. Experimental and numerical set-ups
2.1. Experiments
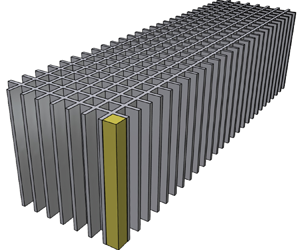
In the experiment, a rectangular RB cell with a cross-section of  $L\times W = 126\ {\rm mm} \times 38\ {\rm mm}$ is used. A quasi-1-D RBC domain is realized by inserting a 3-D printed structure into the convection cell (Zhang & Xia Reference Zhang and Xia2023), which divides the original domain into dozens of parallel-connected subdomains (figure 1a). The cross-section of the 3-D printed structure is a square lattice, and the lattice spacing equals $\varGamma H$ (figure 1b), where $H$ is the height and $\varGamma$ is the aspect ratio of the subdomain. The structure is made by a commercial 3-D printer (JG AURORA, Model A8) using a polylactic acid (PLA) filament. The density, thermal conductivity and specific heat capacity of PLA are about $1.2 \times 10^3\ {\rm kg}\ {\rm m}^{-3}$, $0.15\ {\rm W}\ ({\rm m}\ {\rm K})^{-1}$ and $1.6 \ {\rm kJ}\ ({\rm kg}\ {\rm K})^{-1}$, respectively. The outermost sidewall of the convection cell is made of 4 mm thick Plexiglas, whose density, thermal conductivity and specific heat capacity are about $1.2 \times 10^3\ {\rm kg}\ {\rm m}^{-3}$, $0.21\ {\rm W}\ ({\rm m}\ {\rm K})^{-1}$ and $1.0 \ {\rm kJ}\ ({\rm kg}\ {\rm K})^{-1}$. Distilled and deionized water is used as the working fluid and the bulk temperature is set to be $40.0\,^\circ {\rm C}$, which corresponds to a Prandtl number of $Pr = 4.38$. So the thermal diffusivities of the sidewall materials and the working fluids are of the same order. Additionally, over 6 cm thick polystyrene foam (whose thermal conductivity is about $0.03\ {\rm W}\ ({\rm m}\ {\rm K})^{-1}$) is wrapped around the outermost sidewall to prevent heat leakage to the surroundings.

Figure 1. (a) Photo of the convection cell. (b) Schematic drawing of the 3-D printed structure used in the experiment. The highlighted region shows a single quasi-1-D RB convection domain.
For such a configuration, most of the subdomains are isolated from the outermost sidewall, and therefore cannot directly exchange heat with the environment. Using this set-up, we can systematically vary the height  $H$ as well as the aspect ratio $\varGamma$ of a single subdomain and thereby explore the heat transport behaviour in a quasi-1-D RBC domain. Ten sets of structures are fabricated with four different aspect ratios, namely, $\varGamma = 0.05$, 0.1, 0.16 and 0.3. Since the length ( $L$) and width ( $W$) of the convection cell are fixed in the present experiment, and only integral numbers of subdomains are allowed (in both horizontal directions), we have to adjust the thickness of the PLA wall accordingly for specific values of $H$ and $\varGamma H$, which turns out to vary from 0.9 mm to 1.2 mm. Moreover, a homemade thermostat whose temperature is set the same as the working fluid is also applied to minimize sidewall heat leakage. For more details of the heat transfer measurement, readers are referred to Zhang & Xia (Reference Zhang and Xia2023).
2.2. Direct numerical simulations
For a detailed inspection of the velocity and temperature fields in a quasi-1-D RBC domain (see the highlighted region in figure 1b), we conduct complementary DNS. The CUPS code is adopted to solve the governing equations using a fourth-order finite-volume method on staggered velocity and temperature grids (Chong, Ding & Xia Reference Chong, Ding and Xia2018a). All boundaries are no-slip and the sidewalls are set to be adiabatic. The possible sidewall effect (Wan et al. Reference Wan, Wei, Verzicco, Lohse, Ahlers and Stevens2019) and thermal coupling effect between adjacent subdomains in the experiment are not considered for the sake of simplicity.
3. Results and discussions
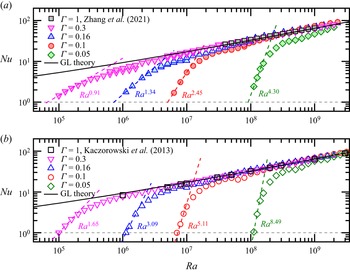
Figures 2(a) and 2(b) show the  $Nu$–
$Nu$– $Ra$ relations for four different aspect ratios obtained by experiment and DNS, respectively. For comparison, data obtained in cells with aspect ratios of unity are plotted as well. The error bars (taken as one standard deviation of the measured Nusselt number time series) are within the size of a symbol and therefore not shown. It is seen that the experimental and numerical results show qualitatively good agreement. Firstly, the onset of convection (the intersection point of the $Nu$–
$Nu$– $Ra$ curve with the dashed horizontal line of $Nu = 1$) is considerably postponed as the cell approaches the quasi-1-D limit ( $\varGamma \ll 1$). Secondly, the effective local $Nu$–
$Nu$– $Ra$ scaling exponent ( $\beta = \partial (\log Nu)/\partial (\log Ra)$) just after the onset of convection shows a rapid increase with decreasing $\varGamma$. Finally, when the Rayleigh number is large enough, the experimental and numerical data points with different aspect ratios all collapse onto the black solid curves, which represent the predictions of the Grossmann–Lohse (GL) theory (Grossmann & Lohse Reference Grossmann and Lohse2000, Reference Grossmann and Lohse2001, Reference Grossmann and Lohse2002; Stevens et al. Reference Stevens, van der Poel, Grossmann and Lohse2013). We discuss these features in detail below.

Figure 2. (a) The experimentally measured  $Nu$ versus $Ra$ data for RBC domains with different aspect ratios. (b) The corresponding $Nu$–
$Nu$– $Ra$ relations obtained by DNS. The dashed lines in both panels show power-law fits to the data points near onset, and the solid lines represent predictions of the GL theory.
3.1. The onset Rayleigh number  $Ra_c$

Figure 3(a) shows the log–log plot of the onset Rayleigh number  $Ra_c$ as a function of the aspect ratio $\varGamma$. The red stars and blue squares denote the experimental and numerical data of the present study, respectively. We also plot the critical Rayleigh numbers obtained from the literature (Catton & Edwards Reference Catton and Edwards1970; Muller, Neumann & Weber Reference Muller, Neumann and Weber1984; Hébert et al. Reference Hébert, Hufschmid, Scheel and Ahlers2010). It is seen that all the data points fall onto a solid curve with $Ra_c=(2{\rm \pi} )^4(1+\varGamma ^{-2})(1+\varGamma ^{-2}/2)$, which is derived by Shishkina (Reference Shishkina2021) for a rectangular cell with an adiabatic sidewall. In the quasi-1-D limit ( $\varGamma \ll 1$), the above equation reduces to $Ra_c=8{\rm \pi} ^4\varGamma ^{-4}$. Power-law fits to the present experimental and numerical data yield $Ra_c=328\varGamma ^{-4.18}$ and $Ra_c=810\varGamma ^{-3.95}$ (the solid lines in the inset of figure 3a), which are both consistent with the theoretical prediction above. To the best of our knowledge, this is the first experimental result of the $Ra_c\sim \varGamma ^{-4}$ scaling in the quasi-1-D regime.

Figure 3. (a) The onset Rayleigh number  $Ra_c$ as a function of the aspect ratio $\varGamma$. Red stars are the experimental data and blue squares are obtained by DNS. The grey solid curve shows the theoretical prediction of $Ra_c = (2{\rm \pi} )^2(1+\varGamma ^{-2})(1+\varGamma ^{-2}/2)$ proposed by Shishkina (Reference Shishkina2021). Data from references are also plotted for comparison. The red and blue solid lines in the inset show power-law fits with $Ra_c=328\varGamma ^{-4.18}$ and $Ra_c=810\varGamma ^{-3.95}$, respectively. (b) The effective near-onset Nusselt–Rayleigh scaling exponent $\beta$ as a function of the aspect ratio $\varGamma$. The legend is the same as for panel (a). The red and blue solid lines show power-law fits with $0.290\varGamma ^{-0.90}$ and $0.564\varGamma ^{-0.92}$, respectively.
Though the negative biquadratic power law obtained in a quasi-1-D RBC domain is in sharp contrast with its quasi-2-D counterpart  $Ra_c\sim \varGamma ^{-2}$ (Chong & Xia Reference Chong and Xia2016), it is worth noting that it has the same form as the onset Rayleigh number of rotating Rayleigh–Bénard convection (RRBC), which scales as $Ra_c\sim Ek^{-4/3}\sim (l/H)^{-4}$, where $Ek$ is the Ekman number, which quantifies the strength of rotation, and $l$ is the horizontal scale of convection near onset. This also suggests that applying geometrical constraint and dynamical constraint to thermal convection may share the same underlying mechanism for the changes in heat transport properties (Chong et al. Reference Chong, Yang, Huang, Zhong, Stevens, Verzicco, Lohse and Xia2017; Lim et al. Reference Lim, Chong, Ding and Xia2019; Xia et al. Reference Xia, Huang, Xie and Zhang2023).
3.2. The $Nu$–$Ra$ scaling near onset


Another striking feature of the heat transfer in a quasi-1-D RBC domain is that the  $Nu$–
$Nu$– $Ra$ curve shows a steep slope on a log–log plot near the onset Rayleigh number. Such behaviour can be described quantitatively by an effective scaling exponent $\beta$, which is obtained by applying a power-law fit to the near-onset data points (see the dashed lines in figure 2b). It is seen that the corresponding local scaling exponent $\beta$ increases rapidly with decreasing aspect ratio. For the lowest aspect ratio explored in this study ( $\varGamma = 0.05$), the local scaling exponent is $\beta = 4.30$ for the experiment and $\beta = 8.49$ for the DNS. Stevens, Lohse & Verzicco (Reference Stevens, Lohse and Verzicco2014) conducted a systematic DNS to explore the effects of different sidewall temperature boundary conditions in a single RBC domain. They found that the heat transfer efficiencies for an isothermal sidewall boundary condition and an adiabatic condition can differ by over 10 % at a Rayleigh number of $2 \times 10^8$. The Nusselt numbers for cells with finite sidewall thicknesses are in between the above two ideal cases – see figure 9 in Stevens et al. (Reference Stevens, Lohse and Verzicco2014). A possible reason for the discrepancy in $\beta$ is the different sidewall thermal boundary conditions: most of the quasi-1-D subdomains in the experiment are thermally coupled with their nearest neighbours, while the DNS assumes that the sidewall is adiabatic.
Figure 3(b) show the  $\beta$– $\varGamma$ relations obtained from figure 2. Power-law fits to the data yield $\beta =0.290\varGamma ^{-0.90}$ for the experiment and $\beta =0.564\varGamma ^{-0.92}$ for the DNS, respectively. Similar behaviour of heat transport is also observed in RRBC: for a rapidly rotating cell, the effective near-onset local $Nu$–
$Nu$– $Ra$ scaling exponent also shows a rapid increase with decreasing Ekman number (Cheng et al. Reference Cheng, Stellmach, Ribeiro, Grannan, King and Aurnou2015; Plumley & Julien Reference Plumley and Julien2019). It is also worth mentioning that in our quasi-1-D RBC configuration, the extremely rapid increase of $Nu$ serves to divide the flow roughly into two states: before onset the system is in a ‘thermal insulating’ state, in which heat is transported by conduction only; after onset the system turns into a ‘thermal conducting’ state, in which heat is transferred efficiently by turbulent convection. In this sense, the present system can be viewed as a ‘convective thermal diode’ (Wehmeyer et al. Reference Wehmeyer, Yabuki, Monachon, Wu and Dames2017), which might be used for advanced thermal control or other engineering applications.
In figures 4(a) and 4(b), we present the compensated plots of  $(Nu-1)/Ra_c^{1/3}$ versus $Ra/Ra_c$ obtained from the experiment and DNS, respectively. For comparison, Nusselt numbers measured near the convective onset in a cylindrical cell with $\varGamma = 2$ (Behringer & Ahlers Reference Behringer and Ahlers1982) were also plotted in figure 4(a). It is seen that the curves with different aspect ratios basically collapse onto a single master curve even for the near-onset regime, where the effective scaling exponent shows a gradual transition to the classical value of 1/3 within one decade of the reduced Rayleigh number $Ra/Ra_c$. Though an explicit explanation for this universal behaviour is not yet available, we hope that a theoretical understanding will come up in the near future. Experimentally, it would also be quite interesting to push $\varGamma$ to even smaller values to see whether the near-onset local $Nu$–
$Nu$– $Ra$ scaling exponent will increase further or not.

Figure 4. Compensated plots of  $(Nu-1)/Ra_c^{1/3}$ versus $Ra/Ra_c$ for (a) the experimental data and (b) the numerical data.
3.3. The near-onset flow structure
Figure 5(a) shows the streamlines obtained by DNS for different aspect ratios. The Rayleigh number is fixed at  $Ra=1.1Ra_c$. It is seen that a feature of the flow is an elongated, stretched cell structure. It consists of a hot, ascending flow on one side and a cold, descending flow on the other side. Figures 5(b) and 5(c) show vertical profiles of the root mean square (r.m.s.) temperature $\langle (T-\langle T\rangle _{x,y})^2\rangle ^{1/2}_{x,y}$ and the r.m.s. vertical velocity $\langle w^2\rangle ^{1/2}_{x,y}$, respectively. Here $\langle {\cdot }\rangle _{x,y}$ denotes averaging over a certain horizontal plane. It is seen that the two profiles have almost the same shape, which is in line with the prediction that the temperature variation and vertical velocity are highly correlated when the nonlinearity effect is weak (Chandrasekhar Reference Chandrasekhar1961).

Figure 5. (a) Streamlines in the near-onset regime  $Ra/Ra_c = 1.1$ for different aspect ratios, with different colours showing the local temperatures. (b) Vertical profiles of the temperature variations for different aspect ratios. (c) The corresponding profiles of the vertical velocity variations.
With these facts, the above  $Ra_c\sim \varGamma ^{-4}$ scaling, which was recently derived by Shishkina (Reference Shishkina2021) and Ahlers et al. (Reference Ahlers, Bodenschatz, Hartmann, He, Lohse, Reiter, Stevens, Verzicco, Wedi and Weiss2022), can also be understood in a different way as follows. We start with the exact balance between dissipation and global heat transfer. If we denote by $\delta _w$ and $\delta _T$ the typical vertical velocity and temperature scales of the ascending/descending flow observed in figure 5(a), then the exact relations for viscous dissipation and thermal dissipation in the near-onset regime ( $Ra\rightarrow Ra_c$) read
 \begin{gather} \epsilon_u = \frac{\nu^3}{H^4}Pr^{{-}2}Ra_c(Nu-1)\sim \nu\left(\frac{\delta_w}{\varGamma H}\right)^2, \end{gather}
 \begin{gather}\epsilon_T = \kappa\frac{\varDelta^2}{H^2}Nu\sim\kappa\left(\frac{\delta_T}{\varGamma H}\right)^2 + \kappa\frac{\varDelta^2}{H^2}. \end{gather}
Moreover, considering the fact that the temperature and velocity fields are highly correlated, the Nusselt number can also be expressed as
 \begin{equation} Nu-1 \sim \frac{\delta_w\delta_T}{\kappa\varDelta/H}. \end{equation}
 Moving the last term in (3.2) to the left-hand side yields  $\kappa (\varDelta /H)^2(Nu-1)\sim \kappa [\delta _T/(\varGamma H)]^2$. If we now multiply this by (3.1), and then substitute the term $Nu-1$ with (3.3), we can obtain
 \begin{equation} Ra_c\sim\varGamma^{{-}4}. \end{equation}
 It is also worth mentioning that, for a quasi-2-D RBC domain (Chong & Xia Reference Chong and Xia2016), (3.1) is still valid, whereas (3.2) should be replaced by  $\epsilon _T = \kappa (\varDelta /H)^2Nu\sim \kappa (\delta _T/H)^2 + \kappa (\varDelta /H)^2$. We can then obtain $Ra_c\sim \varGamma ^{-2}$, which is in agreement with the scaling derived using linear stability analysis (Bizon et al. Reference Bizon, Werne, Predtechensky, Julien, McCormick, Swift and Swinney1997).
Another interpretation for the  $Ra_c\sim \varGamma ^{-4}$ scaling originates from linear stability analysis. Suppose that the vertical velocity perturbation near onset has the form $w=W(z)\exp [{\rm i}(k_xx+k_yy)]$. It should satisfy the following sixth-order ordinary differential equation (Chandrasekhar Reference Chandrasekhar1961):
 \begin{equation} \left(\frac{\partial^2}{\partial z^2}-k^2H^2\right)^3 W ={-}Ra(kH)^2W, \end{equation}
where  $k = \sqrt {k_x^2+k_y^2}$ is the wavenumber. For the present system, the no-slip boundary condition requires that $kH\sim \varGamma ^{-1}$. As shown in figure 5(b), the r.m.s. vertical velocity does not exhibit any appreciable change in the core region of the quasi-1-D cell, which implies that $\partial ^nW/\partial z^n = 0$. Substituting this (assuming it holds up to sixth order) into (3.5) again results in $Ra\sim (kH)^4\sim \varGamma ^{-4}$.
We remark that it is quite surprising that the typical temperature and velocity scales are both invariant with height in a quasi-1-D cell. This feature is neither predicted by the exact solution of the velocity profile in a horizontally unconstrained domain (Chandrasekhar Reference Chandrasekhar1961), nor described by the eigenmodes of the Laplace operator (Shishkina Reference Shishkina2021). Nevertheless, this feature reminds us of the Taylor–Proudman theorem, which states that, for a rapidly rotating convection system, the velocity will be uniform along any line parallel to the axis of rotation. The Taylor–Proudman theorem implies a balance between the Coriolis force and the pressure gradient in RRBC, while the dominant force balance in a quasi-1-D RBC cell is between viscous force and buoyancy.
3.4. Different heat transfer regimes and the phase diagram
Figures 6(a) and 6(b) show the normalized and compensated Nusselt numbers as functions of Rayleigh number, respectively. The  $Nu$–
$Nu$– $Ra$ relations measured in cells with unity aspect ratio ( $\varGamma =1$) are taken as benchmarks for the normalization (see the solid and open squares in figure 2). Power-law fits to these data yield $Nu_{\varGamma =1} = 0.192Ra^{0.282}$ for the experiment (Zhang, Ding & Xia Reference Zhang, Ding and Xia2021) and $Nu_{\varGamma =1} = 0.135Ra^{0.297}$ for the DNS (Kaczorowski & Xia Reference Kaczorowski and Xia2013). It is seen that heat transfer enhancement is achieved for all four aspect ratios providing the Rayleigh number exceeds a certain threshold value. For the parameter range explored, maximum heat transfer enhancement is observed for $\varGamma = 0.1$ at $Ra=1.3\times 10^9$, which is about 10 %. This is in agreement with the recent numerical simulations of Hartmann et al. (Reference Hartmann, Chong, Stevens, Verzicco and Lohse2021).

Figure 6. (a) The normalized Nusselt number  $Nu/Nu_{\varGamma = 1}$ as functions of Rayleigh number for different aspect ratios. Solid symbols show the experimental data and open symbols are obtained by DNS. (b) Compensated plot of the $Nu$–
$Nu$– $Ra$ relations taken from DNS. The dashed lines show fits with a transition function $f(Ra)=ARa^{\alpha _2}[1+(Ra_0/Ra)^4]^{(\alpha _2-\alpha _1)/4}$.
For a quantitative determination of the heat transfer enhancement regime, we use the transition function  $f(Ra)=ARa^{\alpha _2}[1+(Ra_0/Ra)^4]^{(\alpha _2-\alpha _1)/4}$ to fit the DNS data, where $A$,
$A$,  $\alpha _1$, $\alpha _2$ and $Ra_0$ are four independent fitting parameters. When $Ra\ll Ra_0$, the function above approaches $f(Ra)\approx ARa_0^{\alpha _2-\alpha _1}Ra^{\alpha _1}$; while in the limit of $Ra\gg Ra_0$, it reduces to $f(Ra)\approx ARa^{\alpha _2}$. Therefore, such a functional form can be adopted to describe the transition between two power laws, and the fitting parameter $Ra_0$ can be interpreted as a transitional Rayleigh number. The fits are carried out to the numerical data points shown in figure 6(b). For the case of $\varGamma = 0.3$, the fitting is only done with data points up to $Ra = 2\times 10^8$, beyond which the data converge to the case of $\varGamma = 1$. The fitting results are plotted as dashed curves in figure 6(b). The parameters are listed in table 1. When $\alpha _1=\alpha _2$, the function above is identical to a power law. The range of the heat transfer enhancement regime ( $Ra_{t1}, Ra_{t2}$) is then determined by the intersection points of the dashed curves and the solid line. Fitting $Ra_{t1}$ and $Ra_{t2}$ with power laws of $\varGamma$ yield $Ra_{t1}\sim \varGamma ^{-3.6}$ and $Ra_{t2}\sim \varGamma ^{-4.1}$, respectively.
Table 1. Fitting parameters and the corresponding transition Rayleigh numbers.

Next, we plot in figure 7(a) the flow fields at different Rayleigh numbers in a  $\varGamma = 0.3$ cell. Near onset ( $Ra = 10^5$), the flow is static and exhibits a stretched cell structure, as mentioned above. With increasing Rayleigh number ( $Ra = 10^6$), the flow is strengthened and corner flows are gradually developed. A further increase in $Ra$ breaks the stretched cell structure and the flow eventually becomes turbulent. In this regime, thermal plumes are generated in the corners of the cell and then emitted into the bulk region. Thereafter, they merge and condense into a highly coherent giant plume, and then impinge on the opposite plate, thus facilitating efficient heat transport. This heat transfer enhancement regime is also known as the ‘plume-controlled’ regime (Xia et al. Reference Xia, Huang, Xie and Zhang2023). The transition in flow state is also reflected in the thermal boundary-layer behaviour.

Figure 7. (a) Streamlines at different Rayleigh numbers in a  $\varGamma = 0.3$ convection domain, with different colours showing the magnitude of the vertical velocity. (b) Snapshots of temperature fluctuations $(T-\langle T\rangle _{x,y})/\sigma _T$ in a horizontal cross-section located at one thermal boundary-layer thickness away from the bottom plate. (c) Phase diagram of different heat transport regimes in a slender RBC domain. The Prandtl number is fixed at $Pr=4.38$. The open squares correspond to the positions of the snapshots shown in panels (a) and (b).
Figure 7(b) shows snapshots of the normalized temperature fields  $(T-\langle T\rangle _{x,y})/\sigma _T$ in a horizontal cross-section that is located at $z = 1/(2Nu)$ (one thermal boundary-layer thickness away from the bottom plate), where $\sigma _T$ is the r.m.s. temperature in that plane. As the Rayleigh number increases, the symmetry of the flow breaks down. Hot plumes are developed in the corner region and a giant cold plume is formed in the centre of the plane (Chong et al. Reference Chong, Huang, Kaczorowski and Xia2015). Further increase in $Ra$ will squeeze the hot flows to the peripheral of the cell. Meanwhile, sheet-like plumes are gradually developed in the centre of the domain (Zhou & Xia Reference Zhou and Xia2010), which indicates that the flow enters the classical boundary-layer-controlled regime. In this regime, the heat transfer efficiency shows no apparent aspect-ratio dependence (see figure 6b).
With the results above, we map out in figure 7(c) the phase diagram of the heat transport properties for quasi-1-D RBC, with the solid diamonds representing the DNS data. Four regimes are identified, namely, the classical boundary-layer-controlled regime, the plume-controlled regime, the viscous dominant regime and finally the conduction regime. The boundaries separating the different regimes are almost parallel to each other and show power-law scalings close to  $\varGamma ^{-4}$, which are much steeper than those found in a quasi-2-D domain (Chong & Xia Reference Chong and Xia2016). It is also worth mentioning that the Prandtl number may also have a significant effect on the phase diagram (Chong et al. Reference Chong, Wagner, Kaczorowski, Shishkina and Xia2018b; Hartmann et al. Reference Hartmann, Chong, Stevens, Verzicco and Lohse2021), which, of course, deserves further investigation.
4. Conclusions
To conclude, we have made a systematic study of the heat transport properties and flow states in a quasi-1-D RBC cell. The experiments were conducted using a meticulously designed 3-D printed structure. Our results provide the first experimental evidence for the  $Ra_c\sim \varGamma ^{-4}$ scaling in the quasi-1-D regime ( $0.05\leqslant \varGamma \leqslant 0.3$), which is also consistent with recent theoretical predictions and numerical simulations (Shishkina Reference Shishkina2021; Ahlers et al. Reference Ahlers, Bodenschatz, Hartmann, He, Lohse, Reiter, Stevens, Verzicco, Wedi and Weiss2022). In addition, the effective local $Nu$–
$Nu$– $Ra$ scaling exponent just after the onset of convection shows a rapid increase with decreasing aspect ratio as $\beta \sim \varGamma ^{-0.90}$. Subsequent DNS confirm this experimental finding. The discrepancies in the magnitudes of $Ra_c$ and $\beta$ obtained from experiments and simulations are most likely caused by the different lateral thermal boundary conditions. However, despite this difference, both experiment and DNS results show the same flow physics with respect to the heat transport properties.
Our DNS also reveals that the flow in a quasi-1-D RBC cell shows a stretched cell structure near onset and that the typical velocity and temperature scales are invariant with height in the core region of the cell. Based on these findings, we provide several interpretations of the observed  $Ra_c\sim \varGamma ^{-4}$ scaling. Finally, different heat transfer regimes are identified and the corresponding phase diagram is mapped out.
The results of this study suggest that quasi-1-D RBC may be utilized for advanced thermal engineering applications like thermal diodes, thermal regulators and efficient heat exchangers. We also remark that the effect of Prandtl number, as well as a comprehensive theoretical understanding for the heat transfer behaviour in quasi-1-D RBC, remain open questions and call for future studies.
Acknowledgements
We thank Dr Y.-C. Xie and Mr L. Ren for fruitful discussions, and gratefully acknowledge support of this work by the Center for Computational Science and Engineering of Southern University of Science and Technology.
Funding
This work is supported by the National Natural Science Foundation of China (nos. 12202173, 92152104, 12072144 and 12232010) and the Center for Computational Science and Engineering of Southern University of Science and Technology.
Declaration of interests
The authors report no conflict of interest.