


Implications
This work address the main approaches utilised in developing precision livestock farming tools. Precision livestock farming is an approach that enables the farmer with more objective information about the animal to make better choices about the sustainability of their production system. This paper demonstrates some of the key solutions and the approaches taken to develop technologies with sound and image analyses.
Introduction
Economic pressures continue to mount on modern-day livestock farmers. Most farmers now find themselves in a situation where they, in order to maintain their livelihood, must exploit the economies of scale. As a result, those who are surviving often have limited time to interact with their animals. Meanwhile, attention to animal welfare has heightened and stakeholders in the livestock sector are more conscious about managing and slaughtering animals in more welfare-friendly ways (Blokhuis et al., Reference Blokhuis, Veissier, Miele, Jones and Vogt2019). Society in general is demanding closer attention to the needs of individual animal. Thus, for the case of the most intensive livestock sectors, and especially for poultry and pig production (where a large number of animals per farm is involved), the gap between societal and production demands is widening. However, most of the society do not realise that taking good care of the animals is essential to achieve good productivity, health and welfare. Closer attention to the individual animal’s needs does impact not only animal welfare and health but also the capacity of the farmer to achieve sustainability (economic, environmental and societal) targets.
Technology, which is developing at a rapid pace, is enabling a better interaction between animal and farmer despite the challenges faced. Twenty years ago, the ability to carry a personal computer was a novel experience, yet nowadays we have more powerful devices that fit in the pocket. This evolution in the information and communication technologies (ICTs) has had a significant impact on the agricultural industry too. Crop and horticultural production have for the last number of years witnessed an explosion of new software systems, monitoring devices and machines that exploit the latest capabilities in sensing, communication, processing and power management (van Evert et al., Reference van Evert, Fountas, Jakovetic, Crnojevic, Travlos and Kempenaar2017). Since the early 1990s, livestock production has also started to see more research into ICT-supported management of livestock farming systems (Halachmi and Guarino, Reference Halachmi and Guarino2016). Much of the initial developments focused on decision support systems, that is, to simulate many scenarios that affect the economic or sustainability indicators of production. These optimised functions were representative of farm processes and did not seek to interface with the animals themselves. However, the animal is the central part of the process and the technology must support them at every moment to realise a better life for them, as it does for humans.
State-of-the-art technology can bring the animals closer to the farmer. Precision livestock farming (PLF) was developed to provide better information to the farmer on the animals by exploiting the known principles of process engineering to provide a level of automation. Indeed, it seems from recent contributions that PLF is the main force behind industrialising farming (Werkheiser, Reference Werkheiser2018). However, it is in fact much more than that and can instead offer an alternative philosophy to ‘farming by numbers’, because technology can support the farmer. Technology can collect relevant information about the animals in a continuous manner and thereby build more in-depth insight into their requirements. Some animal rights proponents go against this perspective and even argue that technology actually fuels the growth of a factory-based farming industry (Stevenson, Reference Stevenson2017). However, we must recognise that as science gains further knowledge on the care of animals, we can also build better ‘digital representations’ of the animals. This empowers farmers to make better choices that are not alone driven on profits but instead on the actual needs of the animals and their care at all times.
In the literature, various studies have aimed at the development of automatic monitoring systems for livestock production. Examples include monitoring drinking behaviour (Domun et al., Reference Domun, Pedersen, White, Adeyemi and Norton2019) or to detect infected coughs by sound analysis (Exadaktylos et al., Reference Exadaktylos, Silva, Aerts, Taylor and Berckmans2008), assess the thermal comfort (Shao and Xin, Reference Shao and Xin2008) or estimate the live weight (Wu et al., Reference Wu, Tillett, McFarlane, Ju, Siebert and Schofield2004) by means of image processing. Furthermore, during the last couple of years there has been a number of scientific reviews compiling the potential of PLF from the perspective of technology developments addressing key production and environmental challenges (Benjamin and Yik, Reference Benjamin and Yik2019; Halachmi et al., Reference Halachmi, Guarino, Bewley and Pastell2019; Tullo et al., Reference Tullo, Finzi and Guarino2019). Other reviews have discussed the ethical concerns of eroding the relationship between the farmer and the animal that PLF could promote (Werkheiser, Reference Werkheiser2018; Bos et al., Reference Bos, Bovenkerk, Feindt and Van Dam2018). This review will address the key approaches to monitor animals and highlight methods towards building ‘digital representations’ of them by giving an overview of some of the key concepts related to PLF, tool development within image and sound analyses and value discovery during PLF implementation. This review will mainly focus on the examples within the pig and poultry production.
The principles of precision livestock farming
The primary objective of PLF is to develop livestock management and monitoring systems with technologies to support the farmer (Berckmans, Reference Berckmans2014). This includes the use of sensor technology for observing animals (Darr and Epperson, Reference Darr and Epperson2009), the application of modern control theory to improve autonomy of the production process (Frost et al., Reference Frost, French, Tillett, Pridmore and Welch2004), and the use of advanced data processing methods to synthesise and combine different types of data (Terrasson et al., Reference Terrasson, Llaria, Marra and Voaden2016). Precision livestock farming is based on the interaction between different scientific disciplines and stakeholders in the livestock industry. From Figure 1 it is clear that three distinct conditions within a system need to be fulfilled to achieve sufficient levels of monitoring and management to be considered a PLF system (Berckmans, Reference Berckmans2006):
1. Animal variables (i.e. parameters related to the behavioural or physiological state of the animal) need to be measured continuously with accurate and cost-effective sensor technology,
2. A reliable prediction (expectation) must be available on how animal variables will vary or how the animal will respond at every moment, and
3. Predictions and on-line measurements are integrated in an analysing algorithm for automatic monitoring and/or management.
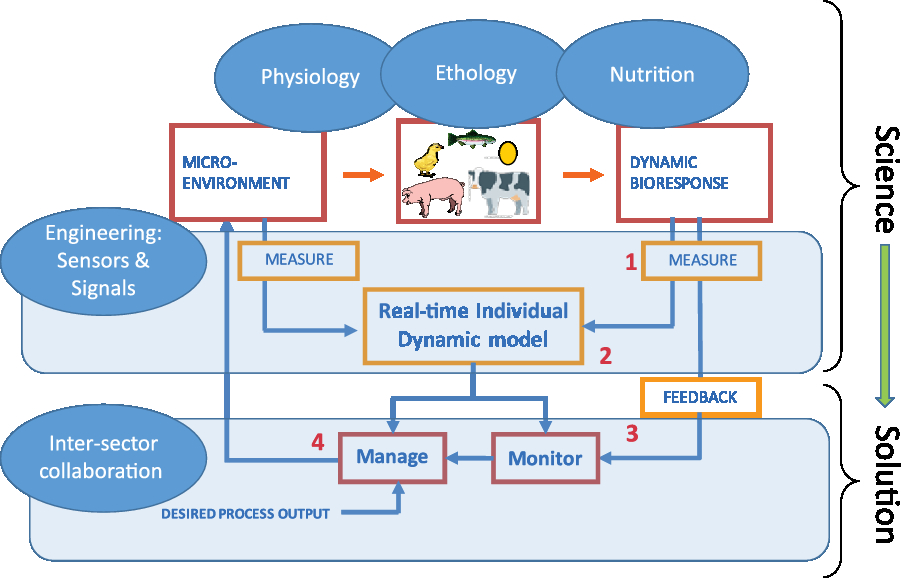
Figure 1 General scheme showing how bio-response monitoring and management of livestock animals can go from science to solutions (Aerts et al., Reference Aerts, Norton and Berckmans2019).
It should be noted that the development of the PLF systems require collaboration among different disciplines. An example of the collaborative PLF methodology (Carpentier et al., Reference Carpentier, Vranken, Berckmans, Paeshuyse and Norton2019) is the development of a system for detection of an occurring chicken respiratory infection (i.e., the target variable), by deriving the amount of coughs over a certain period of time (i.e. the feature variable) from a continuously measured sound signal (i.e. the process output). This methodology is further schematically illustrated in Figure 2. As can be noticed, the scheme also contains the use of gold standards to unambiguously establish the relationship between target and feature variables as well as an audiovisual labelling process. The latter is involved in identifying a number of predefined ‘features’ (e.g. the exact start and end point of each sneeze) from the audio and video recordings. Thus, the PLF methodology demands a high level of collaboration between multiple research fields including animal scientists (e.g. physiologists, ethologists and nutritionists), laboratory technicians, data scientists and engineers among others.
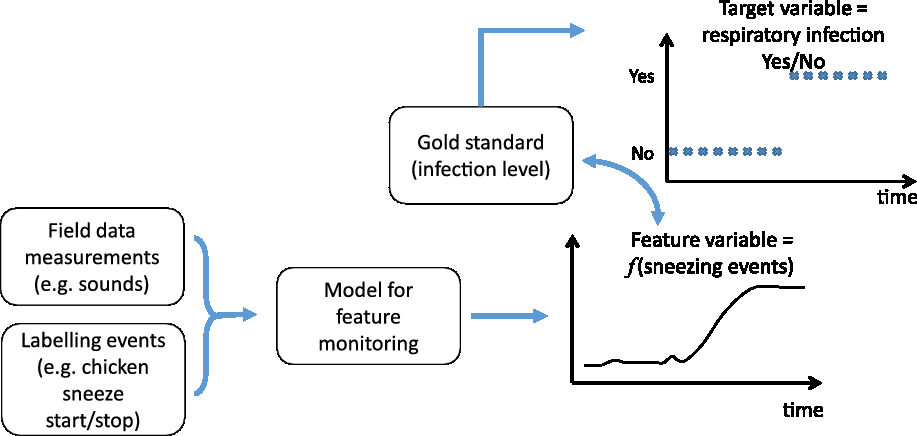
Figure 2 Approach for detection of chicken sneezing events from sound data (adapted from Berckmans (Reference Berckmans2013)).
Monitoring animal variables
As described above, a PLF system includes the monitoring of animal variables, which can be, for example, behavioural or physiological measures. In the following, the review will describe in more detail how such animal variables can be continuously monitored non-invasively using examples from image and sound analyses.
Image analysis
Image analysis has been demonstrated to have potential in monitoring livestock animals since the early 1990s (van der Stuyft et al., Reference van der Stuyft, Schofield, Randall, Wambacq and Goedseels1991). Cameras have the advantage that they do not need to be mounted to the animal itself and, therefore, no extra stress for the animals is induced. Image analysis has been used in the past to measure some important bio-responses regarding health, welfare and growth parameters of the animals including weight estimation (Schofield et al., Reference Schofield, Marchant, White, Brandl and Wilson1999; Mollah et al., Reference Mollah, Hasan, Salam and Ali2010), assessing the gait and lameness of broiler chickens (Aydin et al., Reference Aydin, Cangar, Ozcan, Bahr and Berckmans2010, Reference Aydin, Pluk, Leroy, Berckmans and Bahr2013), measuring the water intake in pigs (Kashiha et al., Reference Kashiha, Bahr, Haredasht Amirpour, Ott, Moons, Niewold, Odberg and Berckmans2013a) and identifying marked pigs in a pen (Kashiha et al., Reference Kashiha, Bahr, Ott, Moons, Niewold, Ödberg and Berckmans2013b). In the following, aggression among pigs will be used as an example of PLF research using image analysis.
Aggression among pigs as an example
A key welfare-focused application of image analysis in the PLF research is to analyse the social interactions of animals. An example of such is aggression among pigs. It is widely recognised that aggression is an important problem that threatens the health, welfare and growth of pigs in modern pig industry (D’Eath and Turner, Reference D’Eath, Turner and Marchant-Forde2009). Usually, aggressive behaviours of pigs are found by direct observation of the producer. However, manual observation is labour-intensive and time-consuming. Detection of such problems with computer vision technologies and image analysis can instead provide advantages of uninterrupted, real-time and continuous monitoring. Using this technology for recognition and control of aggression can help to improve the efficiency of recognition, increase animal welfare and productivity and reduce economic losses of pig farms (Faucitano, Reference Faucitano2001; Bracke et al., Reference Bracke, Metz, Spruijt and Schouten2002). Recently, image analysis has been widely used for behaviour analysis of pigs including tripping and stepping behaviour recognition (Gronskyte et al., Reference Gronskyte, Clemmensen, Hviid and Kulahci2015) and mounting behaviour recognition (Nasirahmadi et al., Reference Nasirahmadi, Hensel, Edwards and Sturm2016). However, as the complexity of aggressive behaviours in pigs is very high, the investigation of aggressive behaviours in pigs based on image analysis has been limited. Viazzi et al. (Reference Viazzi, Ismayilova, Oczak, Sonoda, Fels, Guarino, Vranken, Hartung, Bahr and Berckmans2014) focused on the detection of aggressive behaviour among pigs in general, whereas Oczak et al. (Reference Oczak, Viazzi, Ismayilova, Sonoda, Roulston, Fels, Bahr, Hartung, Guarino, Berckmans and Vranken2014) and Chen et al. (Reference Chen, Zhu, Ma, Guo, Huang and Ruan2017) classified the aggressive behaviour into high- and medium-aggression among pigs. However, only using the high and medium intensity for definition and recognition of aggressive behaviours will be subject to greater interference by other behaviours. For instance, chase and play among pigs can also produce similar high intensities (Viazzi et al., Reference Viazzi, Ismayilova, Oczak, Sonoda, Fels, Guarino, Vranken, Hartung, Bahr and Berckmans2014). Thus, more work is needed to be able to recognise the unwanted behavioural trait, aggression, from the wanted behavioural trait, play, using image analysis. One approach to achieve this distinction would be the ability to recognise specific aggressive markers from image analysis, including the head-to-head knocking, head-to-body knocking, parallel pressing, inverse parallel pressing, ear biting, neck biting, body biting and tail biting (Oczak et al., Reference Oczak, Ismayilova, Costa, Viazzi, Sonoda, Fels, Bahr, Hartung, Guarino, Berckmans and Vranken2013).
A PLF tool that recognises specific behavioural patterns, such as the aggressive behaviour markers of pigs, on the individual animal level by image analysis uses several steps and techniques that is described in the following, including target tracking, extraction of animal foreground, extraction of behavioural features in the data and recognition of important behavioural interactions.
Target tracking
To recognise specific behavioural patterns on the individual level using image analysis first demands a technique that can individually recognise each animal from the other animals in the group. This is also referred to as target tracking. However, presently many computer vision systems have the shortcoming that they cannot perform this task continuously without labelling the animals. Even with manual video recordings it is not easy to assign an identity to each animal and keep track (Oczak et al., Reference Oczak, Viazzi, Ismayilova, Sonoda, Roulston, Fels, Bahr, Hartung, Guarino, Berckmans and Vranken2014). Previously, the solution to this problem was either to evaluate the behaviour at the group level (Viazzi et al., Reference Viazzi, Ismayilova, Oczak, Sonoda, Fels, Guarino, Vranken, Hartung, Bahr and Berckmans2014) or to mark individuals with artificial symbols (Kashiha et al., Reference Kashiha, Bahr, Ott, Moons, Niewold, Ödberg and Berckmans2013b). However, neither of these methods meets the requirements of commercial farms for individual selection of animals. Methods currently being investigated as alternatives to manual labelling include the 5D Gaussian model (Ahrendt et al., Reference Ahrendt, Gregersen and Karstoft2011) and the Gabor texture feature method (Huang et al., Reference Huang, Zhu, Ma, Guo and Chen2018).
Extraction of animal foreground
A second step is to be able to detect the animals from other objects in the environment, also referred to extraction of animal foreground or image segmentation. After such a procedure, the image should only include the animals and the rest as a unified background colour. Some methods can extract animal foreground with high accuracy but cannot separate animals that are close together (target adhesion) and, thus, make it difficult to subsequently locate the feature points on each animal body (e.g. the mixed Gauss model method (Guo et al., Reference Guo, Zhu, Jiao and Chen2014)). Other methods can separate animals that are close together, but cannot be used for accurate extraction of animal foreground as the contour of the animal is either rough and incomplete or of a specific shape (e.g. the Otsu-based background subtraction proposed by Nasirahmadi et al. (Reference Nasirahmadi, Richter, Hensel, Edwards and Sturm2015) and the method of merging fitted ellipses proposed by Lu et al. (Reference Lu, Xiong, Li, Liu, Yan, Ding, Lin, Yang and Shen2016)). Thus, more work is required on this challenge.
Extraction of behavioural features in the data
A third step is to decide on the behavioural features that should be extracted to recognise the behaviour in question and to develop techniques to extract these chosen behavioural features. This is a part of the image analysis process that needs considerable consideration. In the case of pig aggression, features of mean intensity and occupation index (Viazzi et al., Reference Viazzi, Ismayilova, Oczak, Sonoda, Fels, Guarino, Vranken, Hartung, Bahr and Berckmans2014; Oczak et al., Reference Oczak, Viazzi, Ismayilova, Sonoda, Roulston, Fels, Bahr, Hartung, Guarino, Berckmans and Vranken2014) were found to be useful in the past. Later, the acceleration feature (Chen et al., Reference Chen, Zhu, Ma, Guo, Huang and Ruan2017) and motion features with higher discrimination (e.g. kinetic energy (Zhao et al., Reference Zhao, Gu, Shi, Lu, Li, Shen, Ye and Zhu2016), displacement, etc.) have been applied with success and can be further developed and combined with the position features of aggressive pigs (e.g. distance between head and head, distance between head and body and distance between head and tail). In the process of behavioural feature extraction, the difficulty lies in the location of individual feature points on the animal body including, for example, the location of the animals head and tail (Kashiha et al., Reference Kashiha, Bahr, Haredasht Amirpour, Ott, Moons, Niewold, Odberg and Berckmans2013a). Without going into further detail, existing methods for locating feature points include the point distribution model (Cangar et al., Reference Cangar, Leroy, Guarino, Vranken, Fallon, Lenehan, Mee and Berckmans2008) and the kink points method (proposed by Frost et al., Reference Frost, French, Tillett, Pridmore and Welch2004). By analysing the motion of these feature points between adjacent image frames, more accurate motion features and position features can be extracted.
Recognition of important behavioural interactions
A fourth and final step is to classify the image frames into the important behavioural interactions in question (such as aggressive behavioural markers among pigs) based on the values of the extracted behavioural features. Methods for such classifications include linear discriminant analysis (Viazzi et al., Reference Viazzi, Ismayilova, Oczak, Sonoda, Fels, Guarino, Vranken, Hartung, Bahr and Berckmans2014), neural networks (Oczak et al., Reference Oczak, Viazzi, Ismayilova, Sonoda, Roulston, Fels, Bahr, Hartung, Guarino, Berckmans and Vranken2014) and hierarchical clustering (Chen et al., Reference Chen, Zhu, Ma, Guo, Huang and Ruan2017), among others. The threshold of each behavioural feature can then be used in the recognition rules of, for example, aggressive behaviours. As an example, when two pigs in a frame simultaneously meet at a certain acceleration (motion feature) and with a certain distance (position feature), it can be considered as a frame with head-to-head knocking. When the ratio of such frames in a period of time exceeds a fixed value, also referred to as the minimum recognition unit (Chen et al., Reference Chen, Zhu, Ma, Guo, Huang and Ruan2017), it is considered that an event of head-to-head knocking occurred and, thus, that an aggressive interaction among the pigs in the group occurred. Further work is required to develop better rules (thresholds) to recognise each aggressive behaviour in frames of videos and to choose the accuracy, sensitivity and specificity being suitable for evaluation of the recognition results (Oczak et al., Reference Oczak, Viazzi, Ismayilova, Sonoda, Roulston, Fels, Bahr, Hartung, Guarino, Berckmans and Vranken2014).
To summarise, image analysis do show great potential as a method to recognise specific behavioural patterns, both for the individual animal and for interactions between animals. However, challenges still exist within each step of the image analysis process that needs to be investigated further.
Sound analysis
Sound analysis is a second method for automatic continuous recording of animal variables that is non-invasive to the animal, as the microphones measuring the sound can be mounted within the animal house without causing additional stress to the animal. Within the PLF research field and sound analysis, quite a lot of attention has been given to measuring animal vocalisation. In the following, examples of PLF research within pig and chicken vocalisations will be presented.
Pig vocalisations
Various studies comprise automatic detection of pig coughs, a good indicator for respiratory problems in pigs. This automatic cough detection is not new. In 1999, Van Hirtum et al. published on selecting coughs (Van Hirtum et al., Reference van Hirtum, Aerts, Berckmans, Moreaux and Gustin1999). In the years following, the detection algorithm was further improved (Van Hirtum and Berckmans, Reference van Hirtum and Berckmans2003) and a recent study of Berckmans et al. (Reference Berckmans, Hemeryck, Berckmans, Vranken and van Waterschoot2015) showed that a detection tool could give warnings up to 2 weeks earlier, compared to a situation where the pigs were observed by the farmer and the veterinarian. In addition to the cough detection, Van Hirtum and Berckmans (Reference van Hirtum and Berckmans2002), Exadaktylos et al. (Reference Exadaktylos, Silva, Aerts, Taylor and Berckmans2008) and Ferrari et al. (Reference Ferrari, Silva, Guarino, Aerts and Berckmans2008) showed that it is possible to decipher between cough from healthy and sick pigs. Van Hirtum and Berckmans (Reference van Hirtum and Berckmans2003) investigated the possibility to use cough sound as a biomarker for three types of aerial pollution (irritating gas, dust and temperature). Thorough analysis of pig vocalisations including duration and amplitude of the vocalisation signal can also be used as a sign of distress in the pig (Cordeiro et al., Reference Cordeiro, Nääs, da Silva Leitão, de Almeida and de Moura2018). Further classification of the pig vocalisations into vocal types including pig screams also showed to contain valuable information in identifying painful and distressful situations such as castration and ear biting (Von Borell et al., Reference Von Borell, Bünger, Schmidt and Horn2009; Diana et al., Reference Diana, Carpentier, Piette, Boyle, Berckmans and Norton2019), whereas pig barks may contain valuable information in identifying play behaviour or as alarm signals (Newberry et al., Reference Newberry, Wood-Gush and Hall1988; Chan et al., Reference Chan, Cloutier and Newberry2011). Recent research show a potential to differentiate pig vocalisation not only into coughs but also into screams, grunts and squeals based on several sound signal features (Vandermeulen et al., Reference Vandermeulen, Bahr, Tullo, Fontana, Ott, Kashiha, Guarino, Moons, Tuyttens, Niewold and Berckmans2015; Diana et al., Reference Diana, Carpentier, Piette, Boyle, Berckmans and Norton2019).
Chicken vocalisations
Over the last years, there has been an increasing interest in the analyses of chicken vocalisations, as this seems to contain a lot of information about these animals. Information that can be of great importance to the farmer, if presented in the correct way. The literature on analysis of chicken vocalisations shows enormous possibilities of this research. Vocalisations of chickens have been researched in relation to welfare (Zimmerman et al., Reference Zimmerman, Koene and van Hooff2000), social separation (Feltenstein et al., Reference Feltenstein, Ford, Freeman and Sufka2002), thermal comfort (Moura et al., Reference Moura, Nääs, Alves, Carvalho, Vale and Lima2008), feather pecking (Bright, Reference Bright2008), diseases (Carpentier et al., Reference Carpentier, Vranken, Berckmans, Paeshuyse and Norton2019) and growth (Fontana et al., Reference Fontana, Tullo, Butterworth and Guarino2015). However, the potential in the use of microphones is not limited to automatic recording of vocalisations but can, for example, also be used to measure feed uptake by broilers using the pecking sound (Aydin et al., Reference Aydin, Bahr, Viazzi, Exadaktylos, Buyse and Berckmans2014). The unique feature in the latter case is that a sound detection system was defined based on a sound sensor attached to the feeder pan. In this way, it was possible to perform and analyse sound measurements in real time in a fully non-invasive, but still automated, manner during the full growth process of this group of animals.
Applications to localise and monitor the health and well-being of livestock animals are feasible with sound analysis. For each application, the main effort is to develop an algorithm for automatic detection of sound events and then associate these specific sound events to health, distress and abnormal behaviour. As with image analysis, the workflow of such an algorithm within sound analysis takes several steps, as illustrated in Figure 3 and described in the following. These steps include sound recording, pre-processing, event selection, feature extraction and event classification.
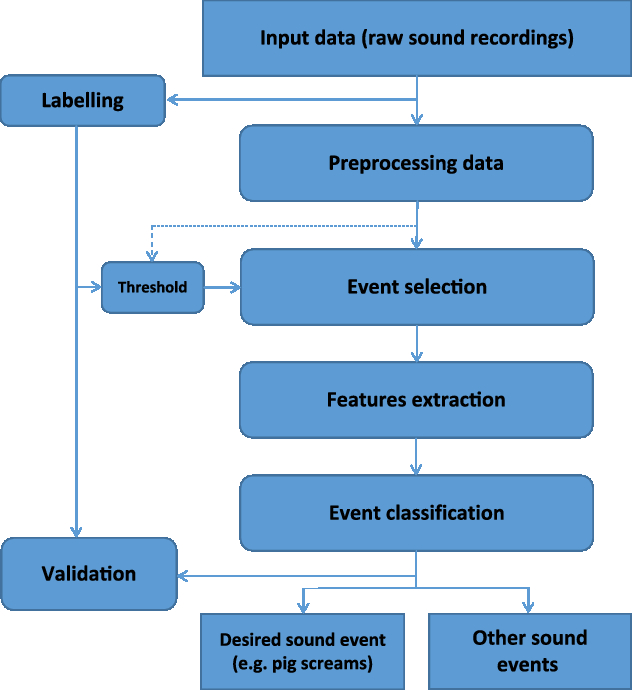
Figure 3 Overall approach for the development of a sound analysis-based precision livestock farming tool for livestock animals.
Sound recording and pre-processing
The first step in sound analysis is the acquisition of the raw sound data (i.e. the input data). Sound is recorded and saved in blocks of a certain time, which can easily be adapted. For recording the sounds, the sampling frequency can also be adapted and the most optimal position for mounting the microphone should be explored. This includes the height of the microphone and the relative position from the walls and disruptive sound sources (e.g. ventilation). The sound data also need pre-processing, which is a specialised sound analysis procedure to separate the clear sound sources, also called foreground noises (e.g. knocking sounds, animal vocalisations), from specific interfering noises, also called background noises (fan noise, heaters). The goal is to clean up the sound data before moving on to event selection and feature extraction. For this pre-processing, many different approaches are possible from simple solutions like bandpass filtering to more sophisticated solutions like the ones used in speech processing. In the case of animal vocalisations, a more sophisticated solution is needed as this gives a better filtering where the background is removed as much as possible. Good filtering will make it possible to select and classify sound events with the targeted accuracy and precision and it will facilitate the next steps in the process.
Event selection and feature extraction
The third step in the algorithm workflow is to select events from the pre-processed sound data. An event is a time frame in the audio signal with a certain meaning (e.g. knocking, pecking and animal vocalisations). In this step, an automatic annotation of all relevant acoustic events is made and the events are identified with an onset and offset time. The algorithm will need a threshold or multiple thresholds to decide when an event will start or end. These thresholds are based on the labelling process that occurred during the development of the algorithm and the output of the event selection for a given threshold (i.e. how great a proportion of events were selected). The fourth step is to extract feature values from the selected events to calculate specific audio characteristics of the events including energy (total energy of the event, relation of the energy in different bands in the event), frequency information (peak frequency, mean frequency), spectral centroid, bandwidth, envelop of the event and zero-crossing rate. The main objective is to identify features with physical meaning (e.g. the mean frequency of different vocalisations).
Event classification
The final step in the algorithm workflow is the classification of the sound events. Based on the values of the different features, the events are assigned to different classes (e.g. pig vocalisations into screams and coughs). By assigning a threshold to different features, cut-offs can be made between classes. Decision on the thresholds can be done manually based on the physical meaning of a feature (e.g. a pig cough could never be shorter than 0.1 s or longer than 1.5 s). Another approach is using automatic classification tools like hidden Markov models, Gaussian maximum likelihood estimators and neural networks among others. However, using these automatic tools makes the algorithm prone to overfitting, making it difficult or impossible to see precisely how the classification was done in retrospect. It is worth noting that these algorithms require an excellent feature database for efficient and effective classification such as databases from other audio processing disciplines (e.g. the MPEG-7 database for music processing).
To summarise, the vocalisations of livestock animals including pigs and chickens seem related to several animal health and welfare parameters. Further, sound analysis show great potential as a method to automatically recognise these specific vocalisations of livestock animals as well as to be used for other relevant applications within the livestock production.
Applications of monitoring technologies in the production process
The purpose of developing PLF applications is to monitor the health and welfare of the individual animal (and when not possible, a group of animals) in a continuous, dynamic and real-time manner on-farm to facilitate the farmer in caring for the animals. In the subsequent section, two examples of such applications from the pig and broiler production will be presented to understand the value of PLF implementation. Both application examples highlight the possibility to separate welfare monitoring from retrospective production results, so that animal health and welfare can be managed effectively in the present time.
Water usage in the pig production
During the growing process of animals, behaviours such as drinking and feeding are indicative of their health and well-being. In the production of pigs, drinking behaviour has been considered by many authors as a way to judge the health and welfare of the pigs. Pigs generally have stable diurnal drinking pattern unless influenced by stressors from disease or the environment (Madsen and Kristensen, Reference Madsen and Kristensen2005; Andersen et al., Reference Andersen, Dybkjær and Herskin2014). Andersen et al. (Reference Andersen, Dybkjær and Herskin2014) found that tracking the dynamic characteristics of drinking behaviour within a day is important as part of health and welfare monitoring. The study by Madsen et al. (Reference Madsen, Andersen and Kristensen2005) was the first one to consider the dynamic modelling of water drinking patterns and demonstrated its power in detecting disease outbreaks (Madsen and Kristensen, Reference Madsen and Kristensen2005). One way to measure water intake is to utilise water meters, and multiple studies have found predictive information in this measure when considering unwanted events within the pig production including tail biting, pen fouling and diarrhoea (Jensen et al., Reference Jensen, Toft and Kristensen2017; Dominiak et al., Reference Dominiak, Hindsborg, Perdersen and Kristensen2019; Larsen et al., Reference Larsen, Pedersen and Jensen2019). Other approaches focus less on the precise water consumption of the animals and instead focus more on the frequency and duration of the visits to the drinker. For example, Kashiha et al. (Reference Kashiha, Bahr, Haredasht Amirpour, Ott, Moons, Niewold, Odberg and Berckmans2013a) researched the use of camera-based monitoring of drinking behaviour in pigs. The aim of the experiment was to determine whether half-hourly water volume usage (in litres) in a pig barn could be estimated by analysing the drink nipple visits. Image analysis enabled the dynamics of water visits to be linked with meter measurements over the 13 days of the experiment. However, using water meters and cameras as above do not provide data at the individual animal level. This was enabled using high-frequency radio-frequency identification (RFID) systems that Maselyne et al. (Reference Maselyne, Adriaens, Huybrechts and De Ketelaere2016) successfully implemented by comparing RFID-based visits with visual observations and flow meter measurements. All in all, the three techniques presented above provide the possibility to evaluate the time varying drinking behaviour of pigs; and given the potential RFID and camera systems, it is becoming more feasible for farmers to monitor individual water intake patterns.
Flock behaviour in broiler production
Although not at the individual animal level, the behaviour of a broiler flock has recently been correlated to specific welfare problems in the broiler production. Fernández et al. (Reference Fernández, Norton, Tullo, van Hertem, Youssef, Exadaktylos, Vranken, Guarino and Berckmans2018) used the commercially available PLF camera system to extract values on the activity and occupation patterns of a broiler flock. They found a positive relation between the deviations in occupation patterns and the footpad lesion scores indicating that birds, which tend to cluster together for long periods, present an increased chance of having higher levels of footpad lesions. They also found a negative relation between the deviations in the activity pattern and the hock burn scores, indicating that a higher activity of the flock would improve the hock burn scores. This can be related with the fact that having less active broiler chickens staying still for longer periods on badly conditioned litter can worsen this kind of lesion (Haslam et al., Reference Haslam, Knowles, Brown, Wilkins, Kestin, Warriss and Nicol2007). Another camera-based monitoring approach has been developed by Dawkins et al. (Reference Dawkins, Russell, Merelie and Roberts2013). The approach is based on an analysis approach called optical flow. This approach derives the general movement flow patterns of birds from the images, as well as the variance, skew and kurtosis of the flow and have been correlated with health and welfare indicators (Dawkins et al., Reference Dawkins, Russell, Merelie and Roberts2013).
The future potential of precision livestock farming in livestock production
Welfare management is the key challenge today and often relates to both the health and production of the animals. It is not enough for the farmer to be told after the animals have left the herd that the system is not at a suitable welfare level. After this point, the farmer cannot take appropriate action. With PLF, real-time on-farm welfare monitoring and management becomes feasible, and many opportunities exist beside the examples already mentioned. Continuous monitoring of key variables on the farm will make real-time welfare management possible. As the PLF research community grows, we still have to do more work to realise the practical benefits of PLF technologies in the commercial production. Only with accurate systems can we start to convince farmers of the capacities of such technology to link productivity, health and welfare management. Examples from the pig and poultry productions have been used in the current literature review. However, the PLF field of research is most certainly not limited to these two livestock species but is also well established within, for example, the dairy and beef cattle productions. In the following, the opportunities with PLF in an often forgotten livestock production form, aquaculture, will be discussed.
Opportunities in other sectors: aquaculture as an example
Aquaculture is traditionally considered a low-technology sector (Føre et al., Reference Føre, Frank, Norton, Svendsen, Alfredsen, Dempster, Eguiraun, Watson, Stahl, Sunde, Schellewald, Skøien, Alver and Berckmans2018). Almost all biological responses of fish are expressed underwater. Given the industry’s drive toward larger production cages, there is now an even greater need for technologies that enable farmers to maintain a high level of control over the production processes in fish cages. Fish farmers have found it hard to understand the behavioural repertoire of fish and thereby obtain direct relationship with their animals. In this context, there is a clear need for quantifying fish behaviour and translating this information into a reliable welfare assessment system. Much of the previous research has focused on a qualitative description of behaviour, whereas recent technologies coupled to state-of-the-art computer vision and machine learning techniques open the door to a data-based description of fish behaviour. This approach will allow for a more careful inspection of a species’ whole behavioural repertoire, possibly highlighting patterns of behaviour that were previously overlooked by human observers. Previous research efforts aimed at aquaculture have focused on the development and use of technologies for monitoring and estimating animal variables in tanks and cages (e.g. Alfredsen et al., Reference Alfredsen, Holand, Solvang-Garten and Uglem2008; Føre et al., Reference Føre, Alfredsen and Gronningsater2011). Other research has tried to link the biological responses of farmed fish with the underlying mechanisms as a function of external factors such as feeding and management (e.g. Oppedal et al., Reference Oppedal, Dempster and Stien2011). While such studies represent essential building blocks for the development of new technology-based methods for intensive aquaculture, the tools for drawing a foundation for decision support by combining monitoring technologies with knowledge on the biological characteristics of fish population has been non-existent (Føre et al., Reference Føre, Frank, Norton, Svendsen, Alfredsen, Dempster, Eguiraun, Watson, Stahl, Sunde, Schellewald, Skøien, Alver and Berckmans2018). Hence, an adaptation of the methodology therein to fish farming will build a bridge between technological and biological research results and efforts.
Conclusion
Precision livestock farming can provide the key to a sustainable livestock production in the future. In this review, we have identified some of the key principles of PLF and key ideas behind the development of PLF sound and image tools as an non-invasive method of measuring animal variables. A key point is that the development and operation of PLF applications involve several steps and techniques that need to be investigated further to make the developed systems accurate and implementable in commercial environments. By adopting such tools the PLF field will progress and the farmer will also embrace the value of the technology. Therefore, we must strengthen collaboration between key stakeholders as well as ensure that scientific rigour is enforced through the development and validation of these systems.
Declaration of interest
The authors declare no conflict of interest.
Ethics statement
Not applicable.
Software and data repository resources
Not applicable, as no data were used and no models were created in the conduction of this literature study.


