


South Africa, like many other low- and middle-income countries (LMIC), is undergoing a nutrition transition which is characterised by dietary intakes that are low in fruits and vegetables (F&V) high in salt, fats, added sugars and highly processed food(Reference Abrahams, Mchiza and Steyn1,Reference Nnyepi, Gwisai and Lekgoa2) . This transition has also been linked to urbanisation, obesity and diet-related non-communicable diseases (NCD) such as diabetes, cancer and heart diseases(Reference Abrahams, Mchiza and Steyn1–Reference Steyn, Nel and Parker3). Furthermore, while more than 45 % of the population in South Africa are either overweight or obese, and 39 % of deaths in South Africa are linked to these NCD(Reference Spires, Delobelle and Sanders4,Reference Nojilana, Bradshaw and Pillay-van Wyk5) , over half of all households experience or are at risk of hunger(Reference Shisana, Rehle and Simbayi6). Additionally, there is substantial evidence concerning the obesity-food insecurity paradox in LMIC and “at risk” populations, where food insecurity is typically associated with poor dietary quality and diversity(Reference Farrell, Thow and Abimbola7).
The expansion of the retail food environment in LMIC, especially “big box” stores and supermarkets, coincides with this nutrition transition(Reference Kimenju, Rischke and Klasen8,Reference Taillie, Ng and Popkin9) . The retail food environment has been highlighted as significant in the determining and shaping of dietary behaviours(Reference Vandevijvere, Waterlander and Molloy10). In South Africa, supermarkets have become a primary source for food shopping, accounting for more than 50 % of food sales(Reference Charman, Petersen and Piper11,12) . Consequently, the purchase pattern from supermarkets should represent to a large extent the dietary pattern of shoppers in South Africa. In 2014, a South African study postulated that supermarkets promote unhealthy food purchase(Reference Battersby and Crush13). Battersby and Crush also reported that supermarkets in low-socio-economic areas (SEA) in South Africa have fewer varieties of food, and lower quality foods, than those in higher income areas(Reference Battersby and Crush13). In addition, a recent study from Kenya reported that supermarkets are a significant factor contributing to the increase in diet-related NCD(Reference Demmler, Ecker and Qaim14). Conversely, a study from Tunisia reported a positive association between supermarket purchases and diet quality(Reference Tessier, Traissac and Maire15).
There is also evidence that shelf space allocation of food products in supermarkets plays a role in shaping food purchase patterns of consumers(Reference Demmler, Ecker and Qaim14,Reference Bleich16) . Frequently, it is the “unhealthy” foods that are strategically placed and allocated more shelf space than healthier counterparts(Reference Bleich16). There is indication that these retail marketing strategies have health implications, with a study linking the cumulative shelf space allocated to unhealthy foods such as energy-dense snacks with increased BMI(Reference Rose, Hutchinson and Bodor17).
These studies indicate that dietary intake behaviour may be shaped by factors such as socio-economic drivers, urbanisation, retail food environment, food access and quality which may vary in different regions(Reference Rose, Hutchinson and Bodor17,Reference Afshin, Forouzanfar and Reitsma18) . However, there is limited information from LMIC. Furthermore, studies conducted in South Africa have shown that some people shop outside their residential areas (out-shoppers), and that they have unique characteristics compared with people that shop within their residential area (in-shoppers). For example, out-shoppers are more likely to be employed, have better means of transportation and to perceive the quality of products in their residential area to be poor(Reference Strydom19–Reference Odunitan-Wayas, Okop and Dover22). These findings are similar to studies in developed countries(Reference Qiu, Maksymiuk and Bruning23,Reference Powe and Hart24) . However, there is also limited information on the food expenditure of this unique group of shoppers.
Most studies in developing countries that have assessed the association between food purchasing and expenditure, and dietary behaviour, have relied on self-report, which may be prone to inaccuracy, bias and contradictory outcomes(Reference Baxter, Smith and Litaker25). However, the use of supermarket audits and grocery receipts to collect data on food quality, access to food, purchase patterns and expenditure in supermarkets are methods used for characterising dietary patterns that have been successfully explored in developed countries(Reference French, Wall and Mitchell26,Reference Cullen, Baranowski and Watson27) .
In a previous article(Reference Odunitan-Wayas, Okop and Dover22), we shared the results of the self-reported purchasing behaviours and perceptions of the food environment of South African high-, middle- and low-income shoppers based on intercept surveys. The current study combines information from intercept surveys against new data from grocery receipts collected from the supermarket shoppers, as well as food price and quality audits of supermarkets located in different SEA. The objective of this study was to identify factors associated with food purchasing decisions and expenditure of supermarket shoppers residing in low, middle and high SEA and their access to healthy and quality food items in Cape Town, South Africa.
Materials and methods
This cross-sectional study is part of a larger study, STOP SA (Slow, Stop or Stem the Tide of Obesity in the People of South Africa), aimed at addressing the challenges of obesity in conjunction with food insecurity. Data for this study were collected between March and May 2017. Full details of the methods are provided in an earlier work(Reference Odunitan-Wayas, Okop and Dover22).
Socio-economic profile of Cape Town
We categorised the residential areas of shoppers into different SEA according to average household income based on the Cape Town socio-economic profile, Statistic South Africa (STATSA) 2019 and ZAR3500//≈US$153 monthly minimum wage(28,29) . In the current study, the low SEA that were selected were Langa and Khayelitsha. Both areas are townships located in the Cape Flats, which is one of the poorest parts of Cape Town. Langa has an average monthly household income of ZAR2144/≈US$153(Reference Okop, Levitt and Puoane30) and Khayelitsha an average monthly household income of ZAR1600/≈US$114(Reference Smit, de Lannoy and Dover31). The middle SEA selected were Athlone and Mowbray both having an average monthly household income of ZAR5217/≈US$373(Reference Mthembu, Beets and Davids32). The high SEA included Parklands, one of the fastest growing new residential areas and Claremont, an old residential area. Both high SEA have an average monthly income of ZAR12 000/≈US$857(33).
Supermarket sample
Supermarkets in this study are major recognised retail store chains in South Africa that offer a broad selection of foods and household products(Reference Odunitan-Wayas, Okop and Dover22,Reference Weatherspoon and Reardon34) . Major supermarkets in the purposively selected study areas were approached to obtain permission to conduct the study within their premises. We approached the managers of five different supermarkets located in high SEA, but only got permission from two managers, as they did not wish their customers to be disturbed. There was only one refusal from a manager of a selected supermarket located in the middle SEA and none from the managers of the selected supermarkets located in the low SEA. Consent was obtained from eleven supermarket managers (four supermarkets in the low SEA, five in the middle SEA and two in the high SEA) representing approximately 20 % of the total supermarkets in the study areas.
Intercept surveys and grocery receipt data collection
Intercept surveys were conducted with eligible shoppers, who were ≥18 years old and who purchased ten or more different food items, as confirmed by their grocery receipts. The intercept surveys were conducted on the premises of the supermarkets after the shoppers completed their shopping and having obtained informed consent. Trained fieldworkers administered the structured questionnaire, which had been piloted in two supermarkets using similar methods described in the current study, in either one or a combination of the three major languages in Cape Town: English, Xhosa and Afrikaans, depending on the preference of the shoppers, and lasted between 20 and 25 min. These were conducted from 10:00 to 17:00 h on weekdays and 10:00 to 14:00 h on Saturdays in the beginning, middle and end of the month to capture various categories of shoppers and types of shopping trips. After the interviews, the grocery receipts of the shoppers were photographed, identically coded as the shoppers’ questionnaires and archived for further analysis. Participants were given a shopping voucher (ZAR50/≈US$4), as compensation for their time after completing the intercept surveys.
Questions in the intercept survey relevant to this current article included as follows.
Shopping characteristics
Questions covered shopping behaviours and patterns including shopping frequency, persons for whom they shop, persons responsible for shopping, major shopping destination/s and availability of F&V and snacks in the supermarkets.
Out-shoppers and in- shoppers
In the present study, we also looked at a sub-population based on the SEA in which they shopped compared with the socio-economic status of the area in which they resided. This sub-population was classified into two groups: out-shoppers and in-shoppers. Out-shoppers refers to persons shopping outside their residential SEA and in-shoppers refers to persons living and shopping in the same SEA.
Demographic characteristics
Characteristics included gender, age in years, residential location and three indicators of an individual’s socio-economic position, specifically educational attainment, employment status and socio-economic status of residential area.
Food security assessment
Three key food security questions were adapted from the US Household Food-Security/Hunger Survey Module: 3-Stage Design(Reference Bickel, Nord and Price35).
Food purchase and expenditure measures
Two experienced registered dietitians coded the grocery receipts of the shoppers. Purchases were allocated into different food categories (Table 1). Food items such as soup packets, chewing gum, baby food and food items that did not have an adequate identifiable name/description and ready-to-eat meals comprising of various food categories on the grocery receipts were identified as uncategorised items. Each food category purchased by shoppers was coded in a binary manner, 1 = food category that was purchased, 0 = food category that was not purchased. Expenditure on each food category was calculated as percentage (share expenditure) of the total grocery expenditure (food and non-food items) for each participant.
Table 1 Food categories and definitions

Audits of food quality and shelf space measurements
The lowest food prices and quality audit of targeted food items in each supermarket were assessed by trained fieldworkers in pairs, as well as the shelf space allocation for specific food categories defined in Table 1.
Audit of food price and quality
Quality audits were conducted at all the supermarkets during the same season and during the week to maximise comparability. In addition, the food price audits commenced within the same period the intercept surveys were being conducted and were completed within a fortnight after the last intercept survey was conducted. The lowest prices of the food items were compared between the supermarkets located in the different SEA, similar to the study by Ghosh-Dastidar et al. (Reference Ghosh-Dastidar, Cohen and Hunter36). As the lowest food prices of food items in different SEA supermarkets were comparable (after applying the Bonferroni correction because of the small sample size and multiple comparisons), the data are not presented here, but are available in online supplementary material, Supplemental Table 1.
Quality of foods was classified into categories. F&V were classified as “Excellent” if they were fresh, firm, clean and had good colour, “Satisfactory” if relatively fresh looking with minor defects and “Poor” if bruised, old looking, overripe, showing signs of shrivelling or excessive softening. Dairy products were classified as “Excellent” if they were within sell by/best before date with no odour and “Poor” if they had noticeable odour and were after the best before/sell by date. Bread and fresh baked products were classified as “Excellent” if they were soft, fresh and within the sell by/best before date, “Satisfactory” if they were reasonably soft and before the sell by/best before date and “Poor” if they are hard, not fresh and past sell by/best before date. Protein foods (meat, eggs, beans and fish) were classified as “Excellent” if they had good colour, no odour, no freezer burn, no visible blood and were within best before date and poor if noticeable odour, inconsistent colour, some evidence of freezer burn, some visible blood and past the sell by date. If a food item was not available in the supermarket, it was classified as unavailable. For this study, the quality of fresh F&V found in the South African food basket(37) was assessed and used for analyses because of their high perishability and nutritional value. The variables were coded as excellent = 1; satisfactory = 2; poor = 3 and not available = 4 for analysis.
Shelf space measurement
Using measuring wheels that were either rolled along the shelves or the floor, pairs of trained fieldworkers measured the supermarket size and shelf space allocation. Shelf spaces were measured for food types that were specified in Table 1. The shelf space (in linear metres) of each food category in the aisle was measured. Measurements did not include height, depth or number of shelves. Measurement of freestanding bins (that were not round) was performed by measuring the accessible sides from which customers could select products. For round freestanding food bins, the diameter was measured, and circumference calculated using 2πr. When a food type to be measured was located in several places in the supermarket, all the measurements were summed to produce a total shelf length. These methods of measurement are consistent with previous studies(Reference Vandevijvere, Waterlander and Molloy10,Reference Farley, Rice and Bodor38) . In the current study, the ratio of the shelf space measurement of “total healthy foods” (fresh and frozen F&V v. “total unhealthy” (sugar-sweetened beverage (SSB) and snacks) was assessed using the same indicators that were validated in previous studies(Reference Vandevijvere, Waterlander and Molloy10,Reference Vandevijvere, Mackenzie and Mhurchu39) .
Data analysis
Data were analysed using IBM SPSS for Windows, version 25 (IBM Corporation). Means and sd were calculated for the continuous variables and χ 2 tests were computed for categorical variables and presented as n (%). Distributions for continuous variables were tested using Shapiro–Wilk tests for normality, which showed that most variables were not normally distributed within our sample. However, the statistical analyses used have been shown to be robust even when the requirements of normally distributed data are not met(Reference Blanca, Alarcón and Arnau40). ANCOVA was used to compare the mean differences among the food categories varying by residential SEA. Covariates included were age, shopping pattern, food security and mode of travel to shop. Gender and the number of persons in the household that will be fed with the purchases being made on the day of the intercept survey were not significant covariates. As employment and education are closely interrelated as indicators of socio-economic status with residential SEA, they were not included as covariates. Pairwise comparisons were made with the least significant difference (P < 0·05).
One-way ANOVA was used to compare the unadjusted mean differences of the food categories (share expenditure) varying by food security status and out-shopping/in-shopping. Results are available in online supplementary material, Supplemental Table 2. Descriptive statistics (median, ratio and range) were used to assess the healthiness of in-store food environments using aforementioned indicators.
Results
Demographic and shopping characteristics
Of the total of 635 shoppers approached in all three SEA settings, 425 agreed to be interviewed. The main reasons given for refusal were lack of time and lack of interest. More than 60 % of non-respondents were from high-SEA supermarkets. Of the 425 respondents who agreed to be interviewed, only 395 respondents were included in the final analysis, due to either inadequate or unintelligible information on grocery receipts. The participants’ demographics and shopping patterns (n 395) are presented in Table 2. Most of the participants (82·4 %) were women and more than half (n 245, 62·1 %) were between the ages of 30 and 55 years. There were significant differences in age distribution, education level and employment between the three SEA groups. More than 50 % of the participants from the low-residential SEA had only a primary school education compared with more than 50 % of participants from the high-residential SEA who had a tertiary education. There was a high prevalence of unemployment of the participants from low-residential SEA compared with shoppers from high-residential SEA (41·4 % v. 21·7 %). The food security status of the shoppers residing in the different SEA was comparable, with more than 50 % of each SEA category food insecure.
Table 2 Demographic and shopping characteristics by shopper’s socio-economic area (SEA)
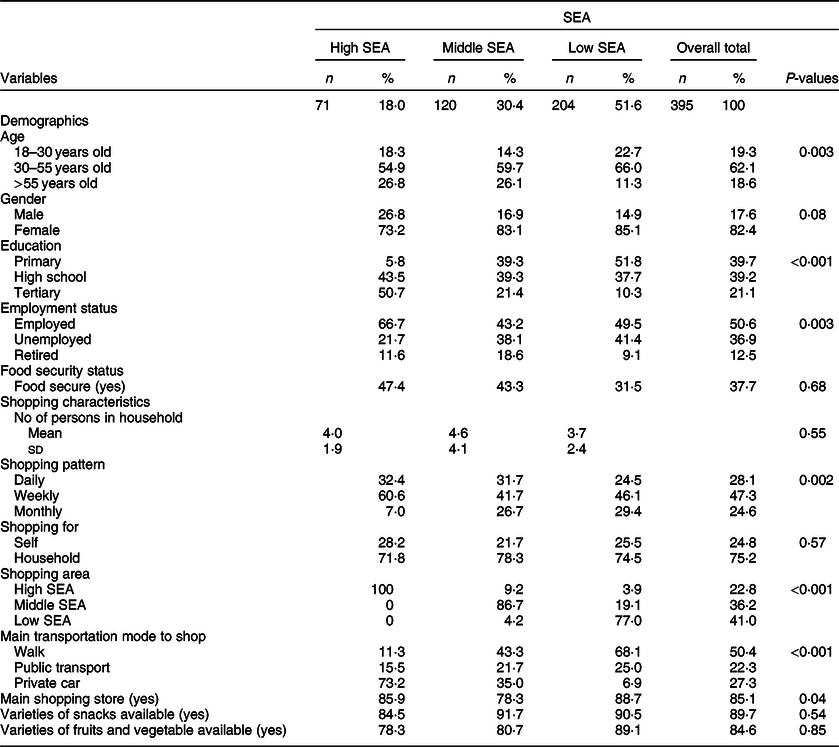
P-values determined through χ 2 and ANOVA.
For 85·1 % of shoppers, the supermarket in which they were interviewed was the one in which they mainly shopped. Many of the respondents regardless of their residential SEA were weekly shoppers (47·3 %, P = 0·002) compared with daily (28·1 %) or monthly (24·6 %). Most of the shoppers residing in high SEA (73·2 %) drove their private cars to shop. Conversely, many shoppers residing in low SEA (68·1 %) walked to their shopping destination and one-quarter use the public transportation. There were no differences between the supermarkets in the different SEA for varieties of snacks or fruits available. More than 75 % of shoppers interviewed were shopping primarily for their household rather than for only themselves. The number of persons per shopper’s household being shopped for from all the residential SEA was comparable. Most of the respondents shopped within their neighbourhoods (P < 0·001) and none of residents from the high-residential SEA were “out-shoppers” in contrast to 13·4 % from the middle-SEA and 24·0 % from the low-SEA groups (Table 2). Consequently, from this point for comparison purposes, in-shoppers and out-shoppers include only shoppers residing in low and middle SEA (n 324).
Purchases and expenditure of shoppers from different socio-economic areas
Figure 1 shows the proportion of 395 shoppers from different residential SEA that purchased specific food categories. Significantly, more high-SEA resident shoppers purchased fruits, vegetables, eggs, dairy and bread compared with the other shoppers. Approximately two-thirds of shoppers from high-residential SEA purchased vegetables compared with less than half of the shoppers from low- and middle-residential SEA. More shoppers from middle-residential SEA (80 %) purchased snacks compared with low- (57·8 %) and high-SEA resident (74·6 %) shoppers. Less than a third of the shoppers from all the residential SEA purchased dry legumes; however, the percentage of shoppers from low-residential SEA that purchased legumes was significantly higher (P = 0·02). The percentages of shoppers who bought meat, fish, cooking oil, grains and potatoes and SSB were not significantly different between all residential SEA groups. The frequency of the purchase of fish by all the shoppers was notably low relative to purchases of other protein-rich foods such as meat, eggs and dairy.

Fig. 1 Percentages of shoppers from low-, middle- and high-SEA neighbourhoods that purchased food from various categories, respectively
Table 3 depicts the average grocery and food expenditure (ZAR) and percentage expenditure on the different categories by shoppers from different residential SEA. Shoppers from high-residential SEA had the highest grocery and food expenditure (P < 0·001) in the supermarkets and spent a higher proportion of their expenditure on fruits (P < 0·001), vegetables (P < 0·03) and alcohol (P < 0·05) when compared with shoppers from the middle- and low-residential SEA. High-SEA resident shoppers spent a higher proportion of their expenditure on vegetables compared with those from middle SEA but have a comparable expenditure with low-SEA resident shoppers. Shoppers from low-residential SEA spent more on grains and potatoes (P < 0·001) and dry legumes (P < 0·05) when compared with shoppers from middle- and high-residential SEA. Middle-residential SEA shoppers spent more on snacks (P < 0·05).
Table 3 Adjusted means for percentage expenditure on food categories of shoppers residing in different socio-economic area (SEA)

SSB, sugar-sweetened beverages.
Values of adjusted means in the same row with different superscript (a, b) are significantly different (P < 0·05).
Adjusted for age, shopping pattern, food security status and transport mode to shop.
Mean and SE determined through ANOVA.
The proportion of total ZAR spent by low-SEA resident shoppers on snacks, grains and potatoes, and SSB was higher than was spent on F&V. Furthermore, the share expenditure by low- and middle-residential SEA shoppers on SSB was about twice what was spent on fruits, and their share expenditure on snacks was more than two-folds what was spent on either fruits or vegetables. High-SEA resident shoppers spent more than three-folds the share expenditure on fruits than low-SEA resident shoppers. Proportional expenditure of shoppers on meat, eggs, processed protein, bread, SSB, oil and cream, spices, tea and coffee and non-food items was comparable across all residential SEA groups.
Expenditure of shoppers categorised by food security status and out-shopping/in-shopping
Expenditures of shoppers (n 395) based on their food security status and whether they were in-shoppers or out-shoppers (n 324) are shown in online supplementary material, Supplemental Table 2. The grocery and food expenditures of food secure shoppers were both significantly higher than for food insecure shoppers (P < 0·05). Despite this, there was no difference between these groups for the percentages spent on the different food categories, except for alcohol, which was higher in the food secure shoppers. Grocery and food expenditure of the shoppers when categorised by out-shopping status was comparable except for fruits and SSB which were lower for in-shoppers compared with out-shoppers.
Quality of fruits and vegetables in supermarkets located in different socio-economic areas
The quality of most of the F&V in the high-SEA supermarkets was of the better quality compared with those found in the middle- and low-SEA supermarkets that mostly varied between good and poor grades (see online supplementary material, Supplemental Fig. 1).
Shelf space of selected food items in supermarkets located in different socio-economic area
Table 4 shows the average cumulative linear shelf length for food groups categorised as total healthy (fresh and frozen F&V), total unhealthy (SSB and snacks), fresh F&V, SSB and all snacks, as well as the ratios between the shelf length allocated for the different types of foods. Supermarkets located in high SEA had a lower ratio of shelf length of total healthy foods to total unhealthy foods compared with the other groups. However, on separating the shelf space into subgroups (fresh F&V, SSB and all snacks), more shelf space in high- and middle-SEA supermarkets was allocated to fresh F&V when compared with SSB in supermarkets located in low SEA. Less shelf space was allocated to fresh F&V compared with snacks in all the SEA supermarkets. However, when the supermarkets were combined (n 11), the ratio of shelf space for total healthy foods v. unhealthy foods and for fresh F&V v. all snacks was lower. The allocated shelf space for fresh F&V and SSB in the combined supermarkets was comparable.
Table 4 Shelf length of healthy and unhealthy foods in high, middle and low socio-economic area (SEA) supermarkets in Cape Town

Min, minimum; Max, maximum; SSB, sugar-sweetened beverages.
Discussion
In this study, we combined intercept surveys, analysis of grocery receipts and in-supermarkets audits to add to our current understanding of food purchasing behaviour in retail supermarkets from high-, middle- and low-socio-economic communities in urban South Africa. We have shown that the shelf space ratio of healthy foods to unhealthy foods in all the supermarkets was low, with supermarkets located in high SEA having the lowest ratio. Consequently, snacks and SSB (unhealthy foods) were ranked as the second most frequently purchased food items by shoppers from the three residential SEA. Fresh F&V were of lower quality and less frequently purchased in supermarkets located in middle and low SEA than in high-SEA supermarkets. As a result, out-shoppers tended to spend more on fruits than in-shoppers as they able to purchase better quality in supermarkets located in higher SEA. This is supported by findings in our earlier study that out-shoppers are better employed and perceived the quality of the F&V in their neighbourhoods to be of low quality(Reference Smit, de Lannoy and Dover31). Furthermore, our current study also shows that out-shoppers are more likely to be employed, mostly use public transport to shop and outshop mostly due to quality and closeness proximity to their place of work (data not shown). Although food secure shoppers spent more overall, the type of food items purchased frequently did not differ from the food insecure shoppers. The high percentage of shoppers from high SEA who were categorised as food insecure is surprising. This could be attributed to the high percentage of women in the study (>80 %) as it has been reported that women in households regardless of their socio-economic status tend to perceive themselves as being food insecure rather than men(Reference Matheson and McIntyre41). Hence, there might be a gender bias in the reporting which needs to be further explored.
Findings in this study such as the higher purchase of F&V by high-SEA resident shoppers compared with other residential SEA shoppers, the frequent purchase of unhealthy foods by all shoppers and the low quality of F&V in supermarkets located in low income areas, consequently resulting in outshopping by lower SEA resident shoppers, are supported by our earlier work on self-reported purchasing behaviours of shoppers in our study area(Reference Smit, de Lannoy and Dover31). Our earlier work adds more in-depth, context and reliability to these comparable outcomes. The current study further brings novel results of food purchasing behaviours of supermarket shoppers from different residential SEA and characteristics of supermarkets located in different income areas.
Our finding that shoppers from high-residential SEA had spent more on food than shoppers residing in low and middle SEA is not surprising as persons of higher socio-economic status are more likely to have disposable income. This is confirmed by various studies conducted in South Africa and other LMIC(Reference Miller, Yusuf and Chow42,Reference Pereira, Cuneo and Twine43) . In addition, poverty and high food prices reduce consumer purchasing power and provide more limited food choices for persons from low and middle SEA, especially for healthy foods(Reference Schönfeldt, Hall and Bester44). Although it has been documented that F&V are also commonly purchased from street vendors located in low and middle SEA(Reference Hill, Mchiza and Fourie45), in our study, the low purchase and expenditure of low and middle resident shoppers on F&V compared with shoppers from high SEA are similar to other studies from South Africa, which have assessed the consumption and/or purchase of F&V irrespective of any specific retail food environment. For instance, in a study conducted in a low income area in Cape Town, more than half of the participants indicated that F&V were often missing in their diet and were not among their top six food items commonly purchased(Reference Methvin46). Another study in South Africa documented that vegetables and fruits were not among the top ten food items commonly consumed(Reference Steyn, Nel and Parker3). We have also shown that the share expenditure on fruits by shoppers from the high-residential SEA was more than three times higher than that of the low SEA (4·6 % v. 1·5 %), although expenditure in vegetables is comparable. Previous studies in South Africa have also reported an almost four times higher purchase in volume and absolute spend of fruits by persons of higher socio-economic status compared with the poor households, while the percentage expenditure on vegetable is more comparable between the SEA groups. This may be because fruits are often perceived as a luxury while vegetables are included as one of the common secondary ingredients in low-income South African meals(37,Reference Kroll47) . The results of our current study might also be attributable to the superior quality of the F&V in supermarkets located in high SEA and the higher prices of F&V compared with staples, snacks and SSBs as shown in other studies on food prices in South Africa(Reference Odunitan-Wayas, Okop and Dover22,Reference Kroll47,Reference Temple and Steyn48) .
It is unclear whether the poorer quality of F&V in supermarkets located in lower SEA is as a result of poor demand, or there is poor demand as a result of poor quality of the F&V. Previous study conducted in low income communities in the USA shown that lower consumption of F&V can be attributed to the poor quality of F&V in the environment(Reference Blitstein, Snider and Evans49). Whereas Thorndike et al. demonstrated a positive association between combination of improvement in the quality and visibility of F&V in food stores and purchase(Reference Thorndike, Bright and Dimond50).
Although shoppers from high-residential SEA spent more on food, shoppers from low-residential SEA possibly spent a higher share of their income on food. An earlier study showed that low income households from developing countries spend between 50 % and 80 % of their income on food, middle income households spend 35–65 % of their income on food and high income households spend about 15 %(Reference De Pee, Brinkman and Webb51). With most of the shoppers in our study being weekly shoppers, we estimated that the average monthly expenditure on food for low-SEA resident shoppers was ZAR1258/≈US$90 (ZAR314.4 × 4) which is approximately 59–79 % of the documented average monthly household income of persons residing in Khayelitsha and Langa. The monthly estimate of food expenditure (ZAR1323/US$95) was about 25 % of their average monthly income while shoppers from high-residential SEA presumably spend about 19 % (ZAR2243/≈US$170) of their income on food monthly (see “Materials and methods”).
Even though the proportion of shoppers from low-residential SEA who bought grains and potatoes was comparable with other shoppers, the share expenditure varied with shoppers from low-residential SEA spending more than middle- and high-SEA resident shoppers. In fact, the highest expenditure on food item by low-SEA resident shoppers was in this food category. Although potatoes and grains are not necessarily unhealthy, our findings suggest that low-SEA resident shoppers might consume mostly a diet of staples due to their high energy density and affordability(Reference Temple and Steyn48,Reference Drewnowski52) and therefore have low dietary diversity(Reference Brinkman, de Pee and Sanogo53). A possibility of low dietary diversity in shoppers from low-residential SEA is evidenced by the significantly lower number of persons from low-residential SEA that purchased fruits, vegetables, egg and dairy. In addition, grains and potatoes are easier to store as they are not highly perishable which is an important factor to consider when there is limited funds and storage facility which is common in low income households(Reference Kroll47).
Although shoppers from high-residential SEA were mostly employed and had a higher educational attainment, which has been associated with higher nutritional knowledge and healthy lifestyle(Reference Cannoosamy, Pugo-Gunsam and Jeewon54,Reference Divine and Lepisto55) , they purchased and spent more on snacks than F&V. Likewise, the share expenditure on fruits, vegetables and SSB was also comparable in the high-SEA resident shoppers. The consumption of SSB and snacks in South Africa has been on a sharp increase in recent times, while there has been a slow progress in the consumption of F&V as between 2009 and 2014, the percentage change in consumption of F&V was 3·1 % and 0·52 %, respectively, in sharp contrast to 7·8 % and 15 % increase in consumption rate of SSB and snacks, respectively(Reference Ronquest-Ross, Vink and Sigge56). Moreover, data from our food audits in the supermarkets indicated that all the supermarkets have more shelf space allocated for unhealthy food groups (SSB and snacks). Studies in Kenya showed a positive association between purchasing food in supermarkets and increasing BMI(Reference Kimenju, Rischke and Klasen8), and that supermarket promotes unhealthy purchases(Reference Demmler, Ecker and Qaim14). Studies have also indicated that unhealthy foods in supermarkets are often more advertised and heavily promoted compared with healthy foods(Reference Dibb57,Reference Hawkes58) . Hence, not surprisingly, snacks and SSB (unhealthy foods) were frequently purchased by all shoppers.
The lower grocery and food expenditure by food insecure respondents in our findings are similar to a study conducted in an informal settlement in Johannesburg, South Africa(Reference Naicker, Mathee and Teare59) and also in other LMIC(Reference Melgar-Quinonez, Zubieta and MkNelly60,Reference Altman, Hart and Jacobs61) . However, despite this, in our study, the share expenditure on food categories was comparable between the food secure and insecure groups. Both food secure and food insecure shoppers spent the most on snacks, meat and grains and potatoes (in descending order). This suggests that even though food secure persons may spend more on food and probably buy more in terms of quantity than food insecure person, the quality of food procured in terms of “nutrients” and “health” may not differ.
Undoubtedly, a major contributing factor to the prevalence of obesity and diet-related NCD in South Africa is unhealthy food purchase behaviour which is encouraged by more shelf space allocated to unhealthy foods than healthy foods in supermarkets. This is supported by studies in high income countries that have shown the association of purchase and food items strategic placement and shelf space allocations(Reference Vandevijvere, Waterlander and Molloy10,Reference Rose, Hutchinson and Bodor17,Reference Farley, Rice and Bodor38) . Socio-economic status and food security status are associated with greater expenditure on food items in supermarkets but not associated with overall healthier food purchase. Based on the results of the current study as well as systematic reviews, supermarkets are not making sufficient efforts to promote positive food choices(Reference Gittelsohn, Trude and Kim62,Reference Bennett, Zorbas and Huse63) .
Study limitations
This study is novel in South Africa as it uses a combination of intercept surveys, data from supermarket grocery receipts and in-supermarket food price and food quality audits to better understand the food purchasing behaviours of the urban South African population. It also assesses the associations between food access and purchase behaviours. However, the study only focused on shoppers in a limited number of supermarkets and did not consider other local food purchasing outlets such as spazas, shebeens and street vendors. The study was also conducted in one city which limits the generalisation to other regions in South Africa. In addition, grocery receipts collected and coded were for only a single shopping trip which may not be reflective of the participants’ comprehensive grocery purchases, and we were unable to ascertain if the grocery receipt collected depicts the shopper’s typical shopping day. The coding food item process was broad and may not have captured all the different subgroup of food items. For example, lean meat, red meat, chicken feet, tripe and liver were all classified under the meat category, and food items such as ready-to-eat meals were not uncategorised. Also, although, “processed protein” was a food category (Table 1), we did not collect further details on whether or not foods within this category were highly processed or pre-prepared. There was also no consideration of the food items which may have been on sales promotions, and this may have influenced the food items purchase and amount spent during the shopping trip. In addition, the price and quality audits of the food items were conducted once, whereas prices and quality may have changed over the survey period. Due to the short form of the food security questionnaire used in this study, we were unable to further explore different levels of food insecurity. Lastly, we were unable to ascertain the quantities of food items purchased and the BMI and health status of the shoppers were not measured.
Conclusion
The South Africa population food expenditure is substantially more on unhealthy food. This unhealthy purchasing behaviour may be promoted by supermarkets as the main retail food environment in South Africa, by creating more accessibility to snacks and SSB compared with high quality F&V which is evidenced in the larger shelf spaces allocated to unhealthy foods. It is imperative to improve the quality of F&V in supermarkets located in the middle and low SEA. Consequently, further studies are needed to identify suitable interventions to encourage healthier food changes and choices especially in supermarkets in South Africa and to better understand other retail food environments in relation to dietary behaviours. Health and nutrition strategies such as promoting healthy food awareness, improved shelf space allocation and visibility of healthy foods, and access to quality and affordable healthy foods may have to be combined for effective outcomes. Further research should include a better understanding of underlying factors which may contribute to food purchase behaviour and expenditure in order to inform effective interventions.
Acknowledgements
Acknowledgements: Monica Uys, Hendriena Victor and Lungiswa Tsolekile are thanked for their input in developing the intercept survey, Nandipha Sinyanya for her exceptional fieldwork, Gabi Lasker and Sarah Chantler for capturing data from grocery receipts. Financial support: NRF and NRF-DST Centre of Excellence for Food Security. The funder had no role in the design, analysis or writing of this article. Conflict of interest: None. Authorship: E.V.L. conceptualised the study; E.V.L., R.D., J.B., N.L., T.P., L.M. and O.A. designed the study; F.O., E.V.L. and K.O. involved in data analyses and interpretation; F.O. wrote the manuscript; K.O., L.M., T.P., N.L., S.M., L.M. and J.B. were involved in the reviewing of the manuscript drafts. Ethics of human subject participation: This study was conducted according to the guidelines laid down in the Declaration of Helsinki and all procedures involving human subjects were approved by the Research Ethics Committee of the University of Cape Town (ethical approval code: HREC 696/2014). Written informed consent was obtained from all subjects. Approvals from the supermarkets to conduct intercept interviews on their shoppers were obtained in the form of signed consent forms by the managers of the supermarkets before the commencement of the interviews. Participation of the shoppers was voluntary and informed written consent was obtained prior to the interviews from all persons interviewed.
Supplementary material
For supplementary material accompanying this paper visit https://doi.org/10.1017/S1368980020001275


