


Introduction
Surging is the result of a cyclic How instability that is known lo affect a small percentage of glaciers world-wide. The global distribution of such glaciers is non-uniform and surge-type glaciers are common in certain regions. Observations during the active phase of the surge cycle, which are critical if our understanding of the phenomenon is to improve, are limited. They are concentrated geographically in a cluster of surge-type glaciers situated in western North America, in Alaska and the Russian Pamirs (e.g. Reference HarrisonHarrison, 1964; Reference Dolgoushin and OsipovaDolgoushin and Osipova, 1975; Reference Bindschadler, Harrison, Raymond and CrossonBindschadler and others. 1977: Reference KambKamb and others, 1985; Reference Echelmeyer, Butterfield and CuillardEchelmeyer and others, 1987; Raymond and others, 1987; Reference Echelmeyer and HarrisonEchelmeyer and Harrison, 1989; Reference Harrison, Eehelmeyer, Chacho, Raymond and BenedictHarrison and others, 1994). Observations during the quiescent phase are also concentrated in the North American cluster in Alaska and the Yukon Territory (Reference Clarke, Collins and ThompsonClarke and others, 1984; Reference Clarke, Schmok, Ommanney and CollinsClarke and Blake, 1991}.
The High Arctic arehipelago of Svalbard contains a cluster of surge-type glaciers. Estimates of the percentage of glaciers which have surged during the residence time of the glacier ice range from 90% (Reference Lefauconnier and HagenLefauconnier and Hagen, 1991) through 36% (Reference Hamilton and DowdeswellHamilton and Dowdeswell. 1996) to 13% (Reference Jiskoot, Boyle and MurrayJiskoot and others, 1998), however, all of these estimates are considerably greater than estimates for the world average of surge-type glaciers (less than 1%) or estimates for oilier clusters such as the Yukon Territory (4-6%) (Reference Clarke, Collins and ThompsonClarke and others 1986; Reference Atkinson, Jiskoot, Massari and MurrayAtkinson and others, in press). Surge-type glaciers in the High Arctic have received relatively little detailed observation in contrast to those in lower latitudes, especially during their active phase (Reference HagenHagen, 1988; Reference Dowdeswell, Hamilton and HagenDowdeswell and others, 1991), but are known to have notably longer active phases (Reference HagenHagen, 1988: Reference Dowdeswell, Hamilton and HagenDowdeswell and others. 1991) and longer quiescent phases. The existence of surge-type glaciers displaying a wide variety of thermal regimes and existing in diverse environments suggests that researeh is requiced in High Arctic locations.
Bakaninbreen is a 17 km long glacier in central Spitsbergen (Fig. 1) with a drainage basin of 60,8km2 (Reference Hagen, Liestol, Røland and JørgensenHagen and others, 1993). The glacier is an important tributary of Paulabreen. which feeds into Rindersbukta at the head of Van Mijentjorden (Fig. l). Bakaninbreen descends from an elevation of 500 m ; at about 10.5 km from the ice divide, it joins Paulabreen, turning sharply through 90. Theglacier continues as a distinctive stream for a further 6.5 km lo its terminus ai the fjord edge. This lower part of the glacier narrows progressively, is heavily mantled with medial moraines (Reference Hambrey, Dowdeswell, Murray and PorterHambrey and others, 1996) and was wasting back prior to a surge that began in 1985 [Fig. 2). Analysis of aerial photographs, topographic maps and the scientific literature shows that the ice front has retreated several kilometres since 1898 (Fig. 1). Terminal retreat of 1.0-1.4 km between 1977 and 1990 is shown in Figure 2. Reference Punning, Troitskiy and RajamäePunning and others (1976) suggested that Paulabreen and Bakaninbreen extended an additional 14.5 km down Rindcrsbukta and across inner Van Mijenfjorden to Svea about 500-600 years ago and that their retreat, probably punctuated by short advance periods associated with surging (Reference Punning, Troitskiy and RajamäePunning and others, 1976), has been Of the order of 14.5 km. Bakaninbreen has been shown to overlie at least 1 3 m of soft sediment in the lower reaches (Reference Porter, Murray and DowdeswellPorter and others, 1997). Beneath this sediment the bedrock comprises sandstone and friable mudstones (Reference Salvigsen and WinsnesSalvigsen and Winsnes, 1987).
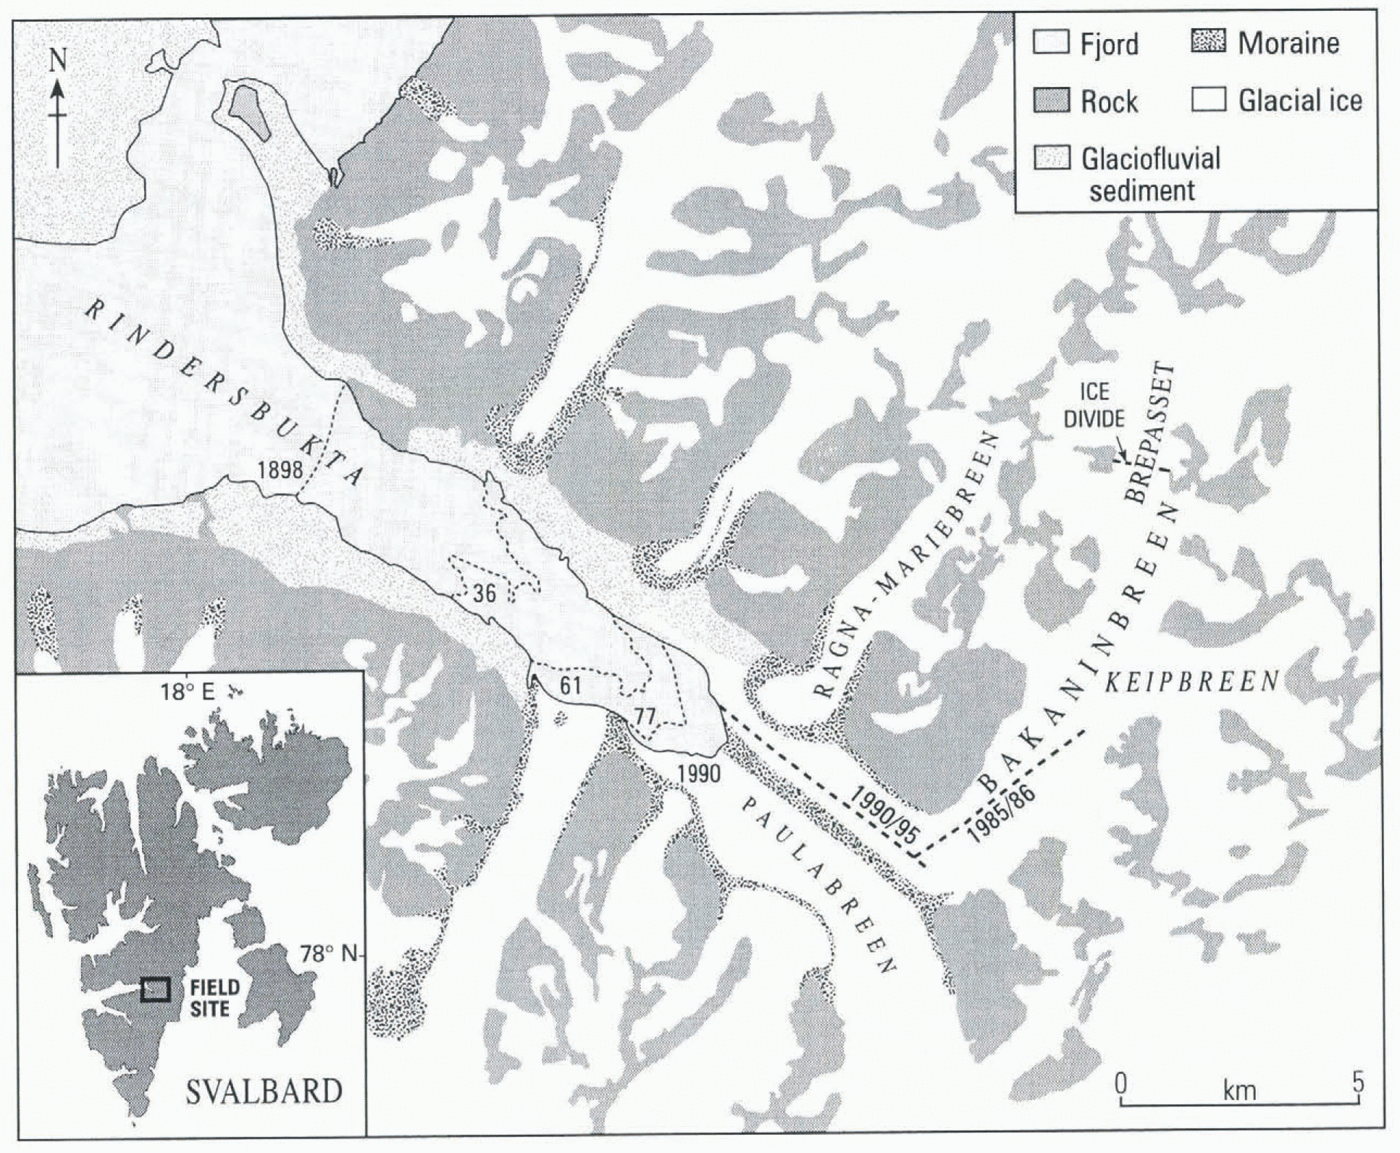
Observations on Bakaninbreen during the spring of 1985 showed that the glacier was in early surge phase. Prior to this date, no observed surge had been recorded, which suggests that the glacier had not previously surged this century and therefore has a quiescent phase greater than 85 years in length. In 1985, a ramp, 20-25 m in height, had formed at a distance of8 km from the terminus (Reference Dowdeswell, Hamilton and HagenDowdeswell and others, 1991). There was some crevassing on the ramp but the ice up-glacier seemed unaffected. The ramp travelled a further 1800 m down-glacier between May 1985 and June 1986. By 1986, crevassing was widespread above the ramp at both margins of the glacier, and within several of the upper basins large blocks stranded on the valley walls indicated extensive and rapid down-draw of the ice surface (Fig. 3). The surge continued to progress down-glacier during the period 1986-95 but the rate of surge-front propagation decreased; by 1995, forward propagation of the surge front appeared to have ceased. Field observations were made in two phases: 1985-87, early in the active part of the surge cycle, and 1990 95 in the later part of the surge. Between these two dates, observation was limited to an annual measurement of surge-front location, mostly from photographs.
Recent work at this glacier has included an extensive programme of hot-water drilling (Reference Murray and PorterMurray and Porter, 1994; Reference Porter, Murray and DowdeswellPorter and others, 1997) and detailed structural investigations (Reference Hambrey, Dowdeswell, Murray and PorterHambrey and others, 1996; Reference Murray, Gooch and StuartMurray and others, 1997). In this paper we discuss the large-scale geometric and dynamic effects of the surge.
Surge-Front Propagation
The 1985 95 propagation of the surge front, defined as the base of the ramp of ice, is shown in Figure 4. The exact date of the determination of the surge-front position varies from year to year. The data were collected by three methods. (1) Vertical aerial photographs (e.g. Fig. 2), which provide an accurate position and orientation of the surge front and, where stereo pairs are available, an estimate of the height of the surge front. (2) Oblique photographs either aerial or from a terrestrial high point (e.g. fig. 3a).This method is considered to be the least accurate, and to provide only an estimate of surge-front position and orientation and little information about the height or steepness of the front. (3) Surveyed longitudinal profiles which provide an accurate position for the surge front at a particular cross-glacier location as well as ramp steepness and height, but no information on the front’s orientation. Estimated horizontal errors are for field-surveyed positions (±5m), vertical aerial photographs (±50m), airborne radio-echo sounding (+75 m) and oblique aerial photographs (+200 m). Mole that, while survey results appear to be tin· most accurate, they give no information on the orientation of (he Surge front. Where no information on front orientation is available, its position is marked perpendicular in the valley walls (Fig. 4). Because the surge front changed in orientation during the surge (fig. 4a), calculated rates of propagation depend on where on the front the measurement is taken; we have used the centre-line position for all calculations.

Fig. 2. Vertical photographs of surge activity on Bakaninbreen: (a) 1970, before the surge (NP photograph number S70 4617). B- Bakaninbreen; P -Paulabreen; R -Ragna-Mariebreen.. No indication of die impending surge can be seen on the glacier surface and the glacier is thinning (arrow) and wasting back, lb) 1990 (NP photograph number S90 6825). By this lime, most of the forward propagation of the surge front had occurred. The surge front can be seen by the 60 m high ramp of ice that marks the transit in from fast-moving surging ice to stagnant inactive ice down-glacier. The lower region of I he glacier can be seen to be considerably thicker than before the surge in l970 due to ice thickening and the formation of the/ore bulge. (Photographs copyright Norsk Polarinstitutt).

Fig. 3. The effects of the singe of Bakaninbreen in May 1987.(a) Looking up-glacier, the surge front is visible as a very steep ramp of ice. (b) Further tip-glacie r, considerable ice draw-down occurred high on the glacier leaving blocks of ice stranded tens of metres above the glacier surface.
The surge front propagated at a rate of approximately 4.7 m d −1 (1820 m a −1) during 1985-86 (fig. 4b). In 1986-88, front propagation decreased to 1.0-1.1 m d −1 then increased in 1988-89 to 1.5 m d−1. Subsequently, the propagation rate dropped significantly and steadily over the period 1989-94 (fig. 4b). By 1994-95, front propagation was limited to 1.8-3.0 m a−1 (personal communication from D. Orton, 1997). After 1987, Bakaninbreen’s surge occurred alongside Paula-breen but has had little discernible effect on this glacier beyond some distortion of the medial moraines (fig. 2b).
W hile the mean annual velocity of the surge front can be inferred from these data, more detailed analysis is derived from surveys undertaken in the periods 1985-86 ιearly surge) and 1990-95 (late surge) discussed below.
Early Surge Phase (1985-86)
Glacier geometry — ice-surface profile
The ice-surface profile of Bakaninbreen was determined in both 1985 and 1986. In 1985, optical levelling and an electronic distance-measuring device (EDM) were used and tied to sea level (Fig 5). The position of this profile is shown in Figure 1. The uncertainties in elevation are estimated as +0.005m. In May 1986, a 60 MHz radio-echo sounder was flown over the glacier using a de Havilland Twin Otter aircraft. The flight track followed the surveyed stake line as closely as possible. Positional errors in navigation, tied to ground fixes, are considered to be less than ±150m. The pressure altitude was recorded, with an accuracy of ±1 m, by an on-board transducer and later calibrated to sea level by flying over open water and thin sea ice. The estimated error for surface elevations from the radar altimetry is on the order of ± 10-12 m.

Fig. 4. Propagation if the stage front between 1985 to 1995 (partly after Reference Dowdeswell, Hamilton and HagenDowdeswell and others, 1991). (a) Longitudinal position indicating month and year. (b) Mean annual rate of surge-front propagation. The error in propagation rate depends on the method of fixing surge front position in each-year (see text for details). Where no error bar is shown, the combined error is too small to be resolved on at this scale. Moraine areas have been taken from the 1990 aerial photograph (fig. 2b).

Fig. 5. Early surge-phase geometry during the period1985-86. (a) Glacier surface profile derived from a surface EDM survey in May 1985 and an airborne survey in June 1986. Bed profile derived from the 1986 radio echo-sounding (RES). Internal reflecting layer from the 1986 RES is included. The surge front can be seen as a 20-25 m high ramp in 1985, evolving into a 60 m high ramp of ice in 1986. The location of the survey line is shown in Figure 1. (b) Basal shear stress.
The two ice-surface-elevation datasets are show n in Figure 5 superimposed on the bed profile determined in 1986 from the radio-echo sounding. The ramp, marking the leading edge of the surge, exhibited a dramatic forward migration of 1800 m during this 13 month period. The surge front has no relationship with die basal topography and represents a wave of increased ice thickness. At the top of the 1985 ramp, the ice surface of Bakaninbreen had risen by 43 m. The maximum vertical surface thickening measured between the two profiles was 86 m. Thickening diminished up-glacier and points more than 2 km up-glacier from the 1985 front experienced surface lowering; it was not possible to survey this part of the glacier in 1986 due to extensive crevassing (e.g. Fig. 3). The average rate of surface lowering in the upper basin during 1985-86 can be estimated from the volume of ice in the prism formed by the forward movement of the surge front, assuming that volume is conserved (i.e. ignoring the volume taken up by opening crevasses]: the 6.7 x 10⁸ m3 of ice in this prism would requice a lowering of approximately 15 m over the 46 km2 up-glacier areas. It is clear that in some of the tributaries there was considerably more vertical down-draw than this estimate, as large blocks were seen stranded at the glacier margins some tens of metres above the ice surface (fig. 3b).
The surface and bed profiles allow calculation of the basal shear stress using the method of Reference Kamb and EchemeyerKamb and Echel-mever (1986) which takes into account the effects of longitudinal stress gradients. The longitudinal coupling length in this calculation was set to twice the ice thickness. Radar surveys have shown that the glacier has an approximately rectangular cross-section on radar profiles, and the width-to-depth ratio is sufficiently high to make the shape factor approximately equal to 11 Reference PatersonPaterson, 1994, p. 269). Using this method, the mean shear stress in the region of the 1985 and 1986 front positions was 52.1 kPa in 1985, rising to 66.4 kPa in 1986. The shear-stress profiles show peaks in basal shear stress at the surge front (fig. 5b) which exceed the estimated Strength of the basal sediments (Reference Porter, Murray and DowdeswellPorter and others, 1997).
Observations at the surge front
Repeated surveys of stakes positioned on and near the surge front allowed calculation of ice velocities during both 1985 and 198b. In the March 1985 survey, the location of the surge ramp was clearly defined and occupied a band across the glacier approximately 2500 m wide. A resurvey in April 1985 revealed a total horizontal displacement at stake 71 (located near the top of the ramp) of 7.1 m over a 30 day period (0.237 m d−1), while no detectable motion occurred at stake 133, below the ramp (Fig. 6).

Fig. 6. Horizontal velocities timing the early surge phase. Length of arrows is proportional to stake velocity over 49 days. Dotted lines show the surge-front position at the dates indicated. Dashed line shows the 1985 survey line and numbered squares the 1985 position of stakes discussed in the text. Circles show the 1986 position of Stakes discussed in the text. Errors resulting from resurveying are estimated to be less than ± 0.1 m.
In March 1986, a pattern of six stakes was installed: two (Nos 3 and 5) on the ramp, one in a crevassed region, one (No. 6) above the surge front and three (Nos 1, 2 and 4) below the ramp (Fig. 6). After a period of 49days, those stakes below the ramp showed little movement while those on and above the ramp displayed several tens of metres displacement in the down-glacier dicection (Fig. 6). Errors resulting from resurveying are estimated to be better than ±0.05 m and the corresponding errors in ice velocity
Table 1. Horizondal velocity measurements, at stake 5 on Bakaninbreen. (see Figure 6 for initial position). There are possible errors in the movement rate ending on 31 August 1986 due to the stake melting out mid being repositioned

This survey also allowed vertical elevation changes to be determined for these six stakes during spring 1986 which confirm the pattern of motion associated with the down-glacier propagation of the surge front (Fig. 7). Errors are estimated to be less than +0.002 m d−1. At stake 1, about 0.5 km down-glacier of the ramp on the stagnant lower part of Bakaninbreen, the total upward displacement was small ai about 0.8 m, a velocity of 0.016 m d−1. Although there was no observable horizontal movement during the period of measurement, this upward motion suggests compressive strain in the lower part of the glacier as the surge front approached. Just below the ramp, stakes 2 and 4 experienced vertical uplift rates of 0.100 and 0.055 m d−1 respectively, the former being closest to the surge front. On the ramp, slakes 3 and 5 exhibited large vertical velocities on the order of 0.300 m d−1. At stake 6, 0.6km above the ramp, the ice surface showed a pronounced lowering at a rate of 0.090 m d−1.
Further evidence on the dynamics of the surge from and ice propagation arises from the displacement of markers accidentally left on the glacier in 1986. The markers were large empty gas bottles coloured bright yellow which were left on the glacier just below the surge front (Fig. 2). The markers remained undisturbed until the arrival of the surge front sometime between June 1986 and May 1987. These markers were apparently transported either supraglacially or englacially until they were relocated at the surface in 1994. They were displaced down-glacier by about 1850 m and uplifted vertically by about 60 m, having experienced the surge (personal communication from D. Orton 1997).

Fig. 7. Vertical velocities during the early surge phase, 1986. Stakes 1, 2 and 4 are down-glacier of the surge front, stakes 3 and 5 are on the surge front and stake 6 is situated on the rapidly moving (surging) ice.
Strain rates
The 1985 array of stakes allowed short-term strains to be determined. Distances between groups of stakes were recorded using a steel tape at the end of the third week in May. The combined maximum error of the EDM recordings 3 weeks earlier and tape readings is estimated to be a maximum of ± 10 mm. Horizontal strain rates are shown in Figure 8 alongside surface-slope data taken from the initiai ground survey. The position of the surge front can be seen clearly by the change in ice-surface slope. Generally, strains are negative (compressive) and the greatest compression (1.20 a−1) occurs at the base of the ramp. This maximum is an order of magnitude greater than in typical non-surging glaciers but is 2 orders of magnitude less than the maximum strain rates reported from Variegated Glacier, Alaska, during its 1982-83 surge (Reference KambKamb and others, 1985).
Late Surge Phase (1990-95)
Glacier geometry
As the surge front continued to propagate down-glacier, surveys during 1990-95 monitored its slow progress (Fig. 4). By 1994, surge-front propagation appeared to have stopped, with the surge front situated approximately 1.8 km from the glacier margin (Fig. 4). This propagation was accompanied by an evolution of the geometry of the surge front; the height of the ramp increased from 20 to 25 m early in the surge to approximately 60 m in 1995. In Figure 9, the position and geometry of the surge front during the period 1990-95 is shown.
The entice lower region of the glacier has been thickened by the surge, with typical increases in glacier thickness being greater than 70 m above the surge front. Ice thickness in this part of the glacier was greatest during 1990-91. Since 1991, the glacier has been thinning steadily, although it is still considerably thicker than before the surge. The ablation rate in this region of the glacier’s ablation zone is approximately 2.4 m a−1; once the rate of uplift drops below this value the glacier will start to thin although stakes will still be uplifted.

Fig. 9. Late surge-phase geometry during the period 1990-94. (a) Glacier-surface profile from repeated surveys is shown superimposed on the 1985 pre-surge ice surface profile. The location of the survey line is shown in Figure 9. On profiles after 1990, the surge front can be clearly seen as a 60 m high ramp of ice and the fore bulge can be seen developed in front of the main surge front, (b) Basal shear stress.
A feature developed during the later stages of the surge was the “fore bulge" formed in the lower part of the glacier in front of the ramp of surging ice (Fig. 9). Ice in the fore bulge has been raised by up to 50 m, with the maximum about 500 m down-glacier of the base of the surge front. We term this feature a “fore bulge" because of its strong resemblance to the bulge developed by crustal warping beyond the margin of an ice sheet. However, we do not believe that the fore bulge at Bakaninbreen develops by a similar mechanism but rather by longitudinal compression of the glacier ice. The fore bulge results in reverse surface slopes at the base of the surge front. There was no evidence of the fore bulge feature immediately down-glacier of the surge front during the early part of the surge (Fig. 5), although there was a topographic low in the lower part of the glacier at approximately the position at which the surge front has halted (fig. 9a).

Fig. 8. Strain rates during the early surge. The position of the line of stakes is shown on Figure 6. (a) Surface slope. The position of the surge front can be clearly located by the high surface angles, (b) Horizontal strain rates. The greatest compressor strain rate occurs just down-glacier of the base of the surge front.
Basal shear stress was calculated from the surface profiles with the bed profile taken from drilling depths. Shear stress (fig. 9b) again shows peaks at the surge front which exceed the estimated strength of the basal sediments (Reference Porter, Murray and DowdeswellPorter and others, 1997); in contrast, the fore bulge results in low shear stresses. The mean shear stress was 24.5 kPa in 1985, rising to 27.7 kPa in 1990 and 52.4 kPa in 1994. At least part of the apparent rise in basal shear stress between 1990 and 1994 occurred due to lowering of the fore bulge which increases the apparent surface angle in the locality of the surge front.
Observations at the surge front
Repeated surveys by the Arctic Research Group and others over the period 1990-95 allow detailed examination of velocity changes close to the surge from dining the latter part of the surge. Survey data over this period are summarized in Figure 10. In 1990, two lines of slakes were established on the surge front, aligned parallel to the glacier-flow dicection (Fig. 10). The stakes were repeatedly surveyed during 1990, were relocated in July 1991, and then again in 1993. Figure 10 shows relative positions and velocities over the period 4-25 August 1990 and, where travel distance allowed, in 1991 and 1993. The markers were positioned on the flow unit closest to the Paulabreen medial moraine, along which longitudinal profiles had been measured (Fig. 9).
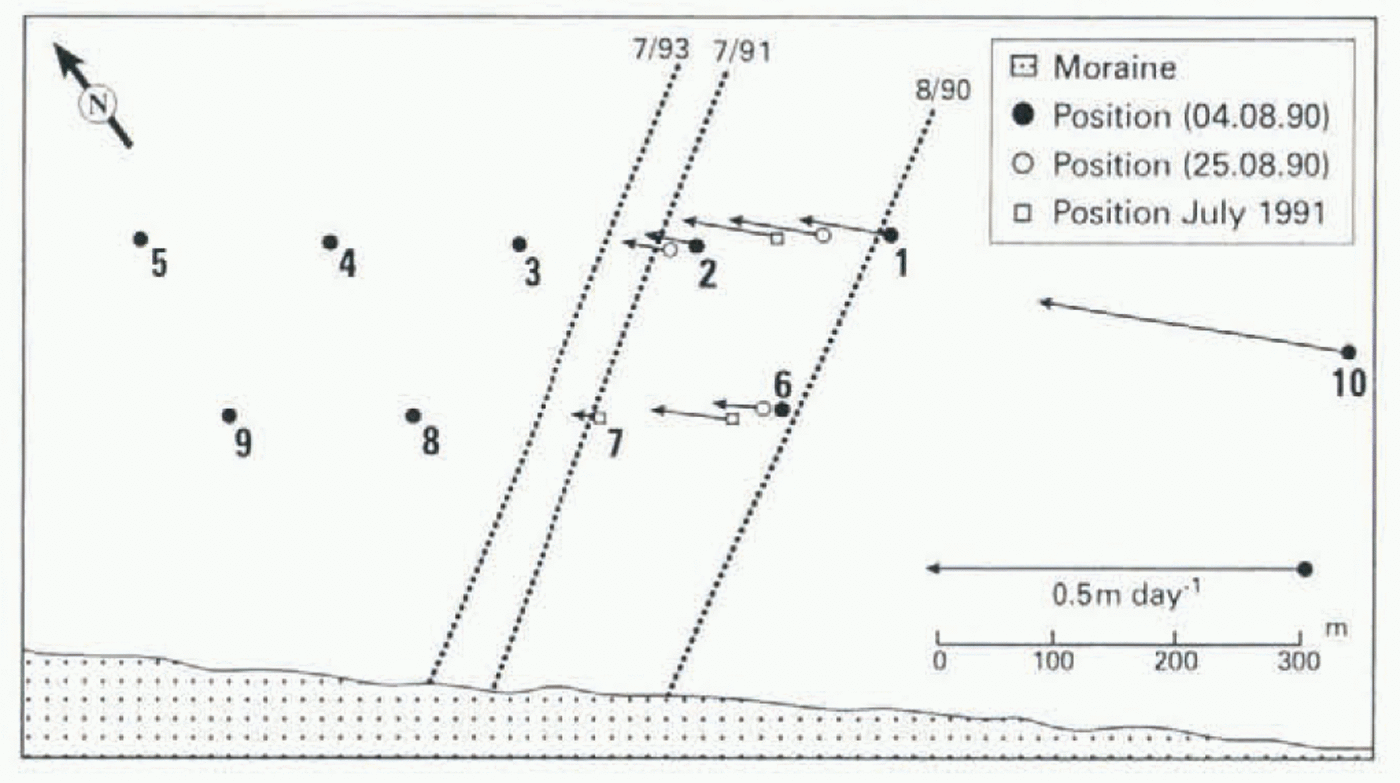
Fig. 10. Horizontal ice-surface velocities during the surge of Bakaninbreen, 1991-93. Length of arrows is proportional to slake velocity. Dotted lines show the surge-front position at the dates indicated.
A coherent pattern of ice propagation is displayed. Stake 10 was positioned in actively surging ice in 1990, being displaced at a mean velocity of 0.40 m d−1 over a total of 21 days. This displacement rate is considerably lower than measured in the early surge phase (Fig. 6) but is much greater than velocities at positions below the singe front over the same period (Fig. 10). Stakes 1 and 6, located on the surge from in 1990, show only small displacements over the measurement period (Fig. 8). Both became activated between 1990 and 1991 and were displaced by considerable distances: 39.1 m (a displacement rate of 0.107 m d−1) and 19.8 m (0.054 m d−1), respectively over 1 year, and then a further 55.2 m (0.076 m d−1) and 57.8 m (0.079 m d−1) over the subsequent 2 years. Stake 2, located approximately at the base of the surge front, became activated between 1990 and 1991, and travelled 10.0 m (0.055 m d−1) between 1991 and 1993. Stake 7, a little further down-glacier, was activated between 1991 and 1993, and was displaced about 14.0 m (0.019 m d−1) over the 2 year period. Quiescent-phase velocities on Bakaninbreen are unknown but, if those below the surge from can be taken as representative, these are expected to be extremely low, probably less than 1 ma−1 (0.003 m d −1). All of these displacements are viewed as real increases in ice velocity associated with propagation of the surge front as manifested by the steep ramp of ice. During the period 1990-95, the surge front propagated down-glacier about 374 m. Vertical uplift rates were 0.01-0.04md−1 in 1990 at the surge front (stakes 1-3, 6 and 7) and increased down-glacier.
These observations suggest that propagation of the surge from was still occurring over the period 1990-93, and that this propagation is associated with a compressive-stress regime. Furthermore, measurements of ploughing at the base suggest that activation of regions of the bed below the surge front occurred as laie as October 1994 and June 1995 (Reference Porter, Murray and DowdeswellPorter and others, 1997). Hence, Bakaninbreen was still in the active phase over at least some of the period 1990-95, despite the reduction in velocity associated with active ice propagation, and the low velocities that might on other glaciers be associated with quiescence rather than an active phase. While the exact liming of surge termination is clearly open to debate, the glacier has not shown a clear and rapid termination such as has been observed on glaciers in Alaska (Reference KambKamb and others, 1985; Reference Echelmeyer, Butterfield and CuillardEchelmeyer and others, 1987). Instead, the surge appears to have terminated progressively over a number of years (cf. Reference Dowdeswell, Hamilton and HagenDowdeswell and others, 1991).
Discussion
Comparison with other reported surges
Bakaninbreen appears to be similar to other glaciers in Svalbard in having a long active phase (approximately 10 years) and a long quiescent phase (probably greater than 85 years). Commensurate with long surge durations, both ice velocities and surge-front propagation velocities are also low in Svalbard. Ice velocities at Bakaninbreen in 1986 were typically measured at 1-3 m d−1, and the surge front advanced at rates of 2.5-4.7 m d −1 for the first 4 years of the surge (fig. 4b). Surge velocities on at least some other surge-type glaciers in the archipelago have been reported to be similar where these are known Usherbreen is a glacier of similar size to Bakaninbreen (covering an area of 69 km2 and 12.6 km in length) which surged around 1978-85 (Reference HagenHagen, 1988). Surge-front propagation at Usherbreen was reported to be approximately 1 m d−1 and ice velocities 1.5-4.3 m d −1 (Reference HagenHagen, 1988). Negribreen. East Spitsbergen, is very large compared to Bakaninbreen with a drainage basin of 1180 km2 Reference Hagen, Liestol, Røland and JørgensenHagen and others, 1993) and has been reported to have had a surge-front velocity averaging at 35 m d−1 (Reference LiestølLiestøl, 1969). Maximum ice velocities for surge-type glaciers outside Svalbard are typically faster than those recorded for Bakaninbreen, for example, at variegated Glacier of 50 m d−1 (Reference KambKamb and others, 1985) and at Medvezhiy Glacier of 105 m d−1 (Reference Dolgoushin and OsipovaDolgoushin and Osipova, 1975).
Basal shear stresses beneath Bakaninbreen in 1985 gave mean values of 52.1 kPa in the upper part of the glacier at the surge from (fig. 5b) and 24.5 kPa in the wasting lower region (fig. 9b). Between 1985 and 1986 the mean shear stress rose to 66.4 kPa over the iront region due to ice thick-ening and steepening of the surge front. As the surge front reached the lower regions of the glacier, the mean shear stress rose to 52.1 kPa in 1994 (fig. 9b). These values calculated for Bakaninbrcen are similar to those reported for other surge-type glaciers in the Svalbard archipelago; at Usherbreen, mean basal shear stress was 61 kPa before the surge and 33 kPa after the surge (Reference HagenHagen, 1988) and at Finsterwalderbreen in quiescence is 40-95 kPa (Reference Nuttall, Hagen and DowdeswellNuttall and others, 1997). In general, it would seem that basal shear stresses beneath surge-type glaciers in Svalbard are lower than those from other areas, for example, at Variegated Glacier stress varies between 160 and 180 kPa above the surge front (Raymond and others, 1987), at Medvezhiy Glacier it has been reported to be 150 kPa (McMeeking and Johnson, 1986) and at West Fork Glacier peaks at 130 kPa. Low vaines at Bakaninbreen may result from the soft sediments underlying the glacier. If this is the case, then equally low basal shear stresses from elsewhere in Svalbard lend support to suggestions that surge-type glaciers overlie soft beds in the archipelago (Reference Jiskoot, Boyle and MurrayJiskoot and others, 1998).
Mechanism of surge-front propagation
Several observations provide evidence on the mechanism of surge-front propagation at Bakaninbreen. The re-appearance of the gas-bottle markers at the ice surface up-glacier of the surge front after it had propagated through the position where the markers were originally located provides important and compelling evidence that over-riding was not a significant process of surge-front propagation; it would appear that these markers “rode the surge”, rather than themselves being over-ridden by active ice. Marker travel distance, presumably equal to ice displacement, is considerably less than the total distance of surge-front propagation and thus gives an estimate of actual ice displacement over the entice surge period. The contrast between ice- and surge-front displacements provides evidence that the surge propagates by the activation of stagnant ice. This observation is reinforced by the measured ice velocities in the early phase of the surge, which were 0.9-3.0 m d−1 during 1986, at a time when surge-front propagation was occurring at rates between 3.0 and 4.7 m d−1. A similar effect was reported on Muldrow Glacier in Alaska, where maximum surge-front velocities were estimated at 5 times actual ice velocities (Reference HarrisonHarrison, 1964). Measured vertical velocities (Fig. 7) and short-term strain rates at Bakaninbreen (Fig. 8) show that the maximum vertical velocity occurs at the base of the surge front. Compression of ice below the surge front must incorporate inactive ice essentially by a vertical displacement resulting from longitudinal compression rather than by over-riding (Fig. 11) before this ice becomes activated. Structural evidence from Bakaninbreen indicates that the formation of steeply up-glacier dipping thrusts that propagate from a position at or close to the glacier bed also play a role in the propagation of the surge front (Reference Hambrey, Dowdeswell, Murray and PorterHambrey and others, 1996; Reference Murray, Gooch and StuartMurray and others, 1997).
Raymond and others (1987) have indicated that a similar mechanism of ice incorporation by compression and activation may have occurred during the 1982-83 surge of Variegated Glacier. Furthermore, the process may be common whenever more rapidly moving ice impinges on stagnant or slowly moving ice. At Trapridge Glacier, the motion of the bulge marking the edge of the reservoir zone is strongly emergent in quiescence, with a similar pattern of compressional deformation followed by activation and incorporation of ice into the bulge (Reference Clarke, Collins and ThompsonClarke and others, 1984; (Reference Clarke, Schmok, Ommanney and CollinsClarke and Blake, 1991). At Trapridge Glacier, warm-based actively sliding ice impinges on ice which is frozen to its bed in this zone (Reference Clarke, Collins and ThompsonClarke and others, 1984; Reference Blake, Fischer and ClarkeBlake and others, 1994). A similar velocity structure is likely to be common in Svalbard and polythermal glaciers where the marginal ice is typically cold-based (Ødegard and others, 1997), and therefore relatively slow moving (Reference Nuttall, Hagen and DowdeswellNuttall and others, 1997).

Fig. 11. Schematic diagram to show surge-front propagation and incorporation of inactive ice. The surge front propagates largely by longitudinal compression and vertical extension of the ice. Ice draw-down occurs behind the front. The size of the vertical arrows gives an indication of the relative magnitude if vertical strain. Each column of ice maintains its volume between (a) and (b), uplift and down-draw results front longitudinal compressant and extension. The surge front is shown shaded in (a) and (b). In reality, overall glacier volume conservation is not requiced (although, neglecting ablation. conservation of ice volume clearly is), because the highly fractured and crevassed region left behind the surge front (fig. 3b) increases the ice “porosity”.
Most models of surge propagation explain a surge as resulting from a switch in basal conditions in which the glacier traps basal water during fast flow. This water is released on surge termination. For example, Kamb’s linked-cavity model suggests a morphological switch between efficient water evacuation through basal channels and less efficient linked cavities (Reference KambKamb, 1987). If a similar mechanism applies to the surge of Bakaninbreen and to surges of other glaciers in Svalbard, then the switch by which the surge terminates must be slow rather than abrupt in order to explain the indistinct nature of surge termination. One potential candidate for a slow switch would be the leakage of water through subglacial sediments.
Fore bulge
The fore bulge is a very conspicuous Feature that appears to have developed on Bakaninbreen only during the late stage of the glacier’s singe (Fig. 9). We suggest that this feature is formed by ice thickening due to longitudinal compression, in a manner similar to the observed uplift of the surge front. There is clear structural evidence, from the repeated faulting of the medial moraines, for strong compression of this pai’t of the glacier (Fig 2b). During the surge of Variegated Glacier, compression below the surge front resulted in the formation of thrust faults which were due to brittle failure in compression (Reference Lawson, Sharp and HambreyLawson and others, 1994). However, we have been unable to find reports of features similar to the Bakaninbreen lore bulge forming during surges of other glaciers although, if a surge results in frontal advance, then it would be impossible to identify such a feature once the front had reached the glacier snout.
The fore bulge is suggested to form in the following manner. The surge front separates fast-moving ice from slow stagnant ice, with the front region being associated with a change in basal conditions from low friction to high friction (McMeeking and Johnson, 1986). Because the down-slope component of weight cannot be supported by basal friction in the low-friction region, it must be supported by the longitudinal stress; therefore, a part of the weight of the surging mass is supported down-glacier of the surge front in the region of the glacier with high basal friction (McMeeking and Johnson, 1986). Thus, the compressivc stresses required to thicken the ice below the surge front are easily explained. Less easy to explain is the formation of the fore bulge in the later stages of the surge but its apparent absence in the early stages. Three factors might contribute. First, the surge front was slowing during the period of the formation of the fore bulge. Secondly, Ragna-Mariebreen (Fig. 1) presented some resistance to flow, as can be seen by the rotation of the surge front during the late surge phase (Fig. 4). Thirdly, amplification of pre-existing topography will occur because the rate of ice thickening will lie equal to the product of the ice thickness and the longitudinal strain rate Reference Sharp, Lawson and AndersonSharp and others, 1988). The fore bulge may result wholly or partially from the amplification of pre-existing surface features.
The overall thickening of Bakaninbreen in the downstream region gives an estimate of the magnitude of vertical extension causing the fore bulge, in this case an average of 79%. Provided the volume of the glacier has been conserved and the conceptual model presented in Figure 11 is correct, then the increase in volume of the lower part of the glacier requires horizontal strain of 29% at the base of the surge front averaged over the entice surge duration.
Synthesis and Conclusions
In common with observations on other active-phase surge-type glaciers (e.g. Raymond and others, 1987; Reference Sharp, Lawson and AndersonSharp and others. 1988), the dynamic regime of Bakaninbreen during its surge can be divided into four regions which are summarized in Figure 12: Upper region where only extensions flow is observed, as is manifest in wide-scale crevassing and stranded blocks tens of metres above the post-surge ice surface. Such (low is associated with fast ice-propagation rates and negative vertical strain rates.

Fig. 12. Schematic diagram to summarily the flow regime during the surge in each region of Bakaninbreen. A detailed description is given in the text.
(2) Mid-glacier region where compressive flow is followed by extensive flow. In this region, ice experiences, first, a strong longitudinally compressive regime associated with vertical ice extension. Compression starts some time before the arrival of the surge front as the compressive regime extends a considerable distance down-glacier of the front. This initial compressive flow is associated with a very low horizontal strain but considerable positive vertical strain. As the surge front passes through, horizontal velocity increases and the stress regime then becomes extensive. Negative vertical strain and ice down-draw occur as ice velocities drop.
(3) Surge front where ice velocities during the surge are high but vertical strain rates remain positive in association with compressive ice flow. On Bakaninbreen, this region was associated with considerable distortion of medial moraines.
(4) Lower region below the surge front where ice compression occurs but down-glacier ice velocity is very low. On Bakaninbreen, this has resulted in the formation of a fore bulge; on Variegated Glacier this region was characterized by the formation of thrust faults (Reference Sharp, Lawson and AndersonSharp and others, 1988).
The surge of Bakaninbreen represents the first time a glacier in the High Arctic has been observed throughout its active phase. The surge front propagated faster than the glacier ice, at velocities up to 4.7 m d−1. It appears to do so by a combination of longitudinal compression and thrusting. Typical ice velocities in the early phase of the surge were 0.9-3.0 m d−1 during the time when surge-front propagation was occurring at rates between 3.0and 4.7 m d−1. The surge front travelled a total of 6.7 km down-glacier between 1985 and 1995, but the surge did not result in advance of the glacier. The surge front stopped approximately 1.8 km up-glacier of the terminus. The surge has been characterized by a long active phase, approximately 10 years, low basal shear stresses and a slow and indistinct termination. These features seem to be typical of surges of a number of. Svalbard glaciers (Doweleswell and others, 1991) but are dissimilar to the short, rapidly terminating surges of many Alaskan glaciers. These characteristics are more likely to result from a surge over a soft sedimentary glacier bed.
Acknowledgements
This research has been partly funded by E.U. grant No. EN5V-CT93-0299 and U.K. NERC grant No. GR3/9031. We thank members of the Arctic Research Group, D. Orion (IX Automation) and N. Riley (B.P.) for supplying some of the data presented in this paper. Reviews by R. Bindschadler and an anonymous reviewer substantially improved this paper.


