


Several dietary risk factors have been discussed in the context of the formation of Ca oxalate (CaOx) uroliths in cats. These include factors that influence renal Ca and oxalate (Ox) excretion, urine pH and urinary concentrations of crystallisation inhibitors, e.g. citrate and glycosaminoglycans( Reference Dijcker, Plantinga and van Baal 1 ). Besides the direct impact of dietary Ca( Reference Lekcharoensuk, Osborne and Lulich 2 , Reference Passlack and Zentek 3 ) or exogenous and endogenous Ox( Reference Dijcker, Plantinga and van Baal 1 , Reference Dijcker, Hagen-Plantinga and Hendriks 4 , Reference Dijcker, Hagen-Plantinga and Everts 5 ) on urine composition, indirect effects of other dietary components, such as Mg, P and K, on the intestinal absorption and renal excretion of Ca and Ox have also been reported( Reference Dijcker, Plantinga and van Baal 1 ). For instance, Ca and Mg can form a complex with free Ox in the intestine( Reference Stevenson, Blackburn and Markwell 6 – Reference Penniston and Nakada 8 ), resulting in reduced intestinal absorption and renal excretion of Ox( Reference Liebman and Chai 9 – Reference Holmes, Goodman and Assimos 11 ), which has been demonstrated not only in human subjects, but also in dogs and rats. Moreover, other factors such as dietary P and fat can interact with Ca in the intestine and thereby prevent its complexation with Ox, which indirectly improves the intestinal absorption of Ox( Reference Masai, Ito and Kotake 12 , Reference Naya, Naya and Ito 13 ). Furthermore, dietary K seems to play an interesting role in the formation of CaOx uroliths. Data from human studies demonstrate that high levels of dietary K reduce renal Ca excretion and thereby decrease the risk of the formation of Ca-containing crystals and stones( Reference Lemann, Pleuss and Gray 14 , Reference Lemann, Pleuss and Gray 15 ). In cats, low dietary K concentrations are also considered to be a risk factor for the formation of CaOx uroliths( Reference Lekcharoensuk, Osborne and Lulich 2 ). However, this observation has been made based on only epidemiological evaluations and, to our knowledge, no detailed experimental studies have been carried out.
It can be suggested that not only K concentrations, but also the anions in K salts affect the urine composition of cats. It is known that the inclusion of potassium citrate in diets can help to prevent the formation of CaOx uroliths by an alkalising effect on the urine and a resulting higher solubility of the crystals by modifying the urine pH and the increased fraction of Ca bound to the non-metabolisable citrate anions( Reference Osborne, Kruger, Lulich, Osborne and Finco 16 , Reference Pietrow and Karellas 17 ). The physiological explanation for the impact of dietary K salts on urine pH can be found in the respective counter-ion. If dietary K is associated with a metabolisable organic anion (e.g. HCO3), K will be renally excreted and the organic anion will be oxidised to CO2 and H2O( Reference Poupin, Calvez and Lassale 18 ). To maintain the acid–base balance, HCO3 will be produced and also be excreted in the urine, which leads to an increase in urine pH. In contrast, if dietary K is associated with a non-metabolisable anion (e. g. Cl−), both K and the organic anion will be renally excreted( Reference Poupin, Calvez and Lassale 18 ), which may lead to the acidification of the urine. Therefore, dietary K salts, such as KCl and KHCO3, may affect the acid–base balance and thereby urinary proton and base excretion in cats. Until now, to our knowledge, no detailed studies have been carried out to evaluate the effects of dietary K levels and salts on urine composition in cats. However, it is known that in cats( Reference Dow, Fettman and Smith 19 ), as in other species, renal K excretion increases with increasing levels of K in the diet( Reference Von Engelhardt and Breves 20 ).
Considering the above-mentioned observations of the effects of dietary K on urinary Ca concentrations in humans and that the alkalisation or acidification of the urine affects the solubility of urinary minerals( Reference Markwell, Buffington and Smith 21 ), the present study aimed to investigate the effects of varying levels of KCl and KHCO3 in a diet on urine pH as well as on urinary mineral and Ox excretion in cats. It was hypothesised that the expected effects are dependent not only on dietary K concentrations, but also on the anions present in the K salts. To evaluate the regulatory processes involved in mineral metabolism, the apparent digestibility of the dietary minerals and the concentrations of minerals in the blood were evaluated.
Materials and methods
Animal study
The experimental protocol was approved by the Animal Welfare Committee (Landesamt für Gesundheit und Soziales, Berlin, Germany, G 0157/10). A total of eight adult cats (European shorthair, four males and four females, 38 months old (mean; sem: 2·00)) were included in the present study. The cats were housed in a room under constant light (12 h light–12 h darkness) and temperature (21°C) conditions. The cats were fed the experimental diets individually at 07.00 and 12.00 hours, and daily feed intake was recorded for each cat. The cats were housed in groups during a 9 d adaptation period and in metabolism cages during an 8 d collection period. The metabolism cages contained purpose-built cat litter boxes with plastic pellets as litter and connected urine collection containers to separate the urine from the faeces. Blood was collected from the cats in the morning (fasting) of the last day of each feeding period.
Diets and nutrient analysis
The cats were fed seven dry extruded diets during seven feeding periods. During each 17 d feeding period, all the cats were fed the same diet at the same time. The diets differed in the source of the added K (native concentration in the diet, KCl and KHCO3) and in total K concentrations (0·31 % native K in DM and intended 0·50, 0·75 and 1·00 % K). The experimental diets were fed in the following order: diet containing only native K; diets with the added KCl; diets with the added KHCO3. The results of the nutrient analysis of the diets are given in Table 1.
Table 1 Results of nutrient analysis of the experimental diets*

* Ingredient list: poultry meal; rice; wheat whole grain; poultry fat; dried beet pulp; salt; yeast; marigold meal; minerals; vitamins.
† Total concentrations of K in DM: 0·31 % and intended 0·50, 0·75 and 1·00 %.
The concentrations of crude nutrients were measured according to the Weende analysis of feed( Reference Naumann and Bassler 22 ). This method was modified for the measurement of crude fat. In the first step, fat in the feed sample was extracted for 3 h using petroleum diethyl ether. The petroleum diethyl ether was consecutively vaporised for 1 h and 100°C in a compartment dryer. After cooling in a desiccator, the amount of crude fat was calculated by weighing the specimen cup with the feed sample before and after fat extraction. The measurement of the concentrations of minerals in the diets was carried out following the method used for the measurement of those in faecal samples (discussed below).
The diets were formulated to fulfil the dietary recommendations for adult cats( 23 ). The concentrations of K in the basal diet (3·09 g/kg DM) and in the lowest-KCl (4·68 g/kg DM) and lowest-KHCO3 (5·06 g/kg DM) diets were below or close to the recommendations of 5·2 g/kg DM (with 16·7 MJ metabolisable energy (ME)/kg DM), which was due to the ingredients of the basal diet, but it allowed for the validation of the actual data on K requirements in cats( 23 ).
Sample collection and pH measurements
The urine and faeces of the cats were collected at 07.00 and 12.00 hours. The measurement of urine pH was carried out on the first 2 d of the 8 d collection period. Therefore, the urine collection containers were treated with three drops of chlorhexidine–digluconate to prevent the overgrowth of bacteria in the urine. Urine pH was measured using the SevenMulti pH meter (Mettler-Toledo GmbH) when the cats were fasting (07.00 hours) and postprandially (12.00 hours). On the remaining 6 d of the collection period, the urine collection containers in the metabolism cages were treated with 2 ml of glacial acetic acid for the conservation of the urine. All the urine samples of each cat were filled into one large collection container and stored in a freezer ( − 20°C). Therefore, it was possible to determine the total urine volume during the collection period for each cat. The faeces of the cats were collected during the entire 8 d collection period and also stored in a freezer at − 20°C until further analysis.
Preparation and analysis of the samples
The urine and faecal samples were prepared and analysed as described previously( Reference Passlack and Zentek 3 ). In short, the urine samples were acidified with hydrochloric acid (37 %) to adjust the pH to 2 (SevenMulti pH meter, Mettler-Toledo GmbH). Subsequently, the samples were filtered (Syringe Filter, Bulk, surfactant-free cellulose acetate, 0·2 μm, 25 mm non-sterile, Thermo Scientific) and stored at − 80°C until the determination of the concentrations of urea, creatinine, anions and cations. The concentrations of urea and creatinine were measured using a HPLC method on an Agilent 1100 system with a UV detector (Agilent Technologies). The concentrations of urinary anions (sulphate and P as major anions; Ox and citrate as minor anions) were measured using an ion exchange HPLC system (Dionex DX-500; Dionex Corporation). The concentrations of urinary cations (Na, K and ammonium as major cations; Mg and Ca as minor cations) were measured using also an ion exchange HPLC system (Dionex DX-120; Dionex Corporation). The data obtained for urea, creatinine, anions and cations were analysed using Chromeleon Client, version 6.80 SP2 (Dionex Corporation).
The faecal samples were freeze-dried, ashed and subsequently mixed with hydrochloric acid (37 %) and distilled water in a beaker (except for the samples used for the determination of Cl concentrations). The beaker was covered and put into a warm sand bath for 50 min at 210–220°C. After cooling, the samples were transferred into flasks filled with distilled water using an ash-free filter. After this procedure, the concentrations of minerals in the samples were determined. For the determination of the concentrations of Cl, the faecal samples were also freeze-dried. Later, 2·5 g of these samples were weighed and transferred into a 50 ml graduated flask, mixed with 25 ml of distilled water and incubated in a shaker for 30 min at room temperature. Then, 1 ml of zinc sulphate × 7H2O (35·8765 g/100 ml distilled water) and 1 ml of potassium hexacyanoferrate (15 g/100 ml distilled water) were added, and the graduated flask was filled with distilled water. After shaking, 10 ml of this solution were transferred into a 15 ml tube and centrifuged for 10 min at room temperature and 2000 g (Heraeus Multifuge 3 S-R, Thermo Scientific). Finally, the samples were filtered through 0·45 μm cellulose acetate membranes (VWR International), and the concentrations of Cl were measured using an ion exchange HPLC system (Dionex DX-500; Dionex Corporation).
The concentrations of P in the faecal samples were measured spectrophotometrically( Reference Gericke and Kurmies 24 ) (Ultrospec 2000, Pharmacia Biotech). The concentrations of Ca, Na, K and Mg in the faecal samples were measured by atomic absorption spectrometry (flame atomic absorption spectrometer type vario 6 with an autosampler AS 52, Analytik Jena AG).
Blood samples were stored at room temperature for 1 h before further preparation. While the EDTA tubes were stored in the refrigerator at 4°C, the serum tubes were centrifuged at 4°C and 1811 g for 10 min (Heraeus Megafuge 1.0R, Thermo Scientific). Serum was pipetted and stored in a 2 ml tube in the refrigerator before sending all the blood samples to an external laboratory (Laboklin, Bad Kissingen, Germany) or to the Clinic of Small Animals, Freie Universität Berlin (cooled transport). The concentrations of minerals (Ca, P, Na, K and Cl) in the blood samples were determined photometrically, and the complete blood count was carried out using an automatic method.
Statistical analysis
Data were analysed with SPSS 19 (SPSS, Inc.). For each outcome variable, a repeated-measures ANOVA with the within-subject factors K concentration and K salt (KCl and KHCO3) was carried out. Polynomial contrasts (linear and quadratic) were separately calculated for the KCl and KHCO3 treatments and for the arithmetic means of both treatments at K levels. In case of a significant interaction between dietary K salt and dietary K concentration, both the P values of the polynomial contrasts for KCl and KHCO3 treatments are given and the contrasts for the averaged measurements are omitted. If the interaction is not significant, we only specify the contrasts for the averaged measurements. The data are presented as means with their standard errors. The level of significance was α = 0·05. Due to the exploratory nature of the study, we did not adjust the level of significance for multiple testing.
Results
Animal health, body weight, feed intake and urine volume
All the cats were healthy during the entire study period, and no effect of diets on body weight (BW) was observed (Table 2). Urine volume was elevated when the cats were fed the KCl diets (interaction: P= 0·318; salt: P= 0·047), and no significant dependence on dietary K levels could be observed. In both the KCl and KHCO3 groups, the feed intake was elevated when supplementary K was fed during the urine collection period (interaction: P= 0·440; linear contrast: P= 0·026 and quadratic contrast: P= 0·018) and during the faeces collection period (interaction: P= 0·516; linear contrast: P= 0·016 and quadratic contrast: P= 0·02) (Tables 3 and 4).
Table 2 Body weight (kg), urine volume (ml/kg body weight per d), urine pH and urine composition (mg/l) of cats fed diets with different potassium concentrations* and salts (Mean values with their standard errors, n 8 per diet)

Ox, oxalate.
* Total concentrations of K in DM: 0·31 % and intended 0·50, 0·75 and 1·00 %.
† The interaction term drives the other contrasts as follows: when the interaction is not significant, only P values for linear and quadratic contrasts for K (main effect means averaged over K sources) and the P value for salt are reported. When the interaction is significant, only P values for linear and quadratic contrasts for individual salts (KCl and KHCO3) are reported.
Table 3 Feed intake (g DM/kg body weight per d) during the urine collection period, renal mineral and oxalate (Ox) excretion (mg/kg body weight per d) and ratio of renal mineral excretion:mineral intake (%) of cats fed diets with different potassium concentrations* and salts (Mean values with their standard errors, n 8 per diet)
* Total concentrations of K in DM: 0·31 % and intended 0·50, 0·75 and 1·00 %.
† The interaction term drives the other contrasts as follows: when the interaction is not significant, only P values for linear and quadratic contrasts for K (main effect means averaged over K source) and the P value for salt are reported. When the interaction is significant, only P values for linear and quadratic contrasts for individual salts (KCl and KHCO3) are reported.
Table 4 Feed intake (g DM/kg body weight per d) during the faeces collection period, amount of faeces, DM of the faeces and mineral concentrations in the faeces (mg/g DM) of cats fed diets with different potassium concentrations* and salts (Mean values with their standard errors, n 8 per diet)

* Total concentrations of K in DM: 0·31 % and intended 0·50, 0·75 and 1·00 %.
† The interaction term drives the other contrasts as follows: when the interaction is not significant, only P values for linear and quadratic contrasts for K (main effect means averaged over K source) and the P value for salt are reported. When the interaction is significant, only P values for linear and quadratic contrasts for individual salts (KCl and KHCO3) are reported.
Urine pH
The interaction between dietary K salt and dietary K concentration was not significant for fasting urine pH (P= 0·575) (Table 2). Compared with the basal diet, which contained only native K, the dietary inclusion of 0·50 % K as KCl led to a decrease in urine pH from 6·29 to 5·30. However, an increase in the pH was observed with higher dietary K levels, added either as KCl or as KHCO3 (linear contrast for K: P= 0·022; quadratic contrast for K: P= 0·004). The measurement of the postprandial urine pH indicated only a numerical increase with higher levels of K in the diets (P>0·05).
Urine composition and renal mineral excretion
The dependence of urinary K concentrations on dietary K levels did not differ between the KCl and KHCO3 groups (interaction: P= 0·208) (Table 2). We observed a highly significant linear increase in urinary K concentrations with higher dietary K levels (P< 0·001). Renal K excretion reached values of 116 mg/kg BW per d (1·00 % KCl) and 94·6 mg/kg BW per d (1·00 % KHCO3) compared with 75·0 mg/kg BW per d after feeding the cats with the basal diet (Table 3); however, this increase was not statistically significant (P for interaction = 0·467; linear contrast for K: P= 0·128). The ratio of renal K excretion:dietary K intake decreased with increasing dietary K levels (P for interaction = 0·522; linear contrast for K: P= 0·004).
The interaction between dietary K salt and dietary K concentration was not significant for urinary Ca concentrations (P= 0·795) and renal Ca excretion (P= 0·766). However, while urinary Ca concentrations were unaffected by the dietary K concentration or dietary K salt (P>0·05), renal Ca excretion was significantly higher in the KCl groups than in the KHCO3 groups (salt: P= 0·026). Urinary Ox concentrations were generally higher in the KHCO3 groups than in the KCl groups, and the dependence of urinary Ox concentrations on dietary K levels was different in the KHCO3 and KCl groups (interaction: P= 0·001). In the KHCO3 groups, we observed a sharp increase in urinary Ox concentrations between native and 0·75% dietary K levels and a moderate decrease between 0·75% and 1·00% K levels in the diets (linear contrast: P= 0·021 and quadratic contrast: P= 0·001), whereas in the KCl groups, no significant effect on urinary Ox concentrations was observed (P= 0·132 and P= 0·334 for linear and quadratic contrasts, respectively). The calculation of the daily renal Ox excretion indicated a significant interaction between dietary K salt and dietary K concentration (P= 0·037); however, the dependence of renal Ox excretion on dietary K levels did not reach significance either for the KCl groups or for the KHCO3 groups.
The interaction between dietary K salt and dietary K concentration was significant for urinary P concentrations (P= 0·002). In only the KCl groups, urinary P concentrations increased significantly between native and 0·50 % K levels in the diets and decreased at higher dietary K levels (linear contrast: P= 0·045 and quadratic contrast: P= 0·017). However, neither the evaluation of renal P excretion nor that of the ratio of renal P excretion:dietary P intake indicated diet-dependent differences (P>0·05).
In the KHCO3 groups, urinary Na concentrations increased between native and 0·75 % K levels in the diets and decreased between 0·75 and 1·00 % dietary K levels, whereas in the KCl groups, the increase was observed at 0·50 % dietary K levels (interaction: P= 0·038). In both the KCl and KHCO3 groups, the quadratic contrasts were significant (P= 0·002). In addition, a linear increase was observed only in the KHCO3 groups (P= 0·003). The described effects could not be confirmed statistically for renal Na excretion (P>0·05), and additionally no group differences (P>0·05) were observed for the ratio of renal Na excretion:dietary Na intake.
No significant interaction between dietary K salt and dietary K concentration was observed for urinary Mg concentrations (P= 0·308). Urinary Mg concentrations (means averaged over dietary K sources) increased between native and 0·50 % dietary K levels and decreased between 0·50 and 1·00 % dietary K levels significantly (linear contrast: P= 0·046). However, no group differences were detected for renal Mg excretion or the ratio of renal Mg excretion: dietary Mg intake (P>0·05).
Urinary urea curves were similar for both the KCl and KHCO3 groups (interaction: P= 0·131). Initially, urea concentrations (averaged over dietary K sources) decreased, bottomed out at 0·75 % K levels in the diets and increased again. Both the linear decrease (P< 0·001) and the quadratic effect (P= 0·003) were highly significant.
Urinary creatinine concentrations were significantly higher in the KHCO3 groups than in the KCl groups (P for interaction = 0·363; P for salt = 0·011). The urinary creatinine curve rose between native and 0·50 % dietary K levels, peaked out at 0·50 % K levels, and declined between 0·50 and 1·00 % K levels in the diets (quadratic effect: P= 0·039).
No significant interaction between dietary K salt and dietary K concentration could be observed for urinary sulphate concentrations (P= 0·420). The linear decrease in urinary sulphate concentrations with respect to dietary K levels was significant (P= 0·005).
Urinary citrate concentrations exhibited no dependence on the dietary K salt (P= 0·322), and there was no significant interaction between dietary K salt and dietary K concentration (P= 0·602). Only the linear increase in urinary citrate concentrations (averaged over dietary K sources) was significant (P= 0·016).
We observed a significant interaction between dietary K salt and dietary K concentration for urinary ammonium concentrations (P= 0·023). In both the KCl and KHCO3 groups, urinary ammonium concentrations increased between native and 0·50 % K levels in the diets and decreased between 0·50 and 1·00 % dietary K levels (quadratic effects: P= 0·039 and P= 0·003 for the KCl and KHCO3 groups, respectively). In addition, we observed a significant linear decrease in the KHCO3 groups (linear contrast: P= 0·007).
Faecal parameters and faecal mineral excretion
The amount of faeces (g/d) was dependent on dietary K levels only in the KCl groups (interaction: P= 0·003), and generally higher amounts were observed in the KCl groups than in the KHCO3 groups (Table 4). In the KCl groups, the amount of faeces increased between native and 0·50 % dietary K levels and decreased between 0·50 and 1·00 % K levels in the diets (quadratic contrast: P= 0·001). The amount of faeces on a DM basis reached a maximum at 0·50 % dietary K levels when added as KCl and subsequently decreased to levels similar to that of native K in the diets. In the KHCO3 groups, the amount of faeces (g DM/d) decreased initially, bottomed out at 0·75 % dietary K levels and subsequently increased (interaction: P< 0·001; quadratic contrasts: P= 0·003 and P= 0·041 for the KCl and KHO3 groups, respectively).
Faecal DM concentrations decreased between native and 0·75 % dietary K levels in both the KCl and KHCO3 groups. In the KHCO3 group, we observed a sharp increase between 0·75 and 1·00 % K levels in the diets, whereas in the KCl groups, faecal DM concentrations decreased (interaction: P= 0·003; linear and quadratic contrasts for the KHCO3 groups: P= 0·022 and P= 0·001, respectively).
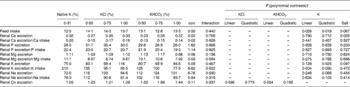
Faecal K concentrations increased with increasing dietary K levels (no interaction; linear contrast: P= 0·044). In the KCl groups, the apparent digestibility of K decreased between native and 0·50 % dietary K levels and subsequently increased up to 1·00 % K levels in the diets, while it steadily increased in the KHCO3 groups up to 0·75 % dietary K levels, followed by a small decrease (interaction: P= 0·003; linear contrast for the KCl group: P= 0·001, linear contrast for the KHCO3 group: P= 0·003, and quadratic contrast for the KHCO3 group: P= 0·020) (Table 5). An interaction between dietary K salt and dietary K concentration was observed for faecal K excretion (P= 0·003). In the KCl groups, faecal K excretion increased between native and 0·50 % dietary K levels and subsequently decreased up to 1·00 % K levels in the diets. In the KHCO3 groups, faecal K excretion levelled off between native and 0·75 % dietary K levels and increased between 0·75 and 1·00 % K levels in the diets (linear and quadratic contrasts for the KCl groups: P= 0·047 and P= 0·017, respectively; linear contrast for the KHCO3 groups: P= 0·032).
Table 5 Faecal mineral excretion (mg/kg body weight per d), apparent digestibility of minerals (%) and mineral retention (mg/d) of cats fed diets with different potassium concentrations* and salts (Mean values with their standard errors, n 8 per diet)

* Total concentrations of K in DM: 0·31 % and intended 0·50, 0·75 and 1·00 %.
† The interaction term drives the other contrasts as follows: when the interaction is not significant, only P values for linear and quadratic contrasts for K (main effect means averaged over K source) and the P value for salt are reported. When the interaction is significant, only P values for linear and quadratic contrasts for individual salts (KCl and KHCO3) are reported.
Faecal Ca and Mg concentrations were dependent on dietary K levels only in the KCl groups (interaction: P= 0·001 and P= 0·013). The faecal Ca and Mg curves for the KCl groups were V shaped and reached their minimum at 0·50 % dietary K levels (quadratic contrasts for the KCl groups: P= 0·004 and P= 0·007). Faecal P, Na and Cl concentrations were not affected by the dietary K salt or dietary K concentration (P>0·05).
Faecal Ca, P, Na and Mg excretion was dependent on dietary K levels only in the KCl groups (interaction: P= 0·047, P= 0·005, P= 0·041 and P= 0·007) and reached its maximum at 0·50 % K levels in the diets (quadratic contrasts for the KCl groups: P= 0·027, P= 0·008, P= 0·009 and P= 0·023). Comparable results were obtained for faecal Cl excretion, which depended on dietary K levels only in the KCl groups and reached its maximum at 0·50 % K levels in the diets (interaction: P= 0·025; linear contrast: P= 0·024 and quadratic contrast: P= 0·016).
The apparent digestibility of Ca was dependent on dietary K levels only in the KHCO3 groups (interaction: P= 0·047) and reached its maximum after the inclusion of 0·75 % K in the diets (quadratic contrast for the KHCO3 groups: P= 0·037).
The dependence of the apparent digestibility of P on dietary K levels was quite different in both the KCl and KHCO3 groups (interaction: P= 0·001). For the KCl groups, we observed a V-shaped pattern, whereas in the KHCO3 groups, the apparent digestibility of P increased between native and 0·75 % K levels in the diets and decreased between 0·75 and 1·00 % dietary K levels (quadratic contrasts: P= 0·005 and P= 0·022 for the KCl and KHCO3 groups, respectively). Comparable results were obtained for the apparent digestibility of Na, which was different in both the KCl and KHCO3 groups (interaction: P= 0·024). In the KCl groups, after a steep decline between native and 0·50 % dietary K levels, we observed a steady increase in the apparent digestibility of Na between 0·50 and 1·00 % K levels in the diets (quadratic contrast: P= 0·004). In the KHCO3 groups, a moderate increase between native and 0·75 % dietary K levels was observed, followed by a decrease between 0·75 and 1·00 % K levels in the diets (quadratic contrast: P= 0·042).
The apparent digestibility of Mg was affected by the dietary K concentration and dietary K salt (P for interaction = 0·007); however, the dependence of the apparent digestibility of Mg on dietary K levels did not reach significance for the KCl or KHCO3 groups.
In the KCl groups, the apparent digestibility of Cl decreased between native and 0·50 % dietary K levels and subsequently increased, whereas in the KHCO3 groups, an increase between native and 0·50 % K levels in the diets was followed by a small decrease (interaction: P= 0·002, linear and quadratic contrasts for the KCl groups: P= 0·014 and P= 0·013, respectively, and quadratic contrast for the KHCO3 groups: P= 0·015).
Mineral retention
No interaction between dietary K concentration and dietary K salt was observed for K retention in the cats (P= 0·640). The balance was markedly negative after feeding the cats with the basal diet ( − 197 mg/d) and the 0·50 % KCl diet ( − 131 mg/d). Feeding the cats with the 0·75 % KCl and 1·00 % KCl diets led to a better, but still negative balance, with values up to − 23·3 mg/d. The inclusion of 0·50 % KHCO3 in the diets also led to a negative K retention ( − 82·5 mg/d), but it became positive with the inclusion of 1·00 % KHCO3 (52·5 mg/d). Overall, an increase in the values of K retention was observed with higher dietary K levels; however, this increase was stronger after the inclusion of KHCO3 in the diets (P for salt = 0·018; linear contrast for K: P= 0·002).
Ca retention was consistently positive, with values between 50·4 and 259 mg/d. However, a dependence on dietary K levels could only be observed in the KHCO3 groups, where the curve had reached its maximum after the inclusion of 0·75 % K in the diets (interaction: P= 0·036; quadratic contrast for the KHCO3 groups: P= 0·025). The dependence of P retention on dietary K levels was quite different in both the KCl and KHCO3 groups (interaction: P= 0·005). The value of P retention was close to 0 after feeding the cats with the 0·50 % KCl diet, which was a marked decrease when compared with that observed after feeding the basal diet, where P retention of 126 mg/d was observed. However, the 0·75–1·00 % KCl diets led to an increase in P retention up to 163 mg/d (quadratic contrast: P= 0·001). In the KHCO3 groups, we found no significant dependence of P retention on K levels in the diets.
The interaction between dietary K salt and dietary K concentration was significant for Mg balance (P= 0·018). However, the dependence of Mg balance on K levels in the diets did not reach significance for the KCl or KHCO3 groups. The data obtained for Na retention indicated no dependence on the dietary K salt or dietary K concentration.
Calculated endogenous potassium losses
Based on the data obtained for daily K intake (mg/kg BW per d) and renal and faecal K excretion (mg/kg BW per d), the regression analysis was as follows: y= 0·475x+49·457 (renal K excretion) and y= 0·078x+4·098 (faecal K excretion). Therefore, the extrapolation to 0 indicates endogenous renal K losses of 49·5 mg/kg BW per d and endogenous faecal K losses of 4·1 mg/kg BW per d.
Blood parameters
No group differences were observed in the blood counts of the cats (data not shown). Although some group differences were detected for mineral concentrations in the blood (Table 6), these differences were only small, and all the blood parameters were within the normal range for cats.
Table 6 Mineral concentrations (mmol/l) in the blood of cats fed diets with different potassium concentrations* and salts (Mean values with their standard errors, n 8 per diet)
* Total concentrations of K in DM: 0·31 % and intended 0·50, 0·75 and 1·00 %.
† The interaction term drives the other contrasts as follows: when the interaction is not significant, only P values for linear and quadratic contrasts for K (main effect means averaged over K source) and the P value for salt are reported. When the interaction is significant, only P values for linear and quadratic contrasts for individual salts (KCl and KHCO3) are reported.
An interaction between dietary K salt and dietary K concentration was observed for Cl concentrations in the blood of the cats (P< 0·001). In both the KCl and KHCO3 groups, an increase in Cl concentrations was followed by a decrease, while the highest Cl concentrations were attained at 0·50 and 0·75 % dietary K levels added as KCl and KHCO3, respectively (linear contrasts: P< 0·001 (KCl groups) and P= 0·011 (KHCO3 groups); quadratic contrasts: P< 0·001 (KCl groups) and P= 0·001 (KHCO3 groups)). However, the total concentrations among all the groups varied between 108 and 121 mmol Cl/l, implicating a lower physiological relevance.
K concentrations in the blood depended on dietary K levels only in the KCl groups (interaction: P= 0·005). The curve exhibited a decline between native and 0·75 % dietary K levels and rose between 0·75 and 1·00 % K levels in the diets, slightly exceeding the level of native dietary K (quadratic contrast: P= 0·010).
Na levels in the blood of the cats depended on dietary K levels only in the KHCO3 groups (interaction: P< 0·001). In these groups, a slight increase was observed between native and 0·75 % dietary K levels, followed by a moderate decrease (linear and quadratic contrasts for the KHCO3 groups: P= 0·001 and P< 0·001, respectively). Ca concentrations in the blood exhibited only small variations (2·54–2·77 mmol/l). In both the KCl and KHCO3 groups, Ca concentrations in the blood rose between native and 0·75 % dietary K levels, peaked at 0·75 % K levels in the diets and declined subsequently (interaction: P= 0·235; quadratic contrast for K: P= 0·017). The data obtained for phosphate concentrations in the blood of the cats indicated no dependence on the dietary K salt or dietary K concentration (P>0·05).
Discussion
The initial consideration of the present study was that a different K intake from two sources, KCl and KHCO3, would affect renal K excretion, urine pH and urinary Ca concentrations. Except for urinary Ca concentrations, this assumption was confirmed by the results of the present study. The results have practical relevance, because so far the significance of dietary K has been studied in cats only rarely and different salts and their impacts on the metabolism have not been studied extensively.
An important background for the present study was provided by observations made in human subjects, which indicate that the K concentration in the diet affects renal Ca excretion( Reference Lemann, Pleuss and Gray 14 , Reference Lemann, Pleuss and Gray 15 ) and should, therefore, be considered as a risk factor for the formation of Ca-containing uroliths. Although some authors have suggested that this correlation also applies for cats( Reference Lekcharoensuk, Osborne and Lulich 2 ), to our knowledge, no detailed studies have been carried out to evaluate the impact of varying dietary K levels on the feline urine composition. It also seems important to consider the anion in the dietary K salt as a potential risk factor for the formation of uroliths, as the solubility of minerals is affected by the alkalisation or acidification of the urine( Reference Markwell, Buffington and Smith 21 ). The present study demonstrates that renal Ca excretion in cats is, contrary to that in humans, unaffected by dietary K levels. However, we observed a generally higher renal Ca excretion when K was added as KCl to the diets than as KHCO3 (P= 0·026). This finding is in accordance with data obtained from studies carried out in human subjects, where dietary KHCO3, but not KCl, decreased urinary Ca excretion( Reference Lemann, Pleuss and Gray 14 ). The authors of these studies suggest that the reduction in renal Ca excretion by generally higher dietary K levels may be mediated by a higher phosphate retention and an associated inhibition of calcitriol synthesis in the kidneys, which results in a lower intestinal Ca absorption( Reference Lemann, Pleuss and Gray 14 , Reference Lemann, Pleuss and Gray 15 ). It has also been suggested that a higher dietary K intake may lead to an enhanced Ca retention and an inhibition of bone resorption( Reference Lemann, Pleuss and Gray 15 ). In the present study, we observed marked higher P and Ca retentions in the KHCO3 groups than in the KCl groups up to a concentration of 0·75 % K in the diets, but not after the dietary inclusion of 1·00 % K as KHCO3. Therefore, the underlying mechanism that led to the lower renal Ca excretion in the KHCO3 groups compared with that in the KCl groups remains unclear and needs further evaluation. It should also be taken into consideration that urinary Ca concentrations were not significantly lower after the dietary inclusion of K as KHCO3. However, with respect to the prevention of CaOx urolith formation, the present results indicate that dietary KHCO3 would be more favourable than KCl, since there is an association with a generally lower renal Ca excretion.
The absent effect of dietary K levels on renal Ca excretion in cats is in contrast to the findings of studies carried out in human subjects( Reference Lemann, Pleuss and Gray 14 , Reference Lemann, Pleuss and Gray 15 ) and may possibly be explained by differences in their metabolism: in these studies( Reference Lemann, Pleuss and Gray 14 , Reference Lemann, Pleuss and Gray 15 ), it has been hypothesised that the lower renal Ca excretion, induced by higher dietary K levels, could be a result of a natriuretic effect of K, which leads to a decrease in the extracellular fluid volume. This volume contraction has been demonstrated to be associated with lower Ca excretion in humans, although the underlying mechanisms have not been fully clarified. In the present study, no diuretic effect was observed when the cats were fed diets containing increasing concentrations of KCl and KHCO3, but the urine volume was higher after the KCl diets were fed (P= 0·026), indicating an effect of Cl– as the non-metabolisable anion in the dietary K salt. A higher urine volume in combination with the observed unaffected urinary Ca concentrations can be considered to be beneficial for the prevention of CaOx urolith formation, although the total renal Ca excretion was higher in the KCl groups than in the KHCO3 groups.
Besides the impact of dietary K on urinary Ca excretion, some observed side effects may be particularly interesting in the context of the formation of CaOx stones in cats: as a low urine pH ( < 6·29) is considered to be a risk factor for the formation of CaOx uroliths( Reference Kirk, Ling and Franti 25 , Reference Osborne, Lulich and Thumchai 26 ), the alkalising effects of KHCO3 in the diets on urine pH should be noted. The inclusion of 0·50 % K as KCl in the diets led to a decrease in urine pH (fasting: 5·30; postprandial: 5·34) than when fed the basal diet with 0·31 % native K (fasting pH: 6·29; postprandial pH: 6·33), but higher levels of KCl led to an increase in urine pH. Although the fasting pH of 6·38 and the postprandial pH of 6·31 (1·00 % KCl diet) were still in the acidic range, dietary KCl had no dose-related acidifying effects on the urine. It was initially suggested that increasing levels of Cl in the diets would result in increased urinary Cl concentrations and, therefore, in a decrease in urine pH. In this context, it has to be taken into consideration that the present study design cannot provide data on renal Cl excretion. For the analysis of urinary cations and anions, the urine samples were acidified with hydrochloric acid. Thus, the measurement of urinary Cl concentrations could be falsified, even after subtraction of the added Cl. Therefore, only faecal Cl concentrations can be considered for an evaluation of the excretory mechanisms of dietary Cl. However, the results demonstrate that faecal Cl concentrations were not affected by dietary Cl concentrations, with mean values of 1·09–1·32 mg/g DM. Moreover, faecal Cl excretion increased initially after the inclusion of 0·50 % K as KCl in the diets than when fed the basal diet, but subsequently decreased with higher dietary KCl levels. It can, therefore, be assumed that renal Cl excretion increased with increasing levels of Cl in the KCl diets, as expected. The surprising increase in urine pH brought about by the higher levels of KCl in the diets, however, could be explained on the basis of the data obtained for K retention: when the cats were fed the basal diet with only 0·31 % K in DM, K retention was markedly negative with a value of − 197 mg/d. It can be hypothesised that the cats were in a K deficiency state, resulting in an intracellular influx of the available, intestinal absorbed K to maintain the water and electrolyte balance and a consecutively reduced renal excretion of K. In contrast, the basal diet contained 8·99 g Cl/kg DM, which is distinctly above the recommended allowance of 0·96 g/kg DM( 23 ). Therefore, excess Cl consumed with the feed may be renally excreted, resulting in the low urine pH. Feeding the cats with the 0·50 % KCl diet also resulted in a clearly negative K retention of − 131 mg/d, and a deficient supply with K can, therefore, be supposed. Thus, as in the case of the basal diet, the available K was probably transported into the cells and only at a low percentage renally excreted. As opposed to this, the Cl concentration in the diet was higher than that in the basal diet and therefore an increased renal Cl excretion can be assumed, resulting in a further decrease in urine pH. Both 0·75 % KCl and 1·00 % KCl diets led to a more balanced K retention, indicating that the cats received sufficient K, which resulted not only in the transport of K into the cells but also in an increased renal K excretion. Although Cl was still excreted into the urine in high amounts, it can be hypothesised that the increased renal excretion of K led to the small but measurable increase in urine pH.
The unavoidable net losses of K were about 54 mg/kg BW per d. As the demonstrated apparent digestibility of K was at an average of 86·7 %, a gross requirement of 62·3 mg K/kg BW per d can be assumed. Based on an average daily feed intake of 13·4 g DM/kg BW, the minimum of 4·65 g K/kg DM (with 16·1 MJ ME/kg DM) could be recommended for cat food, which is near to the actual recommendations of 5·2 g K/kg DM with 16·7 MJ ME/kg DM( 23 ) (≙5·0 g K/kg DM with 16·1 MJ ME/kg DM). In this context, the data obtained for K retention in the cats demonstrated that K from KHCO3 was more efficiently retained than K from KCl (P= 0·018). In particular, feeding the cats with the 0·75 % KHCO3 and 1·00 % KHCO3 diets led to a better or positive K balance ( − 37·6 and 52·5 mg/d) than feeding the KCl diets. This aspect may have practical relevance especially when using diets with low K concentrations, which could result in K deficiency in cats if K is added to the diets as KCl.
The increasing urinary K concentrations with increasing dietary K levels were accompanied by a decrease in urinary Na concentrations. This observation indicates that renal K excretion in cats is mediated by an exchange of Na in the kidneys, which has already been described in studies carried out in human subjects( Reference Field, Stanton and Giebisch 27 – Reference Woda, Bragin and Kleyman 29 ). The authors of these studies suggested that renal K secretion is mediated by a stimulation of the renal Na, K-ATPase, a higher tubular flow and an increased aldosterone secretion.
Urinary Ox concentrations were generally lower when the cats were fed the KCl diets than when fed the KHCO3 diets, and a dependence on dietary K levels could only be demonstrated for the KHCO3 groups. Urinary Ox concentrations increased with the inclusion of 0·50–0·75 % K as KHCO3 and moderately decreased after feeding the cats with the 1·00 % KHCO3 diet. However, these differences were less clear when comparing the daily renal Ox excretion among the groups. Based on the current knowledge, it remains unclear why the salt of dietary K affected the urinary Ox concentrations of the cats. In general, intestinal Ox absorption or endogenous Ox formation could have been modified. Considering that cat food normally contains only small amounts of Ox, the feline endogenous Ox synthesis is more relevant for the urinary Ox concentrations of cats. However, this aspect has only rarely been investigated in cats so far( Reference Dijcker, Plantinga and van Baal 1 ). Studies carried out in human subjects and rodents have demonstrated that endogenous Ox is mainly formed by metabolic conversions of sugars, amino acids and glycolate( Reference Dijcker, Plantinga and van Baal 1 ). In addition, pyridoxine is known to be a cofactor for the enzyme AGT1( Reference Takada, Mori and Noguchi 30 ), which catalyses the transamination of glyoxylate to glycine. Considering that glyoxylate is a precursor of Ox, pyridoxine deficiency can indirectly enhance endogenous Ox synthesis and consecutively urinary Ox excretion. This relationship has already been demonstrated in kittens( Reference Bai, Sampson and Morris 31 , Reference Bai, Sampson and Morris 32 ). Moreover, pyridoxine is a cofactor for several enzymes, which are important for the synthesis of citrate. Thus, pyridoxine deficiency can lead to reduced urinary citrate concentrations and therefore to a higher risk of CaOx precipitation( Reference Teerajetgul, Hossain and Yamakawa 33 ). Furthermore, ascorbate has been identified to increase urinary Ox concentrations in human subjects( Reference Auer, Auer and Rodgers 34 – Reference Moyad, Combs and Crowley 38 ). The underlying mechanism is a non-enzymatic oxidation of ascorbate to Ox, which is accelerated when the urine is alkaline. Although ascorbate has not been demonstrated to be an important precursor for the formation of Ox in cats( Reference Yu and Gross 39 ), the observed higher urinary Ox concentrations in the present study were associated with a higher urine pH when the cats were fed the KHCO3 diets than when fed the KCl diets. Therefore, it might be that the alkaline urine pH led to an accelerated breakdown of ascorbate to Ox in the urine. This hypothesis is supported by the fact that none of the other mentioned relevant factors influencing endogenous Ox synthesis (sugars, amino acids, glycolate and pyridoxine) differed between the present experimental diets. Based on practical relevance, it can be concluded that a high urine pH, as observed after the dietary inclusion of increasing KHCO3 levels, is accompanied by higher urinary Ox concentrations than after feeding the basal or KCl diets, which could be considered as an antagonistic effect in the prevention of CaOx urolith formation. However, it has been assumed that CaOx precipitation is reduced in an alkaline urine, possibly mediated by an increase in the activity of crystallisation inhibitors such as citrate and chondroitin sulphate( Reference Tiselius 40 ). In general, a higher urine pH stimulates renal citrate excretion( Reference Dijcker, Plantinga and van Baal 1 ), which could be confirmed by the present results. Thus, the demonstrated increase in urinary Ox concentrations with higher levels of KHCO3 in the diets than when fed the basal and KCl diets seems to be of subordinate importance in the context of the formation of CaOx uroliths, while the observed increase in urine pH could have a greater significance as a preventive factor.
Mineral concentrations in the faeces of the cats as well as the measured blood parameters were not or only sparsely affected by the varying K concentrations or K salts in the diets. Therefore, it can be concluded that dietary K especially affects the urine composition in cats, indicating that K homeostasis is mainly regulated by the kidneys. In the context of the prevention of CaOx stone formation in cats, the present results indicate that the dietary inclusion of KHCO3 might be more favourable than that of KCl as K source, since there is an association between a generally higher urine pH and a lower renal Ca excretion. Unlike in humans, no correlation between dietary K levels and urinary Ca excretion was observed in cats. The present data can further confirm the actual recommendations for dietary K concentrations in cat food; however, when added as KCl, the utilisation of K is obviously restricted and could result in a K deficiency in case of marginal K levels in a diet.
Acknowledgements
The present study did not receive any specific funding.
The authors would like to thank Professor Barbara Kohn, Clinic of Small Animals, Freie Universität Berlin, for the analysis of the blood samples.
The authors' contributions are as follows: N. P., T. B. and J. Z. designed and organised the study; N. P. carried out the analysis of urine and faecal samples and wrote the manuscript; N. P. and K. N. carried out the data analysis; J. Z. revised the manuscript.
None of the authors has any conflicts of interest.


