


Introduction
Sea-ice fields are dynamic elements on the surface of freezing seas. In particular, the free boundary of a sea-ice field - the ice edge - shows dynamically and thermally forced large variability. Owing to ice drift, the ice edge may be displaced by as much as 10kmd−1 (e.g. Lepparanta, 2011). On a calm sea surface the freezing front may progress at a similar rate, as often observed in the Baltic Sea. The location of the ice edge in a given sea area is of interest, both for scientific applications, such as weather and ice forecasting, and due to practical needs, such as navigation and fishery interests.
The Institute of Low Temperature Science, Hokkaido University, Japan, has operated radar systems on the northern coast of Hokkaido to monitor the coastal sea zone. In 1969 an operative C-band sea-ice radar (SIR) network was established for continuous monitoring of the sea-ice conditions (Reference Tabata and KarlssonTabata, 1972, Reference Tabata1975). An extensive validation programme was performed at the time of the system start-up, and later an automatic binary classification system (ice/no ice) was developed. The annual sea-ice coverage as observed by the SIR network showed a negative trend through the observation period (1969–2004) as similarly indicated by visual observations (Reference ShirasawaShirasawa, 1998). The trend of the seasonal ice concentration integral obtained from the SIR data has been ∼12 days(10 a)−1 (Reference Ishikawa, Takatsuka and ShirasawaIshikawa and others, 2005).
The SIR system provides information on ice concentration, ice kinematics and ice-edge dynamics, which is required by the local communities along the northern coast of Hokkaido. Economic and everyday life is dependent on sea-ice conditions. Fishery and marine transport are closed during the ice season. Since the 1990s, sea ice has been a major tourist attraction, with sea-ice observation towers and icebreaker sightseeing cruises in Mombetsu and Abashiri (http://www.bfh.jp/en/theme/theme_searchdetail/80020614901/). Thus real-time knowledge of the location of the ice edge is critically important.
In 2004 the SIR network was closed down because of difficulties in maintaining the old-fashioned radar system after 35 years of operation. In the same year, a sea surface monitoring programme was commenced using coastal high-frequency (HF) radar, which provides information on surface currents in open-water conditions (Reference EbuchiEbuchi and others, 2006). An interesting question was then raised as to whether the HF radar could provide any information on the ice situation, compensating to some degree for the closure of the SIR system. The present work approaches this question using the data from winter 2004. This is the only ice season for which data are available from both radars. HF radar senses the ice in a negative way, i.e. no signal is obtained from ice areas, but this is enough for the construction of the ice edge. The results given below show that HF radar information can be utilized for ice-edge mapping, although it cannot compensate fully for the SIR system.
Material and Methods
Ice in the Sea of Okhotsk
Freezing in the Sea of Okhotsk normally begins in late November in the north. The maximum ice extent occurs in mid-March (Fig. 1). The ice then retreats, disappearing by the beginning of June. The mean maximum annual thickness of landfast ice varies regionally between 30 and 150 cm. On the northern coast of Hokkaido the ice season is only 3–4 months, from January to April. Hokkaido ice comes mostly from the Sakhalin region to the north, transported by ocean currents, but there is also some local ice production. Offshore of Hokkaido, the Soya Warm Current comes from the Sea of Japan and flows east along the northern coast, and tidal currents are strong. The ice conditions near Hokkaido are therefore highly variable. At times drift ice comes close to shore, at other times it drifts out of visual range from the shore. The ice edge is dynamic due to winds, strong current systems and tides (Reference Tabata, Kawamura, Aota and PritchardTabata and others, 1980).

Fig. 1. Ice conditions in the Sea of Okhotsk on 10 February 2004 seen on a Moderate Resolution Imaging Spectroradiometer (MODIS) image of NASA’s Terra satellite.
Ice conditions offshore of Hokkaido have been monitored for more than 100 years. Observations of the dates of freezing and ice break-up were started in 1892 by the Abashiri Observatory. Daily visual observations of ice concentration within ∼20km of the coastline have been carried out since 1930 (Reference Aota, Ishikawa, Murai and HirataAota and others, 1993). The SIR system was operational during 1969–2004, monitoring the ice along the entire northern coast of Hokkaido (Reference Tabata and KarlssonTabata, 1972; Reference ShirasawaShirasawa, 1998). In August 2003, an HF radar system was opened for mapping the coastal currents offshore of the Hokkaido northern coast. It was not designed for ice observations; however, it can be used to obtain indirect ice information. For comparative investigations, there is one overlapping winter in the data available from the two radar systems.
SIR system
Marine radars have been routine tools in sea-ice mapping since the late 1960s (e.g. Reference Haykin, Lewis, Raney and RossiterHaykin and others, 1994). Ship radars and fixed coastal radars have been used in sea-ice navigation and in remote sensing (Reference Tabata and KarlssonTabata, 1972, Reference Tabata1975; Reference Leppäranta and PalosuoLeppäranta and Palosuo, 1983; Reference Karvonen, Heiler and HaapalaKarvonen and others, 2010). The feasibility of marine radars is based on the typically strong backscatter contrast between sea ice and open-water surfaces and consequently the ice extent and concentration can be fairly well observed. Also, there are recurring features (e.g. ice ridges) which show up repeatedly in radar imagery and allow monitoring of ice kinematics. The advantage of marine radars over satellite radars (e.g. Reference Haykin, Lewis, Raney and RossiterHaykin and others, 1994; Reference Leppäranta and Sun Yand HaapalaLeppäranta and others, 1998) is that their temporal resolution can be made arbitrarily small, although spatial coverage is limited.
The Hokkaido SIR network was based on three radar stations located on hilltops at altitudes of 200–440 m overlooking the coast in Esashi (44849′ N, 142°37′ E), Mombetsu (44°21′ N, 143°19′ E) and Abashiri (44806′ N, 144°15′ E). The system was capable of mapping the sea surface up to 60 km offshore along a 250 km section of coastline off the northern coast of Hokkaido. The SIR characteristics are summarized in Table 1. The radars operated at C-band (wavelength 5.4 cm) with a maximum power output of 40 kW, a beamwidth of 18 horizontal and 38 vertical and a pulse width of 1 ms. They were controlled remotely from the Sea Ice Research Laboratory of Hokkaido University, Mombetsu, where the data from the radar stations were assembled via telemetry. From winter 2004 the Abashiri SIR system was no longer active.
Table 1. Specification of the SIRs in Esashi and Mombetsu
Time series of the daily ice distribution observed by the SIR network at 09:00 JST (Japan Standard Time = GMT + 9 hours) along with total ice concentration (defined as the ratio of ice area to the coverage of the composite radar imagery) during the whole sea-ice season have been archived since 1969. In addition, SIR images were taken at 3 hour intervals throughout the whole sea-ice season for further studies of coastal sea-ice dynamics and movements. Figure 2 shows the locations of the SIR stations together with an example of the sea-ice distribution off the coast of Hokkaido in the study winter. The radar data are from Esashi and Mombetsu stations. Sea-ice patches can be identified due to their geometrical structures, while open-water patches appear as a smooth grey tone. Thus, next to the shoreline, large areas of open water are seen and in the central area there are ice bands. The ice edge is sharp and can be clearly identified in the radar images, as well as some dark spots of open water within the ice pack.
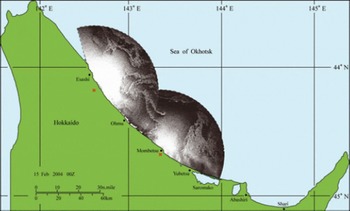
Fig. 2. Sea-ice distribution off the Okhotsk Sea coast of Hokkaido at 09:00 JST on 15 February 2004, as seen by the Esashi and Mombetsu SIR. The red crosses show the locations of the radar antennas. Also shown are the locations of the Abashiri radar station (inactive in 2004) and the HF radar stations (Ohmu and Mombetsu).
HF radar
HF radar, also called coastal radar (CODAR), is based on a vertically polarized signal, which is propagated above the electrically conductive ocean water surface and can travel beyond the line of sight. The frequencies are of the order of 25 MHz (or 12 m wavelength). Ocean surface waves have wide spectra, and when the HF radar signal hits 3–50 m long waves the signal scatters in many directions. It scatters back to the source from an ocean wave, which is travelling in a radial path either directly away from or towards the radar and has a wavelength exactly half of the transmitted radar wavelength. The scattered radar waves add coherently, resulting in a strong return of energy at a very precise wavelength. The returning signal exhibits a Doppler frequency shift, which provides the radial surface current velocity once the theoretical ocean wave speed has been subtracted. What makes HF radar particularly useful for current mapping is that the ocean waves associated with HF wavelengths are always present. Since HF radars provide radial velocities, two radar stations at different locations are needed to obtain 2-D sea surface currents.
A SeaSonde HF radar system (Reference Barrick, Evans and WeberBarrick and others, 1977; Reference EbuchiEbuchi and others, 2006), manufactured by CODAR Ocean Sensors Ltd, has been operated for mapping of the coastal currents on the northern coastal zone of Hokkaido since August 2003. The HF radar network extended from the Soya Strait east along the northern coast of Hokkaido. For this study, the HF radar data from the Ohmu and Mombetsu sites are used from winter 2004 (Fig. 2). The frequency of these HF radars was 24.5 MHz (12.2m wavelength), with 1.5 km spatial resolution and 40–45km observation range (Table 2). The observation time interval was 1 hour.
Table 2. Specification of the HF radar system of the Mombetsu and Ohmu stations
The HF radar method does not work in sea-ice conditions due to strong attenuation of the radar signal over low-conducting sea-ice fields (Reference Gurgel, Essen and KingsleyGurgel and others, 1999). Also, ocean waves, especially short waves, are effectively dampened by sea ice (e.g. Reference Squire, Dugan, Wadhams, Rottier and LiuSquire and others, 1995). Therefore receiving no signal from a gridcell means the presence of sea ice. Using HF radar in this way for sea-ice mapping corresponds to the use of marine radar in that a binary open-water/ice map can be constructed within the range of the radar, but in the case of marine radar the strength of the scattered signal bears additional information about the character of the ice.
Data analysis
The basic assumption is that SIR provides the correct ice-edge information. This is motivated by more than 30 years of experience in the region, with an advanced ice-detection algorithm developed over several years (e.g. Reference Aota, Oi, Ishikawa and FukushiAota and others, 1985). HF radar is a new instrument for this problem, and its ice-edge location is validated against the ice edge detected by SIR.
To evaluate the feasibility of HF radar for ice mapping, two factors are of interest. First, we must determine whether HF radar recognizes the ice edge. The first type of error appears if HF radar receives no signal although there is no ice, and the second type of error appears if HF radar receives a signal although there is ice. We need to examine these conditional error probabilities. Which type of error is more critical depends on the application of the ice-edge information. For fishing and shipping, the first error is critical when ice needs to be avoided, but for tourism associated with observation of sea ice the second error is critical.
Second, if HF radar is able to detect the ice edge, the question is how well the distance to the ice edge can be determined. HF radar provides the return signal from pixels along radial lines, and, taking the ‘no return’ pixels as ice, it is possible to construct the function
where
![]() is the distance to the nearest ice edge estimated by HF radar, 9
m
is the line direction and tn
is the observation time. The nearest ice edge has the greatest practical interest here. From the continuous SIR imagery it is possible to sample line information for the assumed actual distances to the ice edge (Fig. 3), ℓ = ℓ(0
m, tn
). The error of the HF radar ice-edge estimator is thus
is the distance to the nearest ice edge estimated by HF radar, 9
m
is the line direction and tn
is the observation time. The nearest ice edge has the greatest practical interest here. From the continuous SIR imagery it is possible to sample line information for the assumed actual distances to the ice edge (Fig. 3), ℓ = ℓ(0
m, tn
). The error of the HF radar ice-edge estimator is thus

Fig. 3. Sea-ice distribution off the Okhotsk Sea coast of Hokkaido at 09:00 JST on 15 February 2004: interpretation for ice (white) and open water (grey) from Mombetsu and Esashi SIR images. Also shown is the coverage of the Esashi and Mombetsu SIRs (red circles) and the Mombetsu HF radar (blue circles) with study lines for the radar data comparison (blue lines). Ohmu HF radar circles and lines will be similar to those for the Mombetsu radar.
The number of observation days was 51 (from 21 January to 11 March 2004), and, for each day, three HF radar lines were taken from Mombetsu and Ohmu data and compared with the radar imagery. The total number of lines was thus 51 × 2 × 3 = 306. Denser spatial or temporal sampling would not provide much more additional independent statistical information.
Results
Ice conditions in winter 2004
The ice season of 2004 was mild in the Sea of Okhotsk. Ice conditions in the southern part are shown in Figure 1 on a Moderate Resolution Imaging Spectroradiometer (MODIS) image. Ice floes are drifting south from Sakhalin, and the northern coast of Hokkaido is largely open, as also shown by the SIR picture 4 days later (Fig. 2). In the SIR coverage of the Esashi and Mombetsu stations this was one of the mildest sea-ice seasons since 1969 (Reference Ishikawa, Takatsuka and ShirasawaIshikawa and others, 2005). Drift ice appeared off the northern coast of Hokkaido within the coverage of the Esashi SIR for the first time in this winter on 17 January 2004. Sea-ice cover further expanded towards the southeast along the coast of Hokkaido. Ice concentration reached as much as 90–100% by mid-February, remained high until the end of February and then decreased, with ice disappearing completely from the radar coverage by 13 March 2004.
Figure 3 shows a binary ice/open-water map produced from the SIR data for 15 February 2004. The original SIR image is shown in Figure 2. This image provides a detailed geometrical picture of the distribution of ice in a sector up to 60 km from the station. This figure also shows the coverage of the three SIRs and the three comparison lines for the Mombetsu SIR and HF radar: north (N), northeast and east (E). Similar comparison lines were also taken for the Ohmu HF radar (not shown) overlapping both the Mombetsu and Esashi SIRs. Figure 4 shows the output from the Mombetsu HF radar from the same day. It is seen that the HF radar picks up the ice patches shown in the SIR picture quite well. Comparison with Figure 4 shows how the ice cover masks out HF radar signals.

Fig. 4. Mombetsu HF radar signals on 15 February 2004: interpretation for ice (filled circles) and open water (open circles). Radar pixels with no signal return are those interpreted as ice pixels.
Statistics
An example of SIR–HF radar data pairs for Mombetsu station is shown in Figures 3 and 4. In this case most of the ice is towards the east and is shown similarly by both radars. Since both systems measure along lines from the radar antenna, there is no reason to obtain directionally dependent results. Therefore the whole dataset can be put together, all distance pairs as independent cases, for the statistical analyses.
The number of lines with data from both radars was 306. SIR showed ice-edge presence in 209 cases, while there were 240 identifications with the HF radar. If the HF radar gives an ice edge, the probability that it is true is 191/240=0.88; if it gives no ice edge, the probability that it is true is 48/66=0.73. The number of true cases follows the binomial distribution and the accuracy of the probability estimates is 0.025. The conditional probabilities can be shown in the matrix:
Thus, whether there is an ice edge or not can be identified with good confidence by the HF radar. As is seen, the probabilities are not symmetric. Ice-edge detection by HF radar is reliable, while suggesting the absence of ice edge is less certain.
The location of the ice edge as the distance from the radar antenna was then examined for both radars (Table 3). The mean distances to different directions were within 12–18 km in the SIR data, and the overall mean error of the HF radar was d=–0.3km. The standard deviations were 10–14km and their differences between the radars were from –1.2km to 1.9 km. The distance error of the HF radar is not significantly different from zero. The correlation coefficients of the radar readings were 0.63–0.78 except in the Mombetsu east direction (0.45).
Table 3. The statistics of the distance (km) of the ice edge from the HF radar and SIR stations in Mombetsu and Ohmu. The line directions N, NE and E are shown separately
Thus we can conclude that HF radar detects ice edge with a probability of 0.9. When there is ice, the obtained distance to the ice edge is an unbiased estimator of the target,
![]() , with a correlation coefficient of 0.7.
, with a correlation coefficient of 0.7.
Time series
Time series of ice-edge detection give a clear illustration by which to compare the two radars. Figure 5 shows the cases with the highest and lowest correlations, respectively, i.e. the lines Mombetsu north and Mombetsu east. For Mombetsu north the agreement between the two radars is good. For the first 11 days there were large differences, but thereafter the dynamics of the ice edge was picked up similarly by both radars; only on days 19 and 49–50 were there larger differences. It is shown below that the large differences are due to low ice concentration, where it is uncertain whether HF radar will receive a signal or not. Also in the lower-correlation case, Mombetsu east, the radars gave comparable signals. There were large differences in the beginning and at the end of the ice season, but otherwise only on days 22–26 was a large difference observed. The time-series result thus supports the results based on the overall statistics in the previous subsection and shows that the two radars detect the ice edge in a similar way. Occasional deviations from the good correlation are examined further below.
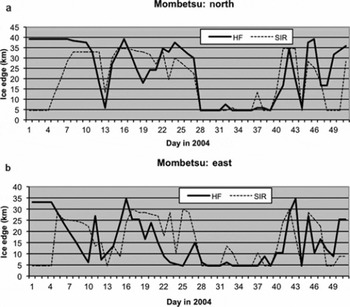
Fig. 5. Time series of distance from the radar antenna to the ice edge for the lines (a) Mombetsu north and (b) Mombetsu east as detected by HF radar and SIR. The missing values have been interpolated. Day 1 is 21 January 2004.
It seems plausible that the difference in the radar detection, or the error of the HF radar as we consider SIR to be correct, depends on the sea-ice concentration. HF radar may receive signal from a low-concentration ice field and interpret it as open water. Figure 6 shows the time series of ice concentration and ice-edge detection error together. As expected, when the ice concentration is low the error is large. When the ice concentration is large, the HF radar can map leads or coastal polynyas and their sizes well, while in low ice concentration the situation is difficult. In applying HF radar for sea-ice charting, indirect general knowledge of prevailing ice concentration therefore significantly increases the probability and accuracy of ice-edge detection. Such general knowledge can be obtained from operational satellite data or from the historical record.
Fig. 6. Ice concentration (%) and the error of the distance to the ice edge (km) determined by HF radar in Mombetsu in 2004. Day 1 is 21 January 2004.
Conclusions
In 1969 an operative C-band SIR network was established for continuous monitoring of sea-ice conditions off the northern coast of Hokkaido (Reference Tabata and KarlssonTabata, 1972, Reference Tabata1975). The system was based on three radar stations, which were capable of continuously monitoring the sea surface as far as 60 km offshore along a 250 km long coastal section. In August 2004 the radar system was closed down, while in July 2003 a sea surface monitoring programme was commenced using coastal HF radar, which provides information on surface currents in open-water conditions (Reference EbuchiEbuchi and others, 2006).
A question was raised as to whether HF radar can provide information about the ice situation and therefore compensate to some degree for the loss of the SIR system. It is assumed that SIR gives the correct ice situation based on its use for over 35 years. The present work has approached this question with the data from winter 2004, the only season for which there are data available from both radars. The HF radar senses the ice in a negative way: no signal is obtained. But this is enough for the construction of the ice edge to evaluate how well the HF radar provides the ice edge and how the HF data should be used for ice-edge tracking. The results show that HF radar information can be utilized for ice-edge mapping, although it cannot compensate fully for the loss of the SIR system. The probability of detecting the ice edge by HF radar is 0.9 and the distance estimate is unbiased, with a correlation coefficient of 0.7. Larger uncertainties appear in low ice concentration. Combined with drifters on ice, HF radar will be a highly interesting tool to map ice drift and surface currents together.
The location of drift ice is of great interest to people living in coastal areas, in particular because of fishery interests. Also, in Mombetsu and Abashiri, where tourists are taken into drift ice fields by small icebreakers, it is important to know how far the ice edge is from the coast and where it is accessible by the cruises. Near-real-time information with high temporal resolution provided by a land-based radar system is most important for local-scale practical applications. Satellites have low time resolution, and also optical and infrared windows are weather-dependent.
Acknowledgements
This work is part of the Japanese–Finnish Cooperative Program ‘Ice climatology in the Okhotsk and Baltic Seas’, supported by a grant-in-aid from the Japanese Ministry of Education, Culture, Sport, Science and Technology, the Japan Society for the Promotion of Science, and the Academy of Finland. Additional support was provided to Matti Leppäranta by the project ‘Mesoscale dynamic–thermodynamic modelling of sea-ice’ (#122412) funded by the Academy of Finland.


