


Introduction
Undernutrition among mother and children remains one of the main public health challenges of the 21st century, particularly in low- and middle-income countries (Victora et al., Reference Victora, De Onis, Hallal, Blossner and Shrimpton2010). A review of the Millennium Development Goals pointed out that nutrition was not focused upon appropriately (Horton & Lo, Reference Horton and Lo2013). It now occupies a prominent place in the Sustainable Development Goals (SDGs) for 2015–2030 recently approved by the international community. Despite progress, improvements in nutrition still represent a massive unfinished agenda (Black et al., Reference Black, Alderman, Bhutta, Gillespie, Haddad and Horton2013). The overall findings are that 165 million children had stunted growth in 2011, and almost 3.1 million under-five children are dying each year from undernutrition; that is a staggering 45% of total child deaths in 2011 (Black et al., Reference Black, Alderman, Bhutta, Gillespie, Haddad and Horton2013).
The causes of malnutrition are directly related to inadequate dietary intake as well as disease, though many factors contribute to the indirect causes. While most nutrition interventions are delivered through the health sector, non-health interventions can also be crucial. Availability of, and access to, sufficient nutritious food produced in the agricultural sector at the national and household level are among such factors. Agricultural growth and the diversity of food production and consumption thus assume importance as drivers of progress on the nutrition front.
Over the last three decades, technological progress has been the prime mover of the production of food grains globally – particularly the staple foods rice, wheat and maize. However, improved technologies have been developed, mostly for favourable ecologies characterized by good water control with irrigation and drainage facilities (Ruben et al., Reference Ruben, Pender and Kuyvenhoven2007). Particularly in Bangladesh, technological progress has reached its limit for these ecologies; as a result the rate of growth in production and productivity of food has slowed down in recent years (Hossain, Reference Hossain2007). Although research is in progress, scientists have not been able to develop appropriate technologies for fragile environments such as areas prone to drought and floods or salinity-affected coastal areas. As a result, marginality and ecosystems are now emerging as important development issues (Dasgupta & Mailer, Reference Dasgupta and Mailer1994; Duraiappah, Reference Duraiappah1998; Krugman, Reference Krugman1999). Such differential technological progress across agro-ecologies may have affected the production and availability of staple food, which in turn may lead to poverty and malnutrition.
The spatial distribution of poverty in Bangladesh shows that poverty is concentrated in ecologically unfavourable areas (Chowdhury & Christa, Reference Chowdhury and Christa2014). Recently, the issue of spatial distribution of undernutrition has emerged as a matter of concern as well, considering the growing evidence for a strong persistence of existing inequalities (Bredenkamp et al., Reference Bredenkamp, Buisman and Van De Poel2014). Therefore, whether ecological differences have affected nutritional outcomes is becoming an important issue for research.
Seasonal fluctuation in nutritional status is another important factor influencing poverty and the growth and well-being of children. Seasonality refers to any regular pattern or variation that is correlated with the seasons (Devereux et al., Reference Devereux, Sabates-Wheeler and Longhurst2012). Seasonality manifests itself in multiple dimensions of livelihoods such as employment of workers, food availability, prices, health and access to services, which affect livelihood opportunities and options (Zug, Reference Zug2006). People adopt different strategies such as migration and access to credit to augment income and consumption during slack seasons. Seasonality is significantly related to food insecurity, with pre-harvest times being accompanied by food shortages. In Bangladesh, this situation is described as monga, and is widely prevalent in the north-western districts in areas adjacent to the rivers Jamuna and Teesta (Zug, Reference Zug2006)
The objectives of this study were to understand whether spatial and seasonal variations in food production/availability affect maternal and childhood undernutrition in Bangladesh. Other proximate drivers of nutrition, such as socioeconomic factors and non-food environments, were taken into consideration to separate the effects of agro-ecology and food seasonality. The null hypothesis of whether agricultural and household incomes are the same across different production environments was tested, and an in-depth analysis of the effect of unfavourable ecologies on maternal and child malnutrition was carried out.
Methods
Agricultural performance across agro-ecologies
In order to test the hypothesis that agricultural and household incomes are affected by adverse agro-ecologies, the study used a longitudinal data set available for a nationally representative sample. These surveys were planned and implemented by one of the authors of this study. The initial sample was drawn in 1987 for a study of the impact of the Green Revolution in Bangladesh and its impact on favourable and unfavourable environments (Hossain, Reference Hossain1998). The sample was drawn using a multistage random sampling method. In the first stage, 64 unions (Bangladesh has 64 districts) were selected randomly from a list of all unions (local government units) of the country. In the second stage, one village was selected from each union, such that the village had characteristics most representative of the particular union. A census of all households was conducted, and proportionate random samples of 20 households were drawn from each stratum classified by land ownership and sources of income. The survey was repeated for the same villages and households in 2000, 2004, 2008 and 2014 to generate panel data to assess the changes in rural livelihoods over a long period of time and other relevant issues such as impact of rice research on poverty reduction, poverty mapping and the impact of commodity price spikes on rural poverty (Hossain, Reference Hossain2004; Hossain & Bayes, Reference Hossain and Bayes2009; Balagtas et al., Reference Balagtas, Bhandari, Cabrera, Mohanty and Hossain2014). In 2000 and 2014, the sample was re-drawn with 30 and 40 households, respectively, to make the sample representative for those years. The households were classified using the wealth-ranking method.
In order to assess agricultural performance across production environments, the sample households were divided into three ecosystem groups: a) flood-prone areas, b) salinity-affected coastal areas and c) favourable areas (as control) (Fig. 1). The flood-prone environment includes villages that are flooded every year because of overflowing of the adjacent major rivers as well as the depressed basins where crop farming is not possible during the monsoon season (June to November) as they remain under water for more than 6 months of the year. The coastal ecosystem covers villages where rivers and canals are subjected to tidal surges from the sea and the area is affected by water and soil salinity during the dry season. The favourable ecosystem includes all other villages in the sample. Household income and its components were compared across the ecosystems. A multiple regression model was estimated using the usual determinants of income, and the fragile environments were included as dummy variables to separate out the effect of fragility on household income. The model was estimated by the ‘Robust’ method using the software Stata. The regression model was as follows:
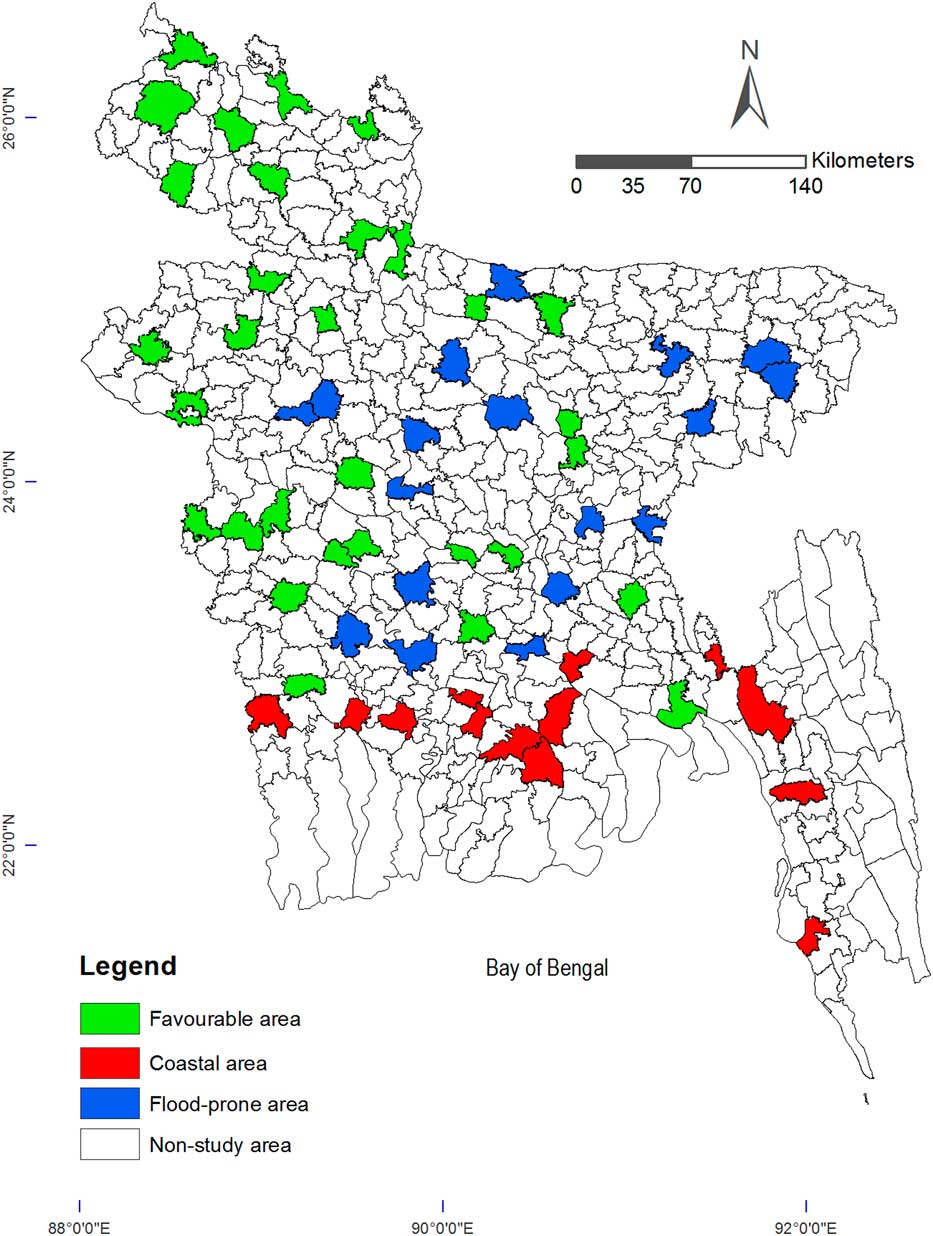
Fig. 1 Map of the different agro-ecological zones of Bangladesh. Cartography: Ratnajit Saha.
INCHH=f(OLND, RLND, AGCPTL NAGCPTL, MEARN, FEARN, MSCL, FSCL, FHHH, LREM, FREM, ELC, FLD, SCST)
Where INCHH=household income (in US$), OLND=owned land (ha), RLND=rented land (ha), AGCPTL=agricultural capital (in US$), NAGCPTL=non-agricultural capital (in US$), MEARN=number of male earners, FEARN=number of female earners, MSCL=schooling of male workers (years), FSCL=schooling of female workers (years), FHHH=female-headed household (dummy: yes=1, no=0), LREM=receiving remittance from domestic migrants (dummy: yes=1, no=0), FREM=receiving remittance from overseas migrants (dummy: yes=1, no=0), ELC=have access to electricity (dummy; yes=1, no=0), FLD=flood-prone ecosystem (dummy, flood prone=1), SCST=saline coast (dummy, saline coast=1).
Nutritional status and independent variables
The nutrition aspect of the paper is based on data generated by the Food Security Nutrition Surveillance Project (FSNSP) implemented by the Helen Keller International (HKI) and the James P. Grant School of Public Health (JPGSPH) of BRAC University, in partnership with the Bangladesh Bureau of Statistics. The project started generating data from 2010 and was planned to continue to 2015. Every year FSNSP conducts three rounds of data collection from six distinct agro-ecological zones, in addition to acquiring samples from the remaining areas of the country. The FSNSP data are available for the years 2010, 2011 and 2012. The FSNSP 2010 variables are different from FSNSP 2011 and 2012; hence this study only included analysis of data from FSNSP 2011 and 2012.
The nutritional status of mothers and children was assessed using several anthropometric indicators. The two key anthropometric measures for children were weight-for-height and height-for-age. These measures were expressed in the form of Z-scores – WHZ (weight-for-height) and HAZ (height-for-age) – generated by using the software ‘WHO Anthro’. The usual Z-score cut-off of −3.00 SD was used to classify a child as severely wasted or stunted and −2.00 SD as wasted or stunted. To assess maternal nutritional status, body mass index (BMI) was calculated and graded into six groups of chronic energy deficiency (CED): grade III (<16.00), grade II (16.00–16.99), grade I (17.00–18.49), normal (18.50–24.99), pre-obese (25.00–29.99) and obese (≥30.00), using the international WHO cut-offs (WHO, 2000). Six further categories of BMI were also used, according to international Asian cut-offs, where the CED levels were similar to WHO cut-offs, but the ranges for normal and pre-obese were lowered to 18.50–22.99 and 23.00–27.49, respectively (WHO Expert Consultation, 2004).
From the FSNSP 2011 and 2012 data, households with children under the age of five were included. Children and mothers without data on height, weight, age or sex were excluded. Anthropometric measurements of above or below four standard deviations from the mean for the mothers were considered as outliers and so excluded from the analysis (Nestel et al., Reference Nestel, Mascie-Taylor, Mohamed and Amin1991). For Z-scores, the cut-offs recommended by WHO for data exclusion were used; thus, data were excluded if a child’s HAZ was below –6 or above +6, and WHZ was below –5 or above +5, because these extreme values are most likely a result of errors in measurement or data entry (WHO Multicentre Growth Reference Study Group, 2006). Lastly, those children and women for whom information on the selected socioeconomic and demographic variables of the study was lacking were excluded. Ultimately, a total of 17, 712 mother–child pairs, whose records were complete in the required individual- and household-level variables, were included in the analysis.
The key variables of interest were food seasonality and geographical location. In the data set, three rounds of data collection represented food seasonality, which were divided into three categories: a) post-Aman harvest period (January–April), b) height of the monsoon (May–August) and c) post-Aus harvest season (September–December), where Aman and Aus are two popular and chiefly cultivated varieties of rice in Bangladesh.
The months of birth of children were analysed as individual month variables and categorized into three ‘birth season’ variables as: a) January–April (post-Aman harvest), b) May–August (monsoon) and c) September–December (post-Aus harvest).
To assess regional inequality, data were collected from different agro-ecological locations in the FSNSP, namely: coastal belt, eastern hills, Sylhet Haor Basin and flood plains (active lower, active upper and north-west). These categorizations were based on factors such as tendency to natural disasters, distribution and quality of land, access to education and health facilities, level of infrastructure development and employment opportunities. Role of dietary diversity and a household’s food security level were also assessed, with dietary information of the household taken into account for the previous 24-hour period. Foods were categorized into nine groups, i.e. grains, meat, fish, milk, eggs, vegetables, dals (legumes), green leafy vegetables and fruits (vitamin A-rich and other). Households consuming fewer than five groups were considered as ‘low diversity groups’ and the others as ‘high diversity groups’. The Household Food Insecurity Access Scale (HFIAS) was constructed using the guideline proposed by Coates et al. (Reference Coates, Swindale and Bilinsky2007). The HFIAS is a brief survey instrument developed by Food and Nutrition Technical Assistance (FANTA) to assess whether households have experienced problems accessing food during the last 30 days. The HFIAS poses questions of increasing concerns on food security domains, such as anxiety over food, insufficient dietary quality and the quantity of food available. A food-secure household experiences none of the food insecurity (access) conditions, or just experiences worry, even that rarely. A mildly food-insecure (access) household worries about not having enough food sometimes or often, and/or is unable to eat preferred foods, and/or eats a more monotonous diet than desired and/or some foods considered undesirable, but only rarely. However, it does not cut back on quantity or experience any of the three most severe conditions (running out of food, going to bed hungry or going a whole day and night without eating). A moderately food-insecure household sacrifices quality more frequently – by eating a monotonous diet or undesirable foods sometimes or often, and/or has started to cut back on quantity by reducing the size of meals or number of meals, rarely or sometimes. However, it does not experience any of the three most severe conditions. A severely food-insecure household has worsened to often cutting back on meal size or number of meals, and/or experiences any of the three most severe conditions (running out of food, going to bed hungry or going a whole day and night without eating), even if only infrequently or rarely. In other words, any household that experiences one of these three conditions even once in the previous 4 weeks (30 days) is considered severely food insecure (Castell et al., Reference Castell, Rodrigo, Cruz and Bartrina2015).
Other socioeconomic and demographic variables that were controlled for in the study were place of residence (rural/municipality/city/corporation), education and occupation of the woman household member, as well as of the main earner of the family, and wealth index of the household. The wealth index was created by using the principal component analysis technique, which is explained elaborately by Rutstein and Johnson (Reference Rutstein and Johnson2004). Additional variables like a household’s involvement in agricultural activities, vegetable production and livestock rearing were included as binary variables having ‘yes’ or ‘no’ categories.
All continuous data were checked for skewness using a z-test of coefficient of skewness divided by standard error of skewness, as well as examination of the mean–median difference and the frequency distribution with a normal curve. The relationship between two categorical variables was analysed by chi-squared test and continuous data by independent sample t-test. One-way analysis of variance (ANOVA) was used to compare the means of three or more groups. Curve estimation was applied where necessary and linear and quadratic effects of the continuous independent variables were included in the model. General Linear Model (GLM) or multiple regression models were used to analyse the dependent continuous variable with two or more independent variables. When the Z-scores and maternal BMI were analysed as categorical variables, logistic regression analyses (binary or multinomial) were undertaken with the socioeconomic and demographic variables. Sequential models were mainly used in the analyses; for each dependent variable adjustment was made for periods of survey, linear and quadratic effects of age and all the other explanatory variables in the model, e.g. residence, education and occupation of the woman household member and the main earner, wealth index, dietary diversity group. Level of significance was taken at p≤0.05. Bonferroni corrections, both strict and sequential, were applied to correct for the number of statistical tests undertaken. SPSS version 20 was used for all statistical analysis.
Results
Agricultural performance and household income across agro-ecologies
Table 1 presents socio-demographic information for the sampled households in 2014. A declining trend in mean family size was evident in all agro-ecological zones over the study period: from 5.9 in 1988 to 4.3 in 2014. However, the unfavourable zones (flood-prone and coastal) continued to have relatively larger family sizes than favourable zones in 2014, although there had been a decline over time in these regions. The proportion of household heads with no formal education was highest in flood-prone zones (around 45%) and least in the coastal areas in 2014. However, this had declined over time across regions. Again, the household heads in coastal zones had spent more years in schools (5.7) than others in 2014, although this had increased over time across regions. The panel data also show that enrolment in primary schools has increased tremendously over the last four decades in all zones, with coastal zones continuing to lead others in primary and secondary school enrolment. However, in all types of schools, flood-prone zones performed the worst, due to communication and infrastructural bottlenecks. The table also presents information on occupational shifts of household heads across ecosystems. About half of household heads took up cultivation as an occupation in 1988; in 2014 the share dropped to one-third. At disaggregated level, favourable zones had more land in cultivation than others and coastal zones had the least. The differences could be attributed to fluctuations in yield followed by early flood or intrusion of saline water. The second discernible change is in the area of agricultural labour. Almost a quarter of heads in favourable and flood-prone zones and one-fifth in the coastal belts were employed in agriculture in 1988; the share reduced to one-tenth in the former and just 7% in the latter in 2014. This seems to be in line with the national trend of reduction in agricultural work in the wake of a growing tenancy market, non-farm activities and migration. Information on household capital accumulation is also presented in Table 1. It is interesting to observe that in households in coastal areas capital endowment increased three-fold – from US$371 in 1988 to US$1511 in 2014 – followed by those in the favourable zones. However, increase in non-agricultural capital was much faster in coastal zones than in others.
Table 1 Socio-demographic characteristics of the sampled households, Bangladesh
HH: household.
As can be observed from Table 2, the average amount of owned land had decreased sharply over time to reach 0.40 ha in 2014 – close to the national average. Land area owned per household had decreased more in favourable zones: from 0.63 ha in 1988 to 0.38 ha in 2014. In 2014, land size was highest in flood-prone zones. The percentage of farm households was 61% in favourable zones compared with 54% in flood-prone and coastal zones. It is not surprising that favourable zones had more farm households than unfavourable zones as the latter tend to face a host of constraints to agricultural production such as early floods and salt water. Again, like owned land, farm size almost halved in all areas: from roughly 0.90 ha in 1988 to about 0.52 ha in 2014. Notably, farm size in favourable zones reduced more sharply than in unfavourable zones. Rice covered roughly 75% of cropped area in all zones and had declined only marginally in all areas, with the exception of the coastal belt, which witnessed a sharp decline possibly due to the intrusion of salt water. For example, in 1988, more than four-fifths of cropped area was covered in rice; in 2014, the share fell to three-quarters. Farm households’ access to irrigation has sharply increased for favourable and flood-prone zones. Almost all households in the favourable zones and 90% in flood-prone zones had access to irrigation in 2014. However, it was only 50% for coastal zones – up from 34% in 1988. It is thus not surprising that only 66% of the rice-growing area in the coastal zones was covered by high-yielding varieties (HYVs) as against over 80% in favourable and flood-prone zones. Finally, in 2014, cropping intensity was highest in favourable zones at 168, as against roughly 142 in unfavourable zones.
Table 2 Land ownership, operation and technology adoption of sample households
a MV rice: Modern Variety rice.
b (Gross cropped area/net sown area)×100.
The poverty situation across ecological zones is shown in Table 3. It appears that the incidence of poverty – estimated as the number of poor divided by the total number of population – declined in all areas over time. This is in line with the national average. Also, other measures of poverty in the areas under review declined too.
Table 3 Changes in incidence of poverty (percentage points/year) by agro-ecological zone
a The headcount index measures the proportion of the population considered to be poor. It is a general estimate of poverty, with number of poor divided by total number of population.
Structure and growth analysis of household income revealed that the most dramatic change in income structure occurred in the coastal zones. For example, in 1988, agriculture comprised roughly 60% of household income but the share almost halved by 2014 (Table 4). Special mention may be made of the fact that income from rice, which was an important income source back in 1988, has drastically reduced. On the other hand, the share of non-agricultural income rose from about 43% to 70% over the same period. The share of remittance (money sent home by migrant workers) income also shot up from about 8% to about 30%. Such changes also happened in the other zones but not as sharply as in the coastal zones.
Table 4 Structure analysis of rural household income from the longitudinal surveys (1998–2014)
a Remittance: money sent home by migrant workers.
b Transfer: money received from social welfare programmes of the government/private sectors.
The growth in household income is presented in Table 5. Per capita income grew by 3% in the favourable and coastal zones in the early study decades (1988–2000) but only by 1% in flood-prone zones. In the more recent period (2000–2014), per capita income rose by over 6% in all the zones. Over a long-term period, per capita income growth exceeded 4%. At disaggregated level, agricultural income grew at negative rates in all areas during 1988–2000 but picked up quite well during 2000–2014. This means that the improvement in growth rates of per capita income can be mostly ascribed to the growth of non-agricultural income.
Table 5 Household income (in US$) and growth rate according to major sources by agro-ecological zone
The data presented in Table 6 show that both flood-prone and coastal ecosystems have substantially lower agricultural incomes. However, the households in the coastal ecosystem overcome most of the disadvantages through higher non-farm incomes from higher non-land fixed assets, higher educated workers and a higher incidence of overseas migration of workers. So the difference in household income is only marginal. In the flood-prone ecosystem, non-agricultural income is also lower compared with the favourable ecosystem, because of lower average years of schooling of the worker and lower value of non-land fixed assets. The households in the flood-prone ecosystem also avail themselves of the opportunities of overseas migration, but to a much lesser extent than the households in the coastal ecosystem.
Table 6 The effect of unfavourable factors on household income (US$) – estimates from a multivariate model
It is postulated that household income will depend on the endowment of land, renting of land from the tenancy market, the value of agricultural and non-agricultural fixed assets and the number of earning household members and their level of schooling. Female-headed households may have a disadvantage and earn less, while households receiving remittances from migrant household members within the country and overseas will have higher income. The variable ‘access to electricity’ was introduced to assess the effect of development of infrastructure. In fact, the villages that have electrification also have connections to paved roads. The regression model helped to assess the effect of unfavourable ecologies, which were introduced in the model as dummy variables after dissociating the effect of variations in factor endowments, infrastructure development and migration of household members, which should be independent of the agro-ecology.
The findings indicate about 70% variation in income among the sample households. The coefficients of all variables were statistically significant, except those for female headship and households with migrant members working within the country. The female-headed household is now a mixed bag consisting of widows and separated women, as well as women taking management responsibility after their husbands migrate to work in towns and overseas. The latter group is economically better off than the former. The coefficients show that a household earned on average US$1138 from an acre of land under its ownership. If the land was rented, the return was lower by about 10% due to the payment of rent to the landowner. The rate of return on capital was about 28% for agricultural and 24% for non-agricultural pursuits. A male worker earned on average US$252 (US$2.22 per day per year, assuming an employment of 5 days per week). A female worker earned US$389. A year of schooling gave a return of US$27 for male workers and US$35 for female workers. If the household had a relative working abroad, the remittance sent augmented household income by US$2455 (also 98% of average household income).
The coefficients of the dummy variables representing the fragile environment were negative and statistically significant. A household living in the flood-prone ecosystem earns on average US$331 per year/capita (16%) – less than a household living in a favourable environment. For the households in the coastal saline environment the income was lower by US$419 (19%) per year/capita. Thus the null hypothesis that household income is equal across agro-ecologies is not validated by the survey data.
Effect of unfavourable environment on maternal and child malnutrition
Analysis of the 2011 and 2012 FSNSP data found that with WHO cut-offs, overall 61% of the Bangladeshi mothers’ BMI fell in the normal range, the prevalence of chronic energy deficiency (CED) was 28% and overweight was 11%. When Asian cut-offs were used, 50.4% and 21.6% of women were normal and overweight, respectively. The results from the pooled data found that the stunting rate was 36% in the 0- to 59-month-old children, of whom 8% were severely stunted. Underweight and wasting prevalence were 37% and 11.7%, respectively; 10% were severely underweight and 1.1% were severely wasted.
The prevalence of CED and overweight/obesity did not vary substantially from one season to another. The prevalence of CED ranged from a low of 27.2% in the post-Aman harvest period to a high of 28.7% in monsoon time, while the prevalence of overweight/obesity was almost the same in all three seasons (11% to 11.3%). It was found that just above 13% of the mothers were short by international standards (height below 145 cm) over the study period and the same percentage of mothers’ MUAC (mid-upper-arm circumference) was below 220 mm. When the rates of stunting and wasting of children under five were compared between the three seasons, significantly higher rates were observed in the monsoon season compared with both the post-Aman and post-Aus harvest seasons (Fig. 2). The percentage distribution of undernourished mothers and children in the different agro-ecological zones is presented in Figures 3 and 4; the percentages of all forms of undernutrition in both mothers and children were significantly higher in the Haor Basin areas compared with other parts of the country.
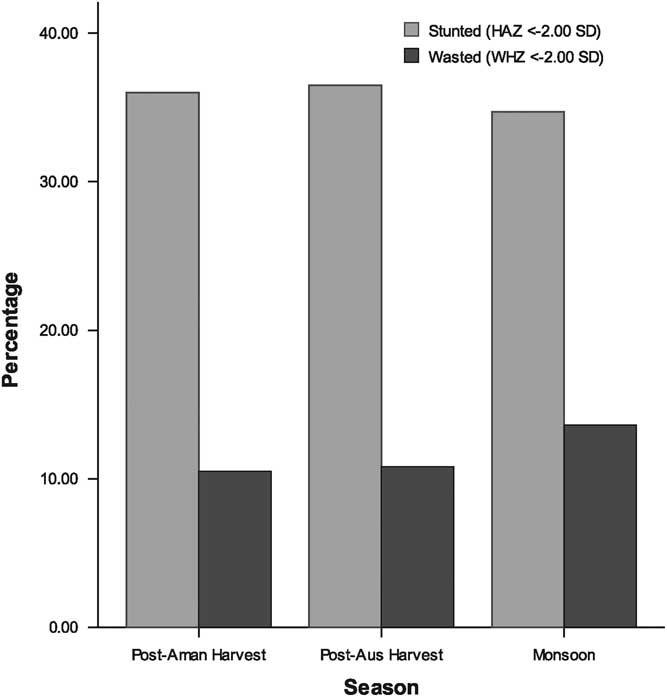
Fig. 2 Percentages of undernourished children (aged <5 years) in three rounds of data collection (FSNSP surveys 2011 and 2012).
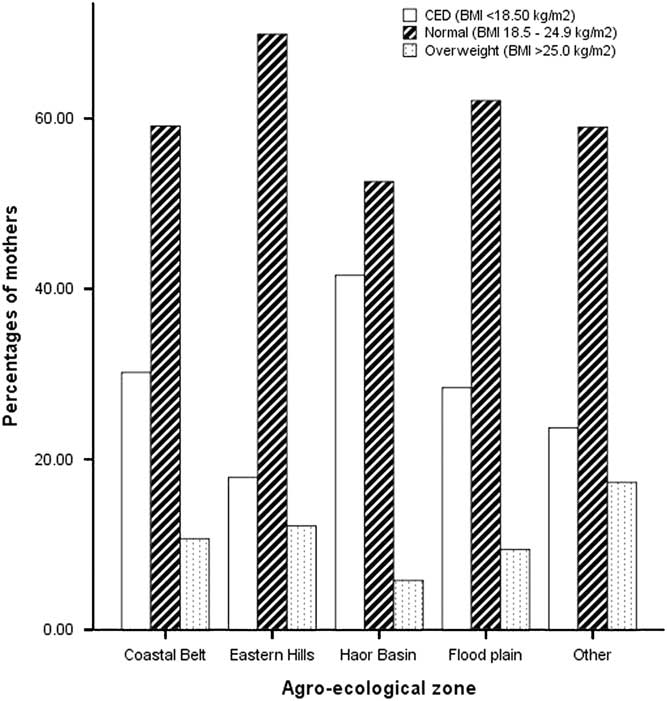
Fig. 3 Percentages of BMI categories of mothers according to agro-ecological zone (FSNSP surveys 2011 and 2012). CED: chronic energy deficiency.
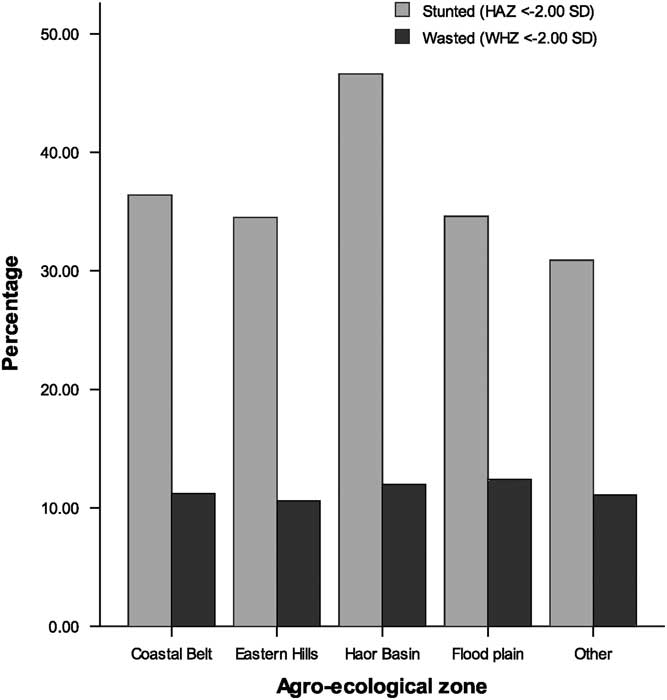
Fig. 4 Percentages of undernourished children (aged <5 years) in different agro-ecological zones (FSNSP surveys 2011 and 2012).
General Linear Model (GLM) (not shown in the Tables) analysis found regional variations for maternal BMI; mothers from the Haor Basin had the lowest mean value. The average BMI of mothers from the coastal belts was also lower compared with that of mothers from other parts of the country. Mothers living in food-secure households had, on average, a better BMI than those living in food-insecure households. After controlling for the other demographic and socioeconomic variables, it was found that educational level, wealth quintile and HFIAS score were strongly associated with BMI values. As educational level of mothers increased, so did their mean BMI and the difference between richest and poor households was 1.5 kg/m2. However, seasonality and households’ involvement with agriculture or livestock-rearing or possession of a homestead garden failed to show any association with maternal BMI.
After correction for the other demographic and socioeconomic variables, unfavourable agro-ecology and seasonality were found to be associated with the Z-scores of children. After controlling for all the other socioeconomic and demographic variables, average Z-scores (HAZ and WHZ) were found to be lowest in the Haor Basin area. Seasonal heterogeneity was present, with the highest WHZ mean in the post-Aman harvest period, and the lowest in the monsoon season. Seasonality was found to be significant for HAZ score, which was slightly higher in the monsoon season compared with the harvest seasons. The difference in the HAZ score between children having and not having diversified diets and between food-secure and severe food-insecure households was significant; as the food security score in a household increased, so did the child’s mean HAZ score. Other socio-demographic factors associated with Z-scores were educational level of parents and wealth index. Upward trends in the mean of all Z-scores were evident from low to higher education of parents and from poor to rich households. Children from households where the main earners were agricultural labourers showed significantly lower WHZ scores than those from households where the main earners were farmers/professionals. General Linear Model analysis was done for two years in the FSNSP by the month of birth for children in the pooled sample to assess the changes in HAZ and WHZ scores. The HAZ or WHZ scores of children did not vary by their months of birth (Fig. 5). The mean scores for HAZ were −1.48, −1.46 and −1.45 in the post-Aman harvest, post-Aus harvest and monsoon seasons, respectively (F=0.92, ns); whereas mean WHZ values in these seasons were −0.86, −0.85 and −0.87, respectively (F=0.65, ns).
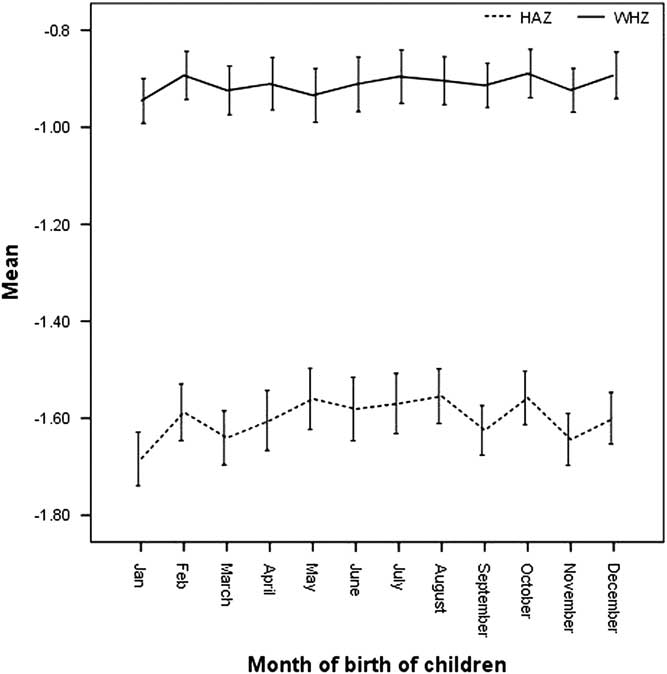
Fig. 5 Mean HAZ and WHZ of children (aged <5 years) according to their month of birth (FSNSP surveys 2011 and 2012).
Multinomial logistic regression analyses were undertaken to determine whether it was possible to predict the maternal nutritional status based on three levels of maternal BMI (underweight, normal and overweight) using all the socioeconomic and demographic variables. The odds ratios obtained from the model (Table 7) showed that mothers from the Haor Basin were nearly one and half times more likely to be underweight compared with those from other parts of the country. Those from coastal belt areas also had a greater likelihood of being underweight. Seasonality failed to show any association with the nutritional status indicator of mothers. Dietary diversity, unexpectedly, did not show any association with maternal BMI, whereas using HFIAS it was found that mothers from food-secure households had a lower likelihood of being underweight and greater likelihood of being overweight compared with those from food-insecure households.
Table 7 Multinomial logistic regression analysis of maternal BMI by food seasonality and agro-ecological zone

Ref.=Reference group; OR=odds ratio, CI=confidence interval.
a Socioeconomic and demographic information controlled for in the analysis were residence, education and occupation of the women and the main earner, wealth index, dietary diversity group, age and period of survey.
Table 8 presents the results of the binary logistic regression analyses that were undertaken to see how well the socioeconomic and demographic variables predicted underweight, stunting and wasting. Children measured in the harvest seasons (post-Aman and post-Aus) had a lower likelihood of being wasted compared with children measured in the monsoon season. Unexpectedly, month of birth (not shown in the Table) or birth-season failed to show any association with any of the Z-scores (Table 8). The odds of being stunted were significantly higher among the children from the Haor Basin compared with those from other parts of the country, even after controlling for other factors. Children having low dietary diversity in their household showed a greater likelihood of being stunted compared with children with high dietary diversity in their households, whereas children from food-secure households had a significantly lower likelihood of being undernourished in any way – stunted or wasted. After adjustment for the other socioeconomic and demographic variables, children of less-educated parents and from households of lower wealth index showed a greater likelihood of being stunted compared with their better-off counterparts. Children of households where the main earners were agricultural labourers also showed a greater likelihood of being stunted compared with children from households where the main earners were farmers owning land.
Table 8 Binary logistic regression analysis of Z-scores by food seasonality and agro-ecological zone
Ref.=reference group; OR=odds ratio; CI=confidence interval.
a Socioeconomic and demographic information controlled for in the analysis were residence, education and occupation of parents, dietary diversity group, wealth index, age and period of survey.
Discussion
The risk factors for malnutrition are multifaceted and complex, and the relative importance of each of the known risk factors is likely to vary between settings. The panel data analysis of 2014 data in the first part of this paper showed that household income was different across agro-ecologies in Bangladesh. The fragility of the environment may affect the household’s ability to grow food, which may in turn influence nutritional status negatively. However, entitlement arising out of the growth of non-agricultural – especially remittance (money sent home by the migrant workers of the households) – income could help increase access to food. Hence, giving higher priority to development interventions for these ecologies could result in substantial improvement in food security and nutrition at the national level.
The results from the pooled data from 2011 and 2012 showed that the rates of undernutrition among children and their mothers were still unacceptably high, although a recent cross-country study by Headey (Reference Headey2013) concluded that from 1997 to 2007 Bangladesh recorded one of the fastest prolonged reductions in child underweight and prevalence of stunting in recorded history – 1.1 and 1.3 percentage points per annum, respectively. In the present study, stunting rate was found to be 36% (8% were severely stunted). Underweight and wasting prevalence were 37% (10% severely underweight) and 11.7% (1.1% severely wasted), respectively. Among mothers, nearly 28% suffered from chronic energy deficiencies, while 3.2% of them had a BMI of less than 16 kg/m2.
Recently, the issue of spatial distribution of undernutrition has emerged as a matter of urgent concern, considering the growing evidence for wide regional variations within countries (Spray et al., Reference Spray, Eddy, Hipp and Iannotti2013; Mohsena et al., Reference Mohsena, Goto and Mascie-Taylor2015). A recent study in India found an increasing concentration of child malnourishment in certain spatial areas, described as ‘pockets of concentration’ of malnourishment (Nair, Reference Nair2007). Interestingly, even in countries like the United States and Malaysia, malnutrition-loaded regions still exist, most of which are populated by ethnic minorities and spatially distanced from the major urban centres (Slifkin et al., Reference Slifkin, Goldsmith and Ricketts2000). So it is not surprising that similar pockets should exist in Bangladesh as well, where the Haor and coastal belt areas are geographically distinct from other parts. In this study, the overall prevalence of stunting ranged from 46.6% in the Haor Basin to 30.9% in other parts of Bangladesh, whereas the prevalence of underweight ranged from 44.5% in the Haor Basin to 34.1% in other areas. Flood plains had the highest prevalence of wasting (12.4%) and the eastern hills had the lowest (10.6%). Regional heterogeneity in mean Z-scores was present, as well. Children from the Haor Basin had the lowest mean Z-scores. The highest prevalence of maternal underweight (41.6%) and lowest mean maternal BMI were also observed in the Haor Basin area. The findings of the present study undoubtedly reveal that, in order to decrease inter-regional disparity, the Haor Basin area needs the most attention from policymakers. ‘Haor’ is characterized by a bowl- or saucer-shaped tectonic depression that is submerged with run-off rainwater from upstream. The areas remain under water for more than 6 months of the year. Flash floods due to upstream water destroy the standing crop and thus affect the poor and marginal farmers who earn their livelihoods from agriculture. Even during the dry season, due to the increase in evaporation rate and decrease in groundwater level, cultivation of winter crops and aquaculture is prohibited. Villagers remain isolated with poor road accessibility and transport links, which may have implications for access to health facilities and other welfare services (Kandala et al., Reference Kandala, Fahrmeir, Klasen and Priebe2009). These issues deserve closer attention: this study is merely able to highlight the important spatial patterns of undernutrition without being able to fully explain them. To alleviate such pockets of undernutrition, the experiences from India could be shared; for example, Nair (Reference Nair2007) emphasized change in several other societal features such as poverty and social characteristics of people (social class, caste, and religion).
The chief objective of this report was to place food seasonality firmly in the centre of the agenda. Previous studies on the association between food seasonality and the nutritional status of adults and children have reported inconsistent findings. In a study conducted in Ethiopia, children registered better WHZ scores in a period before harvest compared with a period after harvest, while the pattern observed for adults was as expected – a higher average BMI was reported in the season of plenty and a lower average BMI in the lean season (Ferro-Luzzi et al., Reference Ferro-Luzzi, Morris, Taffesse, Demissie and D’Amato2002). On the other hand, a Kenyan study did not find significant seasonal differences in children’s mean weight changes, but the percentage of children stunted was higher during the lean season (51%) compared with the post-harvest months (28%) (Kigutha et al., Reference Kigutha, Van Staveren, Veerman and Hautvast1995). Other studies have compared children’s nutritional status between the wet and the dry seasons and have found that children are more likely to have poorer nutritional status in the dry season compared with the wet season (Chikhungu & Madise, Reference Chikhungu and Madise2014). The present study found significantly higher rates of wasting in the monsoon season compared with the two harvest seasons (post-Aman and post-Aus), whereas no difference in maternal BMI was found across three seasons. However, in the monsoon season, the average HAZ score was found to be better compared with the other two seasons. In countries like Bangladesh, dependence on rain-fed agriculture creates variation in food availability across seasons. Periods after harvest are abundant with food, while cropping periods have less food. Moreover, the reduced childcare during the busy harvesting period could be a potential contributor to the poor HAZ scores during this period; this needs further exploration. In countries like Bangladesh, seasonality in nutrition cannot merely be a food problem. There is growing evidence, globally and in Bangladesh, that environmental enteropathy is a major cause of undernutrition (Lin et al., Reference Lin, Arnold, Afreen, Goto, Huda and Haque2013). Countries in South Asia that have a combination of very heavy monsoons and high population density provide perfect conditions for water-borne diseases. Further evidence of this is that even though rice production and consumption have increased rapidly in Bangladesh, including production during the dry season through irrigated Boro crops, which ought to stabilize food consumption throughout the year, wasting has not really declined. Moreover, wasting is very prevalent, and still very seasonal, even in urban areas, despite little evidence of seasonal fluctuations in wages or food prices. In children aged 2–6 years in Bangladesh, Rousham and Mascie-Taylor (Reference Rousham and Mascie-Taylor1995) observed that weight loss and decreases in MUAC associated with infection in the dry and monsoon seasons were statistically significantly greater than those in the winter months. So the complex interplay of seasonality must come into the global agenda of nutrition. As a starting point, governments and NGOs need a thorough understanding of the ways in which food seasonality interplays with the underlying causes of undernutrition. Detailed seasonal analysis will enable national governments, donors and other stakeholders to better understand the seasonal nature of undernutrition and implement appropriate policies and practices to build communities’ resilience to nutrition crises.
Research has consistently shown that the month of birth is an important predictor of health outcomes, morbidity and mortality. A previous study in India has found that children born during the monsoon months had lower anthropometric scores compared with children born during the autumn/winter months. The results emphasized the importance of seasonal variations in environmental conditions at the time of birth in determining health outcomes of young children in India (Lokshin & Radyakin, Reference Lokshin and Radyakin2012). Unexpectedly, the current study failed to show any association between month of birth and the anthropometric indices of children.
This analysis of FSNSP data found that food insecurity in households affects the nutritional status of children under five and their mothers in Bangladesh. The effect of food insecurity remained strong even after controlling for common and significant socioeconomic characteristics such as the educational status of parents, their working status and wealth quintiles. Therefore, intervention should be taken to eradicate food insecurity. A comprehensive National Food Policy developed in 2008 was followed in 2011 by the Country Investment Plan, which provided stakeholders with a clear road-map for investment in agriculture, food security and nutrition (Hasan et al., Reference Hasan, Ahmed and Chowdhury2013).Following the guidelines, policymakers and programme managers should play a vital role in reducing childhood and maternal undernutrition by implementing necessary interventions focusing on the underlying causes of food insecurity in order to develop a healthy nation as well as improve the overall progress and development of Bangladesh.
From the age of 6 months onwards, children require a diversified diet that will supply the full range and quantity of nutrients required to support rapid growth (Allen et al., Reference Allen, Black, Backstrand, Pelto, Ely, Molina and Chávez1991). Low dietary intake of micronutrients has negative consequences for children’s growth and development and for women’s health and productivity. In the present study in Bangladesh, more than half (55%) of children aged 6 months to 5 years (a crucial age for development) were from households that did not meet the minimum dietary diversity criteria (at least four food groups per day). Among the causes of undernutrition, the study identified lack of dietary diversity as a key problem. Previous surveys have reported that households consume low-quality diets with little diversity because they lack the resources to grow or purchase micronutrient-rich foods (Torlesse et al., Reference Torlesse, Moestue, Hall, De Pee, Kiess and Bloem2004).The drastic increase in food prices since 2007 has additionally contributed to worsen the food security and economic situation of the country (Matin et al., Reference Matin, Parveen, Das, Mascie-Taylor and Raihan2009).
Among other socioeconomic and demographic factors, the study found robust relationships between the wealth index and education of mothers and the Z-scores of children. The findings suggest that if undernutrition is to be reduced as specified in various strategic health objectives and the SDGs, policies and strategies for poverty alleviation, promotion of education for mothers and provision of basic sanitation facilities are crucial issues that need to be pursued because they have a big impact on nutritional status.
The main limitation of the study was the use of a different set of data (FSNSP) for the nutritional component as the panel data had no variable related to nutrition. Other limitations included lack of information on consumption of energy intake, macro- and micronutrients and physical activity, which are crucial components for the estimation of nutritional status. Moreover, the cross-sectional nature of the FSNSP data did not allow causal inferences to be drawn.
In conclusion, in order to determine the most effective strategies for reducing the burden of undernutrition and accelerating development, it is important that the determinants of undernutrition are known, especially in the context of unfavourable areas of a country, such as the Haor Basin in Bangladesh. There is highly significant regional heterogeneity in undernutrition in Bangladesh; alarmingly high levels still prevail in the Haor Basin and coastal belt areas. It appears that though per capita income has increased overtime, it has not yet translated into the consumption of nutrient-rich diversified foods. Hence, an appropriate policy guideline that focuses on altering the nutritional intake of poor children, especially in the regions with higher prevalence of childhood undernutrition, is needed; more focused programmes targeting specific issues like ‘diversified diet at low cost’ should be implemented and evaluated. A study done on the 1992 and 2000 data from the Nutritional Surveillance Project (NSP) by Torlesse et al. (Reference Torlesse, Moestue, Hall, De Pee, Kiess and Bloem2004) revealed an association between rice expenditure and the nutritional status of children, and concluded that macroeconomic food policies that keep the price of food staples low (e.g. open market sales of rice and wheat) could contribute towards reducing the percentage of undernourished children; this low price allows households to spend more money on non-rice foods, and thereby diversify their diet by consuming non-rice foods more frequently (Torlesse et al., Reference Torlesse, Kiess and Bloem2003). For greatest effect, Miller et al. (Reference Miller, Ritchie, Tran, Beggs, Lada, Whetter and Cobiac2013) suggested that intervention strategies have to be seasonally related. Health workers need to recognize the complex interplay of seasonality in order to find a mix of interventions to address this problem. This paper demonstrates the importance of bringing seasonal thinking back into the current debates on hunger and nutrition. Food availability and food security issues came out as major concerns for Bangladesh as they have a direct impact on nutritional status. Education, especially of females, should still be one of the key policy options to achieve the SDG on undernutrition in Bangladesh.
Acknowledgments
This paper was part of the research generated by the Leveraging Agriculture for Nutrition in South Asia Research (LANSA) research consortium, funded by UK aid from the UK government. The views expressed do not necessarily reflect the UK Government’s official policies. The study was carried out by the Research and Evaluation Division of BRAC, Bangladesh, using the data collected and shared by the Food Security Nutritional Surveillance Project (FSNSP) with support from the European Union. Special thanks go to Dr Akram Hussain, Dr Zeba Mahmud, Dr Sabiha Sultana and Mr Syed Auranghajeb, who worked in FSNSP and helped with the official process of acquiring the dataset from the FSNSP. The study also used data from a longitudinal survey done by one of the authors of this paper.


 Open access