


Hispanics in the USA are at disproportionately higher risk for CVD and diabetes, in part due to higher prevalence of obesity and cardiometabolic disease risk factors relative to other ethnic groups( Reference Pan, Galuska and Sherry 1 , Reference Daviglus, Talavera and Avilés-Santa 2 ). Poor dietary quality may be a major contributor to these disparities. Available surveillance data on dietary composition suggest that, as for other ethnic groups, the diet of Mexican-American adults is in need of improvement, as indicated by reports of high intakes of solid fats, cholesterol, added sugars and sugar-sweetened beverages, and low intakes of vitamins D and E, Ca and K, whole grains, dairy products, dark greens and highly coloured vegetables( Reference Carrera, Gao and Tucker 3 – Reference Hoerr, Tsuei and Liu 7 ).
Different ethnic subgroups have culture-bound patterns of food purchase, preparation and eating( Reference Keller, Fleury and Rivera 8 ), all of which can be affected by environmental resources (e.g. food availability, cost)( Reference Colby, Morrison and Haldeman 9 ), socio-economic factors (e.g. income, education)( Reference Zhang and Wang 10 , Reference Dubowitz, Heron and Bird 11 ) and other factors known to contribute to unhealthful dietary changes (e.g. acculturation, migration)( Reference Ayala, Baquero and Klinger 12 – Reference Perez-Escamilla 15 ). Among women, dietary choices may also be related to age and developmental transition periods( Reference Wakimoto and Block 16 , Reference Hiza, Casavale and Guenther 17 ). For example, the challenges of caring for a newborn child while maintaining other responsibilities (e.g. family, work) are potential barriers for following healthful dietary practices among postpartum women. Among older women, life and emotional stresses that accompany ageing may also compromise healthful eating( Reference Keller, Larkey and Distefano 18 ). Potential differences in dietary quality among Hispanic women of different life stages have not been reported. An understanding of the key dietary concerns for this subgroup at different stages of life can provide insight for developing appropriate nutrition interventions characterized by developmental transitions and cultural relevance.
The purpose of the present report is to evaluate the baseline dietary quality of overweight/obese young and older Mexican-American women, most of them living under disadvantaged socio-economic conditions, enrolled in two culturally relevant, community-based, social-support interventions designed to increase daily walking for weight loss conducted in the greater Phoenix, AZ, area, USA. Physical activity (PA) data and intervention outcomes have been reported elsewhere( Reference Keller, Fleury and Perez 19 – Reference Ainsworth, Keller and Herrmann 21 ). This report of dietary intake among two groups of Mexican-American women is important for two reasons. First, an understanding of dietary quality in Mexican-American women during two distinctive life transition periods (childbirth and perimenopause) can suggest a research-application paradigm that can be successfully used to promote healthy development not only over a lifetime but across generations( Reference Fine and Kotelchuck 22 ). This perspective suggests that numerous factors converge at passage points such as childbearing (as fat storage and fertility are linked in human females( Reference Power and Schulkin 23 )) and menopause (related to a relatively sedentary lifestyle in modern populations), which contribute to weight accumulation in women( Reference Keller, Larkey and Distefano 18 ). Second, a Mexican-American woman’s values are, in the case of many Hispanic women, still built on core traditional values that are deeply embedded in her dietary practices and play a role in guiding activities of daily living, including food preparation and intake( Reference Coe 24 ). Modernization, migration and experience living in a historically and predominantly non-Hispanic culture may have transformed the traditional culture of Hispanics. While change does occur, traditions continue to shape Mexican-American women’s behaviour, which is influenced by deeply held, and less likely to change, traditional values including food intake( Reference Castro 25 ).
Experimental methods
Participants
Participants were Mexican-American women enrolled into Mujeres en Acción (Women in Action; hereafter, ‘Mujeres’; older; n 124; 45–70 years)( Reference Keller, Fleury and Perez 19 ) and Madres para la Salud (Mothers for Health; hereafter, ‘Madres’; younger; n 139; 18–40 years; at least 6 weeks but less than 6 months after childbirth)( Reference Keller, Records and Ainsworth 20 ). Both studies recruited participants through community organizations (e.g. churches, community centres, agencies) that serve Hispanic residents in the greater Phoenix, AZ, area, USA, resulting in the enrolment of a large number of women living under disadvantaged socio-economic conditions. Mujeres was conducted from 2008 to 2010; Madres was conducted from 2009 to 2012.
Participants of both programmes were habitually sedentary women, but physically able to participate in moderate-intensity PA in the form of walking. Habitual sedentary activity was assessed by self-report of <150 min of moderate PA/d in Mujeres participants, and by the Stanford Brief Activity Survey (SBAS, a brief self-report screening tool and categorical measure of PA status) in Madres participants( Reference Taylor-Piliae, Fair and Haskell 26 , Reference Ainsworth, Haskell and Herrmann 27 ). The SBAS uses reports of occupational and leisure-time PA to classify respondents’ overall PA intensity levels on a 5-point scale. Exclusion criteria included: currently engaged in regular, strenuous PA; currently pregnant or planning on becoming pregnant within the next 12 months; using antidepressants or anti-inflammatory medications; and having a BMI of <25·0 kg/m2 or >35·0 kg/m2. While parity is a documented risk for postpartum weight retention, the younger women were not excluded for parity; this was the first pregnancy for twenty-eight women (20·1 %) with the remainder (n 111, 79·9 %) reporting two to six births. Both studies were approved by Arizona State University’s Institutional Review Board and all participants gave written consent to participate.
Measures
All data were collected by trained research staff prior to the randomization allocation. Height, weight and waist circumference were measured in triplicate following standard procedures. A questionnaire captured information on age, annual household income (0–$US 20 000 or >$US 20 000) and birthplace (USA, Mexico or other). Acculturation was determined using Hazuda acculturation scales( Reference Hazuda, Stern and Haffner 28 ), that includes information on language use and proficiency, cultural beliefs and family values. Each dimension of the scale ranges from 1, indicating lowest acculturation, to 4, indicating highest acculturation.
Diet assessment
Baseline dietary intake data were obtained using one (in Mujeres) or three (in Madres) unannounced 24 h recalls at baseline using a five-step, multiple-pass method( Reference Conway, Ingwersen and Moshfegh 29 ). All diet data were collected and entered by trained bilingual staff. The dietary recalls were collected during all seven days of the week. Dietary data were analysed using Nutrition Data System for Research (NDSR) software version 2009, developed by the Nutrition Coordinating Center (NCC), University of Minnesota, Minneapolis, MN, USA. Dietary variables of interest were estimates of total energy intake, amount and percentage of energy provided by macronutrients, and selected micronutrients relevant to women’s health (Ca, Fe, folate and vitamins C and E).
Intake adequacy of selected nutrients was evaluated by estimating the proportion of participants meeting current Dietary Reference Intake (DRI) recommendations following the Estimated Average Requirement (EAR) cut-point method, as recommended by the Institute of Medicine to evaluate the nutrient intake of groups( 30 ). This method uses the EAR specific for gender and age as the recommended intake standard; when an EAR is not available (e.g. for dietary fibre), the Adequate Intake is used( 30 ).
While assessing the adequacy of specific nutrients in a diet is important, evaluating the diet as a whole captures the complexity of nutrient interactions and the presence of bioactive components( Reference Kant 31 ). A current approach to evaluating overall dietary quality is the Healthy Eating Index (HEI), an algorithm that measures conformance to the Dietary Guidelines for Americans( 32 ) and was recently modified to be consistent with the dietary recommendations released in 2010 (HEI-2010)( Reference Guenther, Casavale and Reedy 33 ).
Diet quality was assessed by calculating the HEI-2010, as described previously( Reference Guenther, Casavale and Reedy 33 ). Briefly, the HEI-2010 includes twelve components divided into food groups or nutrients that capture dietary adequacy (i.e. food groups or nutrients that should be included in the diet: total fruit, whole fruit, total vegetables, greens and beans, whole grains, dairy, total protein foods, seafood and plant proteins, and fatty acids) and ones that capture moderation (i.e. food groups or nutrients that should be limited: refined grains, sodium and empty calories). Individual components are scored from 0 to 5, 10 or 20, depending on the food or nutrient category; the maximum total score is 100. For adequacy components, the maximum score corresponds to intake equal to or greater than the level of the recommended intake. For moderation components, the maximum score is assigned for intake at or below the maximum recommended level of intake, reflecting lower consumption. The scoring standards are assessed on a density basis, focusing on diet quality instead of quantity, with each individual component assessed as amount per intake of 4184 kJ (1000 kcal), percentage of total energy intake or a ratio( Reference Guenther, Casavale and Reedy 33 ). The score of the population ratio (the studied group’s total intake of each individual component divided by the group’s total energy intake) was used to reduce the bias in estimating usual intakes of the two groups assessed (Madres and Mujeres). The total HEI-2010 score is calculated as the sum of all individual components( Reference Freedman, Guenther and Krebs-Smith 34 ). The conventional cut-off points for the HEI are as follows: total HEI >80 is indicative of a ‘good’ diet; scores between 51 and 80 indicate a need for improvement; and scores <51 are indicative of a poor diet( 35 ). The individual components are also expressed as the percentage of the maximum score, with a higher score indicating intake at a level closer to recommendations (i.e. greater intake for adequacy and lower intake for moderation components). The recommended approach to calculating HEI scores using NDSR was followed( Reference Miller, Mitchell and Harala 36 ).
Statistical analysis
All statistical analyses were conducted with the statistical software package IBM SPSS Statistics for Windows, version 21·0. Descriptive characteristics of participants and dietary data are presented in text and tables as means and standard deviations for continuous variables and as percentages of the total sample for categorical variables. Nutrient intake for carbohydrate, protein, fat and saturated fat was expressed as a percentage of total energy. Data were initially tested for homogeneity of variance using the Levene test. Independent-samples t tests were then used to perform between-group comparisons of general descriptive characteristics, sugars intake and diet quality scores. A χ 2 analysis was used to compare categorical variables of descriptive characteristics. Nutrient intakes between younger and older women were compared using a multivariate ANCOVA, adjusting for age, BMI, body fat percentage, income and birthplace. Statistical significance was set at P<0·05. HEI-2010 scores were expressed as an absolute score and percentage of the maximum score. Of 126 Mujeres participants, two did not provide diet data and were excluded from the present analysis. Acculturation data were available only for ninety-four Mujeres and eighty-one Madres participants.
Results
Participant characteristics
The sample comprised 124 older (Mujeres, 55 (sd 7) years old) and 139 younger (Madres, 26 (sd 8) years old) women who had complete dietary data (Table 1). Mean BMI values were in the obese and overweight range for older and younger women, respectively (P<0·001). Almost two-thirds reported an annual household income below $US 20 000 (59 % of older and 71 % of younger women, P=0·049). Fifty per cent of the older participants were born in the USA, while most (78 %) of the younger participants were born in Mexico (P<0·001). According to Hazuda acculturation scales( Reference Hazuda, Stern and Haffner 28 ), older women were more acculturated regarding childhood language experience (P<0·001) and adult language usage (P<0·001). However, there were no differences related to value placed on Mexican cultural origin and attitude towards traditional family structure and sex role organization, and adult proficiency in English.
Table 1 Characteristics of study participantsFootnote *: overweight/obese sedentary Mexican-American women of low socio-economic status enrolled in two community-based physical activity interventions in the greater Phoenix, AZ, area, USA

Mujeres, Mujeres en Acción (Women in Action; participants aged 45–70 years, conducted from 2008 to 2010); Madres, Madres para la Salud (Mothers for Health; participants aged 18–40 years, conducted from 2009 to 2012).
* Data for annual household income and birthplace are shown as percentage of participants within each category.
† For Hazuda scales, 1=lowest and 4=highest acculturation; n 94 for Mujeres and n 81 for Madres.
Dietary intake
A summary of dietary intake data and DRI recommendations for the older and younger women is provided in Table 2. Reported mean total energy intake was 5883 kJ (1406 kcal) and 6176 kJ (1476 kcal) daily for older and younger women, respectively, with no significant difference between groups. The percentage of energy from carbohydrate and the intakes of Ca, Fe and folate were significantly lower in the older than in the younger women (all P<0·01). In contrast, dietary fibre intake was significantly higher in the older women than among the younger women (P=0·020). A listing of lead food sources of selected nutrients is displayed in the online supplementary material, Supplemental Table 1.
Table 2 Comparison of daily intakes of total energy, macronutrients and selected micronutrients between age groups relative to DRI valuesFootnote *: overweight/obese sedentary Mexican-American women of low socio-economic status enrolled in two community-based physical activity interventions in the greater Phoenix, AZ, area, USA

DRI, Dietary Reference Intake; Mujeres, Mujeres en Acción (Women in Action; participants aged 45–70 years, conducted from 2008 to 2010); Madres, Madres para la Salud (Mothers for Health; participants aged 18–40 years, conducted from 2009 to 2012); AMDR, Acceptable Macronutrient Distribution Range; AI, Adequate Intake; UL, Upper Limit; EAR, Estimated Average Requirement.
* Mean values for nutrient intake between older and younger women were compared using ANCOVA, adjusted for age, BMI, body fat percentage, place of birth and income. Data shown are unadjusted means.
Table 3 indicates the amount of added sugars provided by sugar-sweetened beverages. Older women consumed significantly less added sugars than younger women (P<0·0001). Of all added sugars consumed, the proportion contributed by sugar-sweetened beverages was significantly lower among the older women than in the younger women (P<0·0001).
Table 3 Comparison of sugars intake and sugars from SSB between age groupsFootnote *,Footnote †: overweight/obese sedentary Mexican-American women of low socio-economic status enrolled in two community-based physical activity interventions in the greater Phoenix, AZ, area, USA
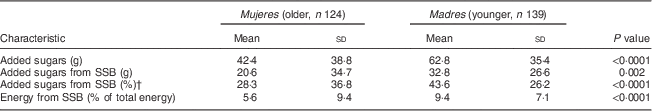
SSB, sugar-sweetened beverages; Mujeres, Mujeres en Acción (Women in Action; participants aged 45–70 years, conducted from 2008 to 2010); Madres, Madres para la Salud (Mothers for Health; participants aged 18–40 years, conducted from 2009 to 2012).
* Mean values for sugars intake between older and younger women were compared using a t test.
† Five Mujeres participants reported consuming no added sugars and were excluded from this comparison.
The majority of participants (83 % of the older and 93 % of the younger women) had an intake below the DRI for dietary fibre( 37 ). When comparing intake with current Ca DRI values( 38 ), 84 % of the older and 59 % of the younger women had an intake below recommendations. Fe intake was below recommendations( 39 ) for 14 % of the older and 29 % of the younger women. For folate, 71 % of the older and 65 % of the younger women did not reach the recommended intake( 40 ). Inadequate intake of vitamin C( 41 ) was observed in 60 % of the older and 63 % of the younger women. Similarly, vitamin E intake was below that recommended( 41 ) for most participants (96 % of older, 98 % of younger women). For Na, 45 % of the older and 56 % of the younger women had an intake above the recommended 2300 mg/d( 32 ).
Healthy Eating Index-2010
Mean HEI-2010 individual and total scores and the percentage of the maximum possible score for each component are presented in Table 4. For the adequacy component scores, whole fruit, total vegetables, and greens and beans were significantly higher among the older than among the younger women (all P<0·05). In contrast, the whole grains score was significantly lower among the older than among the younger women (P=0·000). For moderation components, younger women had a significantly lower score for empty calories than older women (P=0·012), which suggests higher intake of empty calories. Nevertheless, the score for both groups was indicative of high consumption of foods with low nutrient density.
Table 4 Comparison of estimated mean total HEI-2010 and component scores, expressed as absolute score and percentage of the maximum score, between age groups*: overweight/obese sedentary Mexican-American women of low socio-economic status enrolled in two community-based physical activity interventions in the greater Phoenix, AZ, area, USA

HEI-2010, Healthy Eating Index-2010; Mujeres, Mujeres en Acción (Women in Action; participants aged 45–70 years, conducted from 2008 to 2010); Madres, Madres para la Salud (Mothers for Health; participants aged 18–40 years, conducted from 2009 to 2012).*Mean values for total HEI-2010 and component scores between older and younger women were compared using a t test.
Most individual component scores were below the maximum attainable score: dairy (54 % and 64 %), fatty acids (34 % and 41 %), sodium (21 % and 28 %), and empty calories (56 % and 47 %) in the older and younger women, respectively; total fruit (52 %), whole fruit (66 %), total vegetables (52 %), and greens and beans (58 %) in younger women; and whole grains (67 %) in older women. Both groups reached the maximum possible score for total protein. Maximum possible scores were observed for whole fruits in the older women and for whole grains in the younger women.
The total composite HEI-2010 score did not differ significantly between groups (62 (sd 1) for older and 63 (sd 1) for younger women). Based on the total HEI-2010 score, 57 % of the older and 48 % of the younger women were classified as having a poor diet (total HEI-2010<51). Moreover, the diet of 42 % of the older and 52 % of the younger women was classified as needing improvement (total HEI-2010=51–80). Only 1 % of older women were classified as having a good diet (total HEI-2010>80).
Discussion
The present study compared the diet quality by evaluating nutrient intakes and the HEI-2010 scores of older and younger sedentary Mexican-American women who were enrolled in two social-support PA interventions conducted in the Phoenix, AZ, metropolitan area, USA. Both interventions included a large proportion of women living under disadvantaged socio-economic conditions. The interventions reported herein targeted women at two critical developmental transition times: the childbearing and midlife years (Madres and Mujeres, respectively). The comparison of women in these two life stages provides important information regarding potential health risks derived from poor dietary quality and inadequate nutrient intake during developmental transitions at which life stressors and limited time availability may negatively influence health behaviours( Reference Greiner 42 – Reference Perrig-Chiello, Hutchison and Hoepflinger 44 ).
Findings indicated that a large proportion of both the older and younger women had an inadequate intake of various nutrients, including fibre, Ca, folate, vitamin C and vitamin E. This was also reflected by both groups having low scores for some individual components and a low total HEI-2010 score. Poor conformance to dietary guidelines in the present study may not be solely related to age and cultural background but also to participants’ low socio-economic status. Nearly 60 % of participating women had an annual income <$US 20 000. It has been documented that income, education and acculturation are inversely related to dietary quality( Reference Ayala, Baquero and Klinger 12 , Reference Perez-Escamilla 15 , Reference Dubowitz, Subramanian and Acevedo-Garcia 45 – Reference Guendelman and Abrams 47 ). The sociodemographic environment of the geographic area from which study participants were recruited may have contributed to its residents’ access to traditional or familiar foods and their ability to meet current dietary recommendations. Moreover, participants were recruited from areas known to have food deserts (urban areas in which at least 20 % of residents live in poverty and at least 33 % live more than 1·6 km (1 mile) away from a grocery store)( 48 ).
Relative to older women, younger women had significantly lower HEI-2010 scores for whole fruit, total vegetables, greens and beans, and empty calories. At the same time, younger women had a higher HEI-2010 score for whole grains than older women. These findings confirm previous evidence from surveillance data of dissimilarities in dietary quality of women at different stages of life, regardless of equivalent cultural background( Reference Wakimoto and Block 16 , Reference Hiza, Casavale and Guenther 17 ). The evaluation of diet quality, using HEI-2005, in the National Health and Nutrition Examination Survey (NHANES) 2002–2003 data revealed higher scores in seven out of twelve components in older (55–64 years) compared with younger adults (18–30 years)( Reference Hiza, Casavale and Guenther 17 ). In addition, a review of six cohort and ten national cross-sectional studies showed that energy and food quantity intake decreased but nutrient density improved with age, despite absolute nutrient intake values often being below the RDA( Reference Wakimoto and Block 16 ).
Micronutrient and fibre intakes
Inadequate micronutrient intake, a potential result of low dietary quality, is a public health concern among women at different stages of life due to its consequences on pregnancy outcomes among childbearing women and maintenance of bone health and neurological functions among perimenopausal women( Reference Greiner 42 ). A large proportion of participants in both studies were at risk for intake inadequacy for the majority of micronutrients analysed. The current study did not include supplementation use in the nutrient analyses, as the main interest was to evaluate diet quality. There is a possibility that some women classified as not meeting certain recommendations may be obtaining assessed nutrients from supplements. Thus, results on dietary inadequacy and conformance to the dietary guidelines should be interpreted with caution. Intake inadequacy was observed for over 80 % of participants in both groups for dietary fibre and vitamin E, and for over 60 % of participants for vitamin C and folate. This finding is consistent with national representative data that have shown vitamins A, C and E, and total fibre to be at greatest risk for inadequacy across all life stages( Reference Moshfegh, Goldman and Cleveland 49 , Reference Marriott, Olsho and Hadden 50 ). Inadequate intakes of vitamins C and E observed in our study and by others may reflect a diet with low amount or poor variety of fruits and vegetables( Reference Hoerr, Tsuei and Liu 7 , Reference Colón-Ramos, Thompson and Yaroch 51 ). This is of importance because antioxidants commonly found in fruits and vegetables (vitamins A, C, and E, carotenoids and polyphenols) have been associated with lower chronic disease risk( Reference Stephens, Khanolkar and Bain 52 – Reference Scalbert, Manach and Morand 55 ).
The average total fibre intake observed in the present study (15·2 (sd 7·5) g/d for the older women and 13·5 (sd 7·1) g/d for the younger women) was far below current recommendations but consistent with previously reported data among older Mexican-American women (17 g/d)( Reference Gregory-Mercado, Staten and Gillespie 56 ) and US women over 18 years of age (13–15 g/d)( Reference Marriott, Olsho and Hadden 50 ). Higher intake of fibre is associated with reduced CVD risk and is recognized to decrease cholesterol, blunt glycaemic response and increase satiety( Reference Bazzano 57 , Reference Pereira, O’Reilly and Augustsson 58 ).
Mexican-American women have been reported to be at higher risk of osteoporosis and low bone mass than non-Hispanic White and Black women( Reference Looker, Borrud and Dawson-Hughes 59 ), making Ca a nutrient of interest for this subgroup of the population. In the present study, 84 % of the older and 59 % of the younger women had an inadequate Ca intake. In other observations, up to 98 % of older Mexican-American women over 50 years of age did not meet the recommended intake of Ca( Reference Gregory-Mercado, Staten and Gillespie 56 ).
Folate intake is of particular concern to childbearing Hispanic women, considering that neural tube defects are more prevalent in Hispanic women( Reference Agopian, Canfield and Olney 60 ), as is an increasing parity rate( Reference Aliyu, Salihu and Keith 61 ). The current study showed that 71 % of the older and 65 % of the younger participants had an inadequate folate intake. Results from a previous study also suggested a high prevalence of inadequate folate intake among Mexican-American women (80–90 % of women aged 25–64 years), especially among those with higher acculturation levels( Reference Dixon, Sundquist and Winkleby 62 ), potentially due to differences in food choices and exposure to folate-containing vegetables.
Healthy Eating Index-2010 and dietary quality
In the present study, both groups of women had low mean total HEI-2010 scores (62 (sd 1) for the older women and 63 (sd 1) for the younger women, relative to a maximum score of 100). Considerable improvements in dietary quality are needed in both groups of women, as nearly all of the women had a total HEI-2010 score lower than 80( 35 ). Nevertheless, a recent report using dietary data from a nationally representative sample (NHANES 2001–2002 and 2007–2008) suggested that at the population-level HEI-2010 total score (53) was lower than those observed in the current study( Reference Guenther, Casavale and Kirkpatrick 63 ). While women from the present study had better individual scores for greens and beans, whole grains, seafood and plant proteins, and refined grains than those reported for the general population, their scores were worse for sodium intake.
Adequacy components of the Healthy Eating Index-2010
The older women in our study had higher scores for all fruit and vegetable components than the younger women. It has been suggested that with increasing age, women become more health conscious and willing to follow a better diet to prevent or manage chronic diseases( Reference Hiza, Casavale and Guenther 17 ). In contrast, the older women in the present study had lower scores for whole grains than the younger women. This was unexpected because previous NHANES 2003–2004 data indicated higher whole grains scores with increasing age( Reference Hiza, Casavale and Guenther 17 ). Moreover, whole grains scores observed in our study (67 % of maximum score in the older and 100 % of maximum score in the younger women) are higher than those previously reported using nationally representative data (13 % of maximum score for younger adults and 34 % of maximum score in older adults using NHANES 2003–2004 data)( Reference Hiza, Casavale and Guenther 17 , Reference Guenther, Casavale and Kirkpatrick 63 ). While error associated with dietary data cannot be ruled out, two additional factors could partly contribute to an overestimation of whole grains scores in the current study: (i) whereas HEI assessment from NHANES data has been generally performed using the MyPyramid Equivalents Database( 64 ), data from the current study were analysed using NDSR. The latter system has been reported to overestimate whole grains intake, which concomitantly may result in underestimation of refined grains than when using the MyPyramid Equivalents Database( Reference Miller, Mitchell and Harala 36 ); (ii) the present study included Mexican-American women only. In general, Hispanics have been reported to have higher dietary quality and consume more dietary fibre than individuals from other ethnic backgrounds( Reference Carrera, Gao and Tucker 3 , Reference Hoerr, Tsuei and Liu 7 , Reference Hiza, Casavale and Guenther 17 ).
Participants from both groups in the current study achieved the maximum score for total protein intake, as has been reported for the general US population( Reference Hiza, Casavale and Guenther 17 , Reference Guenther, Casavale and Kirkpatrick 63 ). However, poor scores were observed for the fatty acids category in both groups. The 2010 Dietary Guidelines for Americans( 32 ) encourage replacing SFA with MUFA and PUFA to attain a ratio similar to that observed in the Mediterranean diet. Such ratio requires a diet rich in vegetable oil, fish and nuts and low in animal fat( Reference Bergouignan, Momken and Schoeller 65 , Reference Willett, Sacks and Trichopoulou 66 ). In contrast, participants in the current study reported sources of fatty acids that included fatty meats, butter, mayonnaise and dairy (data not shown). NHANES data showed that Mexican Americans consumed diets with a higher content of saturated fat and cholesterol than other groups( Reference Carrera, Gao and Tucker 3 ). Hispanic women have reported dairy products and butter as the main source of saturated fat intake( Reference Sharma, Wilkens and Shen 67 ).
Moderation components of the Healthy Eating Index-2010
Individuals in both groups in the current study had considerably high scores for refined grains, indicating a low consumption. According to the Multiethnic Cohort Study, which included participants aged 45–75 years, the major contributors of refined grains among Latinos are tortilla, bread, rolls, buns and biscuits( Reference Sharma, Sheehy and Kolonel 68 ). Scores for sodium in the current study were low (less than 30 % of the maximum score) for both groups, indicating high intake. Using nationally representative data, Cogswell et al.( Reference Cogswell, Zhang and Carriquiry 69 ) reported that about 86 % of Mexican-American adults consumed Na over the recommended levels. Although women in both groups exceeded the maximum recommended Na intake of 2300 mg/d( 32 ) by only about 250–300 mg/d, Na density of the diet was elevated, given the relatively low energy intake reported by both groups.
Despite low reported total energy intake, both groups had low scores for empty calories (56 % of maximum score for older women and 47 % of maximum score for younger women). This suggested mainly a high intake of solid fat and added sugars, as alcohol consumption was very low. The higher score for empty calories observed in the older women, relative to that of younger women, was in part attributed to a significantly lower intake of added sugars (11 % and 17 % of energy from added sugars in the older and younger women, respectively), as has been reported for the general US population( Reference Welsh, Sharma and Grellinger 70 ). Sharma et al.( Reference Sharma, Wilkens and Shen 67 ) reported that regular soda and other fruit juices or drinks are the main contributor to sugar intake among Hispanic individuals. In the current study, sugar-sweetened beverages contributed 28 % and 44 % of all added sugars in older and younger women, respectively.
Fifty per cent of the older participants were born in the USA, while most (79 %) of the younger participants were born in Mexico (P<0·001). Although acculturation has been reported to influence dietary intake( Reference Ayala, Baquero and Klinger 12 , Reference Perez-Escamilla 15 ), the current analysis was not adjusted for acculturation because of missing data. Nevertheless, the differences in acculturation between the two groups were based on language use, and not on the cultural dimensions more likely to affect diet. The subtle differences between the younger and older Mexican-American women may be related to residence time in the USA, as shown in research that related acculturation to diet intake and changes in food availability and intake following migration( Reference Himmelgreen, Romero Daza and Cooper 71 , Reference Guarnaccia, Vivar and Bellows 72 ).
Study limitations
The present study has some limitations. The HEI-2010 evaluates conformance to the Dietary Guidelines for Americans 2010( 32 ), but is not necessarily predictive of health outcomes( Reference Kant 31 ) and may not appropriately reflect the needs and dietary patterns of cultural specific subgroups( Reference Tucker 73 ). Mean total energy intake was lower than what has been reported among US adult women (7544 (sd 59) kJ/d (1803 (sd 14) kcal/d) according to NHANES 2009–2010 data( Reference Ford and Dietz 74 )), particularly considering that participants from the present study were overweight or obese, albeit sedentary. Food intake under-reporting is a major dietary assessment challenge that is highly prevalent, particularly among Hispanics, overweight and obese individuals, and women( Reference Neuhouser, Tinker and Shaw 75 , Reference Bothwell, Ayala and Conway 76 ). This limitation was addressed by calculating the HEI-2010, which uses an energy-density approach to assess dietary quality independent of an individual’s energy intake( Reference Guenther, Casavale and Reedy 33 ). Moreover, to avoid overestimation of the proportion of the group at risk for nutrient inadequacy, EAR values (rather than RDA values) were used as cut-off points for nutrient requirements( 30 ). Nevertheless, given the general difficulty in meeting nutrient recommendations at energy levels below 6694 kJ/d (1600 kcal/d), there is a higher probability that these individuals have inadequate intake, even when achieving maximum HEI-2010 scores( Reference Guenther, Casavale and Kirkpatrick 63 , Reference Britten, Cleveland and Koegel 77 ).
Finally, diet data included only one 24 h recall from the older women. Data from a single 24 h recall are not representative of participant’s usual intake, as it does not account for within-person variation in daily intake. Although more than one recall would have been preferable, a single 24 h recall is considered a valid method for measuring nutrient intakes of groups( Reference Thompson and Byers 78 ). While one dietary recall may be less precise and have a larger standard deviation than the average of three dietary recalls, the relatively large total sample (n 263) mitigates this loss of power.
Conclusion
In conclusion, the current study provides new information regarding dietary quality of older and younger Mexican-American women free of chronic disease. As the rate of obesity among this subset of the population continues to increase( Reference Flegal, Carroll and Ogden 79 ), addressing inadequacies in food intake to help develop future interventions is of great importance. In addition, the current study used the recently updated HEI-2010( Reference Guenther, Casavale and Reedy 33 ) that measures the compliance to the Dietary Guidelines for Americans released in 2010( 32 ).
Despite differences in some of the individual HEI-2010 components, the overall HEI-2010 score suggests that both groups of Mexican-American women would benefit from dietary quality improvement. Overall, diet quality did not satisfy US dietary guidelines. Intervention strategies targeting Mexican-American women at these critical developmental periods are needed. Effective interventions could increase the awareness of Mexican-American women concerning which dietary patterns they are, by virtue of their age, likely to consume that may compromise their health, especially if they account for variations in diet quality as women transition through different stages of life to prevent diet-related chronic diseases. To address the issues identified herein, dietary interventions for women of childbearing age should emphasize fruit and vegetable intake, whereas interventions for older women should focus on whole grains and low-fat dairy. Regardless of age, nutrition interventions with Mexican-American women should address the replacement of SFA with MUFA and PUFA, and the selection of nutrient-dense foods, limiting solid fats, added sugars and sodium.
Acknowledgements
Acknowledgements: The authors thank Drs Cristina Barroso and Nancy Moore for reviewing this manuscript. Financial support: The data for this study were collected with support from the National Institutes of Health, National Institute of Nursing Research (NIH/NINR; grant number 1 R21 NR010126-01A1); Mujeres en Accion (Walking in Hispanic Women), NIH/NINR (grant number 1 R01 NR010356-01A2); and Madres para la Salud (Mothers for Health), NIH/NINR (grant number 3 R01 NR010356-02S1). Research assistance for data analysis and manuscript development was provided by training funds from the National Institute on Minority Health and Health Disparities of the National Institutes of Health (NIMHD/NIH; award number P20 MD002316). This material is the result of work supported in part by the Department of Veterans Affairs. The content is solely the responsibility of the authors and does not represent the views of the NIH, the Department of Veterans Affairs or the US Government. Conflict of interest: None. Authorship: G.A.P.P. and S.V.-L. contributed equally to the work presented in this manuscript. G.A.P.P. contributed with data collection, data analysis and manuscript preparation. S.V.-L. was involved in study design, data analysis and interpretation, and manuscript preparation. C.K. was involved in study design and manuscript preparation. M.B. was involved in conducting statistical analysis and assisted with data interpretation. A.N.W. contributed to data collection and manuscript preparation. B.A., K.R., D.C. and P.P. were involved in study design and manuscript preparation. Ethics of human subject participation: This study was approved by the Institutional Review Board at Arizona State University.
Supplementary material
To view supplementary material for this article, please visit http://dx.doi.org/10.1017/S1368980014003085


