Introduction
Legumes are ecologically as well as economically important plants. They play a key role in the maintenance of soil fertility, particularly in dry rainfed areas, given its ability to fix atmospheric N2 (Yuvaraj et al., Reference Yuvaraj, Pandiyan and Gayathri2020). Chickpea (Cicer arietinum L.) is the fourth most important legume that provides the main source of proteins and carbohydrates in diets, being considered one of the nutritionally best composed edible dry legumes for human consumption in semiarid tropical regions (Seyedimoradi et al., Reference Seyedimoradi, Talebi, Kanouni, Naji and Karami2019). It is the second economically valuable legume pulse crop widely grown in almost all the continents. According to FAO (2021) it is grown in more than 50 countries with 17,217 million tons of production. In the average of production share of chickpeas by continents (1994–2021), Asia accounts for 84.9%, Africa for 4.7%, Americas for 4.4%, Oceania for 4.2% and Europe for 1.5%.
In Argentina, chickpea production increased from 19,500 tons in 2010 to 137,244 tons in 2020 (FAO, 2021). Domesticated chickpea has two distinct forms, desi type (small seeded, angular shape and coloured seeds with higher percentage of fibre) and kabuli type (large seeded, owl's head shaped, beige coloured seeds with a low percentage of fibre) (Singh et al., Reference Singh, Bhardwaj, Singh, Panatu, Chaturved, Rana, Rizvi, Kumar and Sarker2016). Argentina's chickpea production is almost exclusively of the kabuli type (cultivars S-156, Norteño, Kiara UNC INTA and Felipe UNC INTA), with desi type chickpea making up no more than 2% of the crop (Clera, 2019).
The loss of genetic diversity is a universal phenomenon among crops, mainly because of plant breeding (Valadez-Moctezuma et al., Reference Valadez-Moctezuma, Cabrera-Hidalgo and Arreguin-Espinosa2019). Nevertheless, there are two evolutionary bottlenecks typical of this crop: (1) the scarcity and limited distribution of the wild progenitor, C. reticulatum Ladiz, currently reported from only 18 narrowly distributed locations in the south-eastern Turkey (Berger et al., Reference Berger, Abbo and Turner2003) and (2) the shift, early in the crop's history (Early Bronze Age), from winter to spring sowing (perhaps due to ascochyta blight) and the attendant change from using rainfall as it occurs to a reliance on residual soil moisture (Abbo et al., Reference Abbo, Berger and Turner2003). This latter change was achieved by selecting against a vernalization response present in its progenitors, and implied a further loss of genetic diversity (Kumar and Abbo, Reference Kumar, Abbo and Spaks2001).
Seyedimoradi et al. (Reference Seyedimoradi, Talebi, Kanouni, Naji and Karami2019) described an extensive use of improved cultivars with close related genomes in chickpea breeding programmes. The quantification of genetic variability by molecular markers in cultivated chickpea indicated that all cultivars have a narrow genetic base (Saeed et al., Reference Saeed, Hovsepyan, Darvishzadeh, Imtiaz, Panguluri and Nazaryan2011; Upadhyaya et al., Reference Upadhyaya, Thudi, Dronavalli, Gujaria, Singh, Sharma and Varshney2011; Choudhary et al., Reference Choudhary, Khanna, Jain, Bharadwaj, Kumar, Lakhera and Srinivasan2012; Ghaffari et al., Reference Ghaffari, Talebi and Keshavarz2014; Singh et al., Reference Singh, Singh, Kapoor, Gaur, Chaturvedi, Singh, Sandhu, Singh, Bisht and Dutta2014; Hajibarat et al., Reference Hajibarat, Saidi, Hajibarat and Talebi2015). In this sense, modern chickpea breeding must be efficient and successful in the exploit and management of its genetic diversity. Understanding the real genetic variability of the chickpea collection will allow the utilization of germplasm with diverse genetic base for allelic richness in order to create new gene combinations in crossing programmes minimizing genetic vulnerability (Ghaffari et al., Reference Ghaffari, Talebi and Keshavarz2014). The use of molecular markers may provide reliable and repeatable information for diversity assessment. In chickpea, single simple repeats (SSR) have been widely used for this purpose because of different reasons: they are abundant in Cicer species genome, they are selectively neutral loci and have a high inherent capacity to resolve variability (Bellemou et al., Reference Bellemou, Millàn, Gil, Abdelguerfi and Laouar2020). Multivariate analysis has been proven useful to assess genetic structuring among a set of SSR markers, as well as to investigate the spatial pattern of the genetic variability.
The Department of Agricultural Sciences of the National University of Córdoba (UNC), Argentina, administrates the main chickpea germplasm collection in Argentina and performs a breeding project for this crop. Currently, the UNC germplasm collection has accessions comprising chickpea from regions of India, Syria, Morocco, Mexico, Perú, Spain and Russia. It also maintains local varieties such as Sauco, Criollo and Mexicano and the cultivars and accessions derived from them (Carreras et al., Reference Carreras, Allende, Rojas, Bologna, Carreras, Mazzuferi and Karlin2016).
Considering the above, a study was conducted to assess genetic variability of chickpea germplasm from the UNC germplasm collection (Argentina) by means of multivariate approaches from SSR data. The aim was also to compare the performance of hierarchical clustering and ordination techniques with model-based clustering methods. In addition, we also evaluated the correlation between chickpea accessions relationships established with both morphological and molecular data in order to provide guidance for future use of chickpea entries in the breeding programme.
At the same time, the discriminating power and effectiveness of a set of SSR primers for chickpea genotype was studied in order to determine the optimal SSR primer combination to ensure unambiguous identification of a sample of genotypes from the Argentina chickpea germplasm bank.
Materials and methods
Plant materials
The chickpea material was made up of 53 accessions from the germplasm collection of the Department of Agricultural Sciences of the UNC, Argentina. Accessions were chosen because of some agronomic merits. Names, pedigree and origin of studied genotypes are presented in Table 1. The nomenclature of accessions from the ICARDA (International Centre for Agricultural Research in the Dry Areas) starting with numer 25 RILS (Recombinant Inbreed Lines) from IFAPA (Instituto de Investigación Agraria y Pesquera de la Junta de Andalucía, Spain) and UCO (Córdoba University, Spain) obtained from intraspecific crosses (CA2990xWR315 and JG62xILC72) were named with letters ‘M’ and ‘J’, respectively. Material included the Spain cultivars ‘Juano’ and ‘Pringao’, accessions named as MEX because of its Mexican origin, and the Argentinian cultivars Chañaritos S-156, Norteño, Kiara UNC-INTA, Felipe UNC-INTA.
Table 1. The chickpea cultivars/genotypes used as a plant material in SSR analyses

The plants were grown in pots at 26/22°C (day/night) temperature and 65 ± 5% relative humidity in a growth chamber for 21 days.
DNA isolation
Total genomic DNA was extracted from individual plants (100 mg of young and healthy leaves) using the NucleoSpin kit (genomic DNA from plant – NucleoSpin® Plant II) following the manufacturer's instructions. DNA concentration and quality were measured by means of a NanoDrop 1000 Spectrophotometer (Thermo Scientific, Waltham, MA, USA) and used for PCR analysis in final concentration of 40 ng/ml.
SSR profile and genotyping
Fifteen previously published genomic-SSR primers were chosen based on map position (Winter et al., Reference Winter, Pfaff, Udupa, Hüttel, Sharma, Sahi, Arreguin-Espinoza, Weigand, Muehlbauer and Kahl1999; Lichtenzveig et al., Reference Lichtenzveig, Scheuring, Dodge, Abbo and Zhang2005; Sethy et al., Reference Sethy, Shokeen, Edwards and Bhatia2006; Millan et al., Reference Millan, Winter, Jungling, Gil, Rubio, Cho, Cobos, Iruela, Rajesh, Tekeoglu, Kahl and Muehlbauer2010) in order to ensure the representation of seven of the eight linkage groups and according to clear and sharp amplification patterns in the studied germplasm (online Supplementary Table S1). Finally, according to clear and sharp amplification pattern on these primers, 12 primers were chosen for genetic diversity analysis. PCR reaction was performed with a thermal cycler Eppendorf (Mastercycler® gradient) in a 20 μl final volume. PCR mix and thermal profiles for each SSR were carried out according to: NCPGR40, TA5, TA59, TA106 and TA200 (Jomova et al., Reference Jomova, Benkova, Zakova, Gregova and Kraic2005); NCPGR61 and NCPGR68 (Sethy et al., Reference Sethy, Shokeen, Edwards and Bhatia2006); TA30, TA130 and TA144 (Castro et al., Reference Castro, Millán, Gil, Mérida, García, Rubio and Fernández2010); H1B09 (Choudhary et al., Reference Choudhary, Khanna, Jain, Bharadwaj, Kumar, Lakhera and Srinivasan2012) and TA113 (Torutaeva et al., Reference Torutaeva, Asanaliev, Prieto-Linde, Zborowska, Ortiz, Bryngelsson and Garkava-Gustavsson2014). To examine the reproducibility and to confirm band patterns, each of the amplifications was repeated at least twice by independent PCRs. Amplification products were separated on denaturing polyacrylamide gels (6%) using a GibcoBRL Model S2 Sequencing Gel Electrophoresis Apparatus (Life Technologies, Paisley, Scotland). Electrophoresis was carried out for 1.5 h at 60 W. Gels were stained with silver nitrate according to Creste et al. (Reference Creste, Tulmann Neto and Figueira2001). The resulting banding pattern was scored manually considering just those bands with strong intensity as consistent.
Morphological traits
Ten seedlings per accession were transplanted to the soil in the experimental area of National University of Salta, Argentina, located at 24°43′22″ S and 65°24′74″ W; plants were kept from April 2018 to September 2018, spaced 1.5 m between rows and 0.60 m within a row. As per the Distinctness, Uniformity and Stability (DUS) test guidelines, 17 morpho agronomical descriptors were recorded in chickpea varieties/genotypes at different stages of plant growth under field conditions: long canopy (cm), width of canopy (cm), sheet length (cm), sheet width (cm), length leaflet (cm), width leaflet (cm), number of leaflet/leaf (unit/leaf), total tall (cm), tall to the first fruit (cm), number of grains per pod (unit/pod), number of pods per plant (unit/plant), pod length (cm), pod width (cm), seed width (cm), seed length (cm), weight of 100 seeds (g) and yield per plant (kg). Five genotypes were randomly chosen 154 from each genotype for morphological.
Statistical multivariate analysis for molecular data
Both a genotypic and a binary (1 and 0) coding matrices were carried out for the genetic analysis.
Genetic variability and discriminating power
Genetic variability was estimated based on the number of alleles (Na), proportion of polymorphic loci (P) and the polymorphic information content (PIC).
To select the subset of SSR primers that produce informative profiles and to determine the discriminating power of each marker, the efficiency of an SSR primer was evaluated using the following parameters for each assay unit (U) (the product of PCR amplification obtained with one set of primers): number of banding pattern for each SSR primer (T); confusion probability (Cj = ∑i I pi((Npi–1)/N–1)), where pi is the frequency of the ith pattern, N is the sample size, and I is the total number of patterns generated by the jth assay unit; discriminating power of the jth assay unit (Dj = 1–Cj); the limit of Dj as the sample size tends towards infinity (DL = lim Dj); and the effective number of patterns per assay unit as N tends towards infinity (P) (Tessier et al., Reference Tessier, David and This1999; Belaj et al., Reference Belaj, Satovic, Rallo and Trujillo2004).
The optimal set of primer combinations for genotype identification purposes was evaluated as described by Belaj et al. (Reference Belaj, Satovic, Rallo and Trujillo2004). In the set of 53 chickpea accessions, it is possible to find N(N–1)/2 different pairs; thus, the theoretical number of non-distinguishable pairs of genotypes is given by xk = [N(N–1)/2]Ck, where Ck is the joint confusion probability and is a product of the Cj of each primer under the independence hypothesis.
Clustering analysis
Based on the genotypic data matrix, genetic distances between all accessions pairwise combinations were calculated using Prevosti coefficient. Clustering of the genotypes was performed using the UPGMA (Unweighted Pair Group Method using Arithmetic Average). A cophenetic value matrix was used to test for the goodness-of-fit of the UPGMA clustering to the distance matrix on which it was based, by means of computing the product-moment correlation (r). A second clustering validation method was performed using the R package Pvclust to estimate probability values (P-values) for each cluster using bootstrap resampling techniques. Two types of P-values, approximately unbiased P-value (AU) and bootstrap probability value (BP), were estimated to assess the uncertainty in hierarchical cluster analysis (Suzuki and Shimodaira, Reference Suzuki and Shimodaira2006). Given that this package does not allow to work with genotypic data, the binary data matrix was used to obtain a consensus tree with a number of 1000 replications.
Ordination analysis
Principal coordinate analysis (PCoA) was carried out from genotypic data matrix. Only those coordinates whose accumulated values accounted for 70% or more of the total variance were considered (Rojas, Reference Rojas, Franco and Hidalgo2003). A geometrical representation using minimum spanning trees (MST) was used to facilitate the understanding of chickpea accessions relationships.
Statistical multivariate analysis for morphological data
Based on morpho agronomical data, a discriminant principal component analysis (DPCA) based on principal component analysis allowed to inference chickpea clusters using groups defined a priori from SSR data. The method involved the identification of the optimal number of genetic clusters (K) by using the find clusters function and then employed the Bayesian information criterion in choosing the optimal number of genetic clusters based on the elbow approach. This analysis was carried out with the R package adegenet in R v3.5.0 (www.R-proyect.org).
Statistic software packages InfoStat versión 2013 (Di Rienzo et al., Reference Di Rienzo, Casanoves, Balzarini, Gonzalez, Tablada and Robledo2013), Info-Gen (Balzarini et al., Reference Balzarini, Arroyo, Bruno and Di Rienzo2006) and R-Pvclust (Suzuki and Shimodaira, Reference Suzuki and Shimodaira2006) were used.
Results
Initially, 15 SSRs were tested in chickpea accessions. Of these, 12 markers produced clear and scorable profiles and were therefore used for genotyping 53 chickpea entries.
Primers detected a substantial polymorphism among the C. arietinum accessions displaying a total of 58 different alleles with fragment size ranging from 193 to 380 bp. Just one SSR was monomorphic, so the percentage of polymorphic loci was 91.66%. The number of alleles per locus varied from one to nine with an average value of 4.8. NCPGR68 and NCPGR40 amplified the minimum number of alleles, one and two, respectively, whereas the maximum was observed at SSR TA113, with nine different alleles (Table 2). Genotyping of the 53 accessions with 12 SSR markers revealed that four accessions of the total were heterozygous for some marker (accession 25141 heterozygous for H1B09, TA30, TA130, TA144 and TA200; ge3notype J-22 heterozygous for TA30 and both accessions M-27 and M-75 heterozygous for TA 113).
Table 2. Name of SSR, number of alleles, polymorphic information content (PIC), number of banding pattern (T), effective number of patterns (P), confusion probability (Cj), discriminating power (Dj) and limit of Dj as N tends towards infinity (DL) estimated in 53 chickpea accessions with 12 SSRs

The number of banding patterns (T) per marker ranged from 1 (SSR NCPGR68) to 11 (SSR TA113). Except for the monomorphic marker (SSR NCPGR68), all SSRs showed a number of band patterns less than the effective number of band patterns as N tends towards infinity (P) (Table 2). According to Belaj et al. (Reference Belaj, Satovic, Rallo and Trujillo2004), the effective number of patterns indicates the size of an ideal population in which, given the frequencies of the patterns obtained with a marker system, all of the individuals can be distinguished. This means that with SSR TA113 (P = 7.25) almost seven patterns can be obtained when the population size tends to infinity. That is, seven chickpea accessions could be identified with the same primer.
High values of discriminating power (Dj ⩾ 0.7, PIC ⩾ 0.7), and low values of confusion probability (Cj ⩽ 0.23) were obtained for at least four evaluated markers (Table 2). The most informative and highly effective in discriminating SSR was TA113 with the highest PIC and Dj values (0.837 and 0.879, respectively) and the lowest Cj value (0.121). The joint confusion probabilities (Cx) and theoretical numbers of indistinguishable pairs of chickpea accessions (Xk) estimated with these primers (Table 3) showed that the combination of TA113 + TA114 + H1B09 + TA106 primers was effective for discriminating the 53 chickpea genotypes with a cumulative confusion probability value (Ck) of 9.60 × 10⁻⁴, with just 1.32 from the theoretical 1378 combinations of possible pairs of genotypes indistinguishable (Table 3).
Table 3. Primers optimal combination for the identification of a set chickpea accessions from UCO collection

Joint confusion probability (Ck) for the five most discriminating primers. Theoretical number of non-differentiated pairs of genotypes (Xk) for a given combination of k primers on a set of 53 accessions (1378 pairs) estimated under the hypothesis of independence of the considered primers patterns
The genetic dissimilarity coefficients computed for all of the 1378 possible pairwise comparisons of the 53 chickpea-tested genotypes varied from 0.00 (between Norteño/Kiara UNC-INTA) to 0.917 (between entre 25126/J-84, 25102/J-84 and MEX-36/J-84), with a mean of 0.58.
The dendrogram constructed from genotypic data, validated by a correlation cophenetic coefficient of r = 0.75 (P < 0.0001), did not differ in terms of clusters from that constructed with R package Pvclust from the binary matrix to estimate probability values (P-values) for each cluster in the consensus tree (Fig. 1). The approximately unbiased P-value (AU-P in red) and bootstrap probability value (BP-P in green), indicative of how strongly the cluster is supported by the data, were shown for each node, as well as the Edge numbers (in light grey) representing the order in which clusters were built (Fig. 1). The dendrogram showed two main clusters (I and II supported by 95% AU values). Cluster II included two subgroups with statistically significant bootstrap values (⩾95%).

Fig. 1. Consensus tree of 53 chickpea accessions. Values at branches are AU P-values (left, in red), BP values (right, in green) and cluster labels (bottom). Clusters with AU ⩾ 95 are indicated by the rectangles.
In the coordinate plot (PCoA), based on the genetic distances' matrix, the 53 chickpea accessions were represented by points in the Cartesian plane. The first five principal coordinates (PCs) showed eigenvalues higher than one, accounting the first three ones for 38% of the total variability (15, 13 and 10%, respectively). Due to loss of information by using a bi-dimensional space (PC1 and PC2), the distances in the plane may not correspond with the distances in the original space, leading to misinterpretation of the true relationship between germplasm entries, so an MST imposed onto the PCoA plot was used for better understanding of ordinations (Fig. 2).

Fig. 2. Minimum spanning tree (MST) imposed onto the PCoA plot. CP1 and CP2 refer to the first and second principal coordinates. The numbers in parentheses correspond to the proportion of variance explained by the principal coordinates. Blue and red circles indicate different groups in CP1 and CP2, respectively.
The first principal coordinate (PC1) separated accessions into two clearly differentiated groups (in blue), only connected by genotypes 25717 and J71 whose genetic distance was 0.41. The group on the left included, except for the accession Chañaritos, most of ICARDA genotypes (85%). The second principal coordinate (PC2) identified chickpea accessions in other two different groups (in red). The group above agrees, except for genotype M-63, with one of the subclusters that showed 100% of AU value (cluster III) obtained in the consensus tree (Fig. 1).
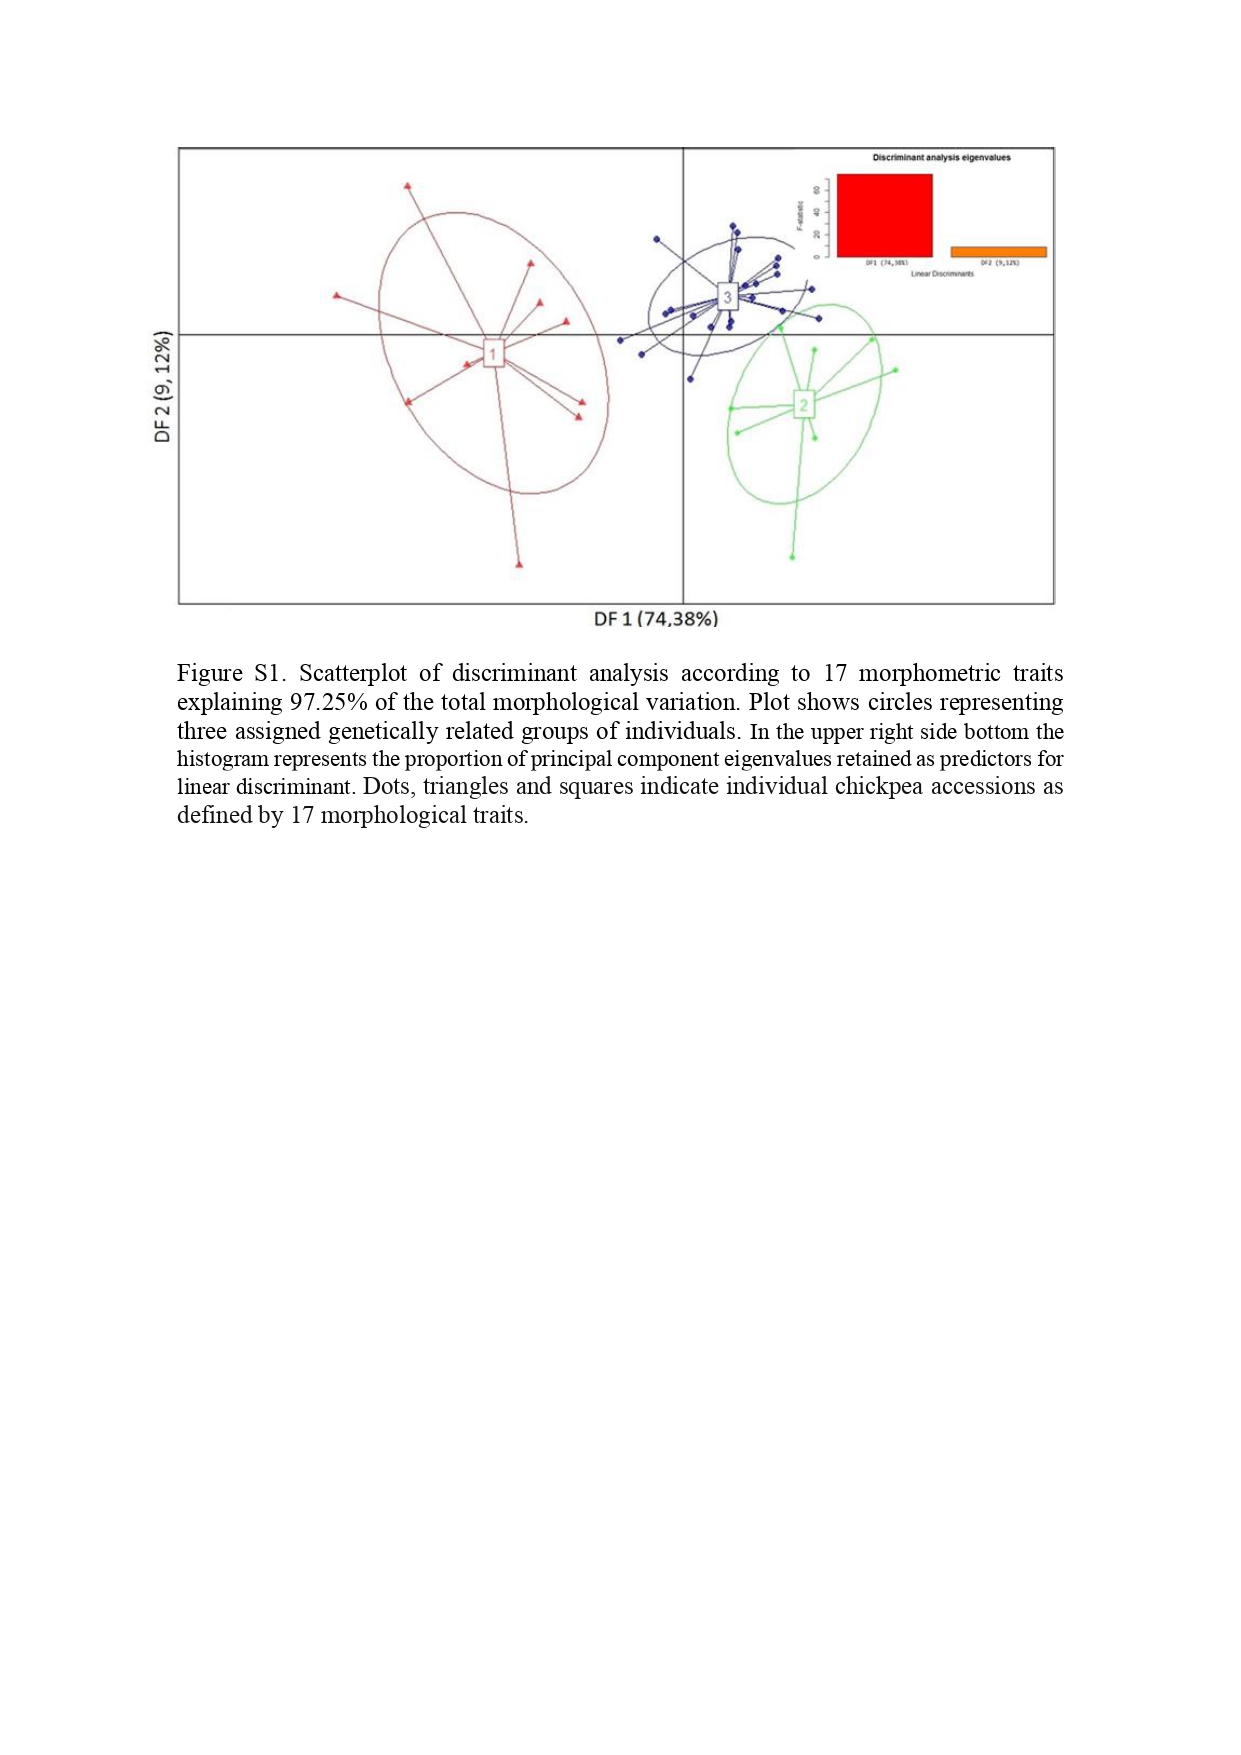
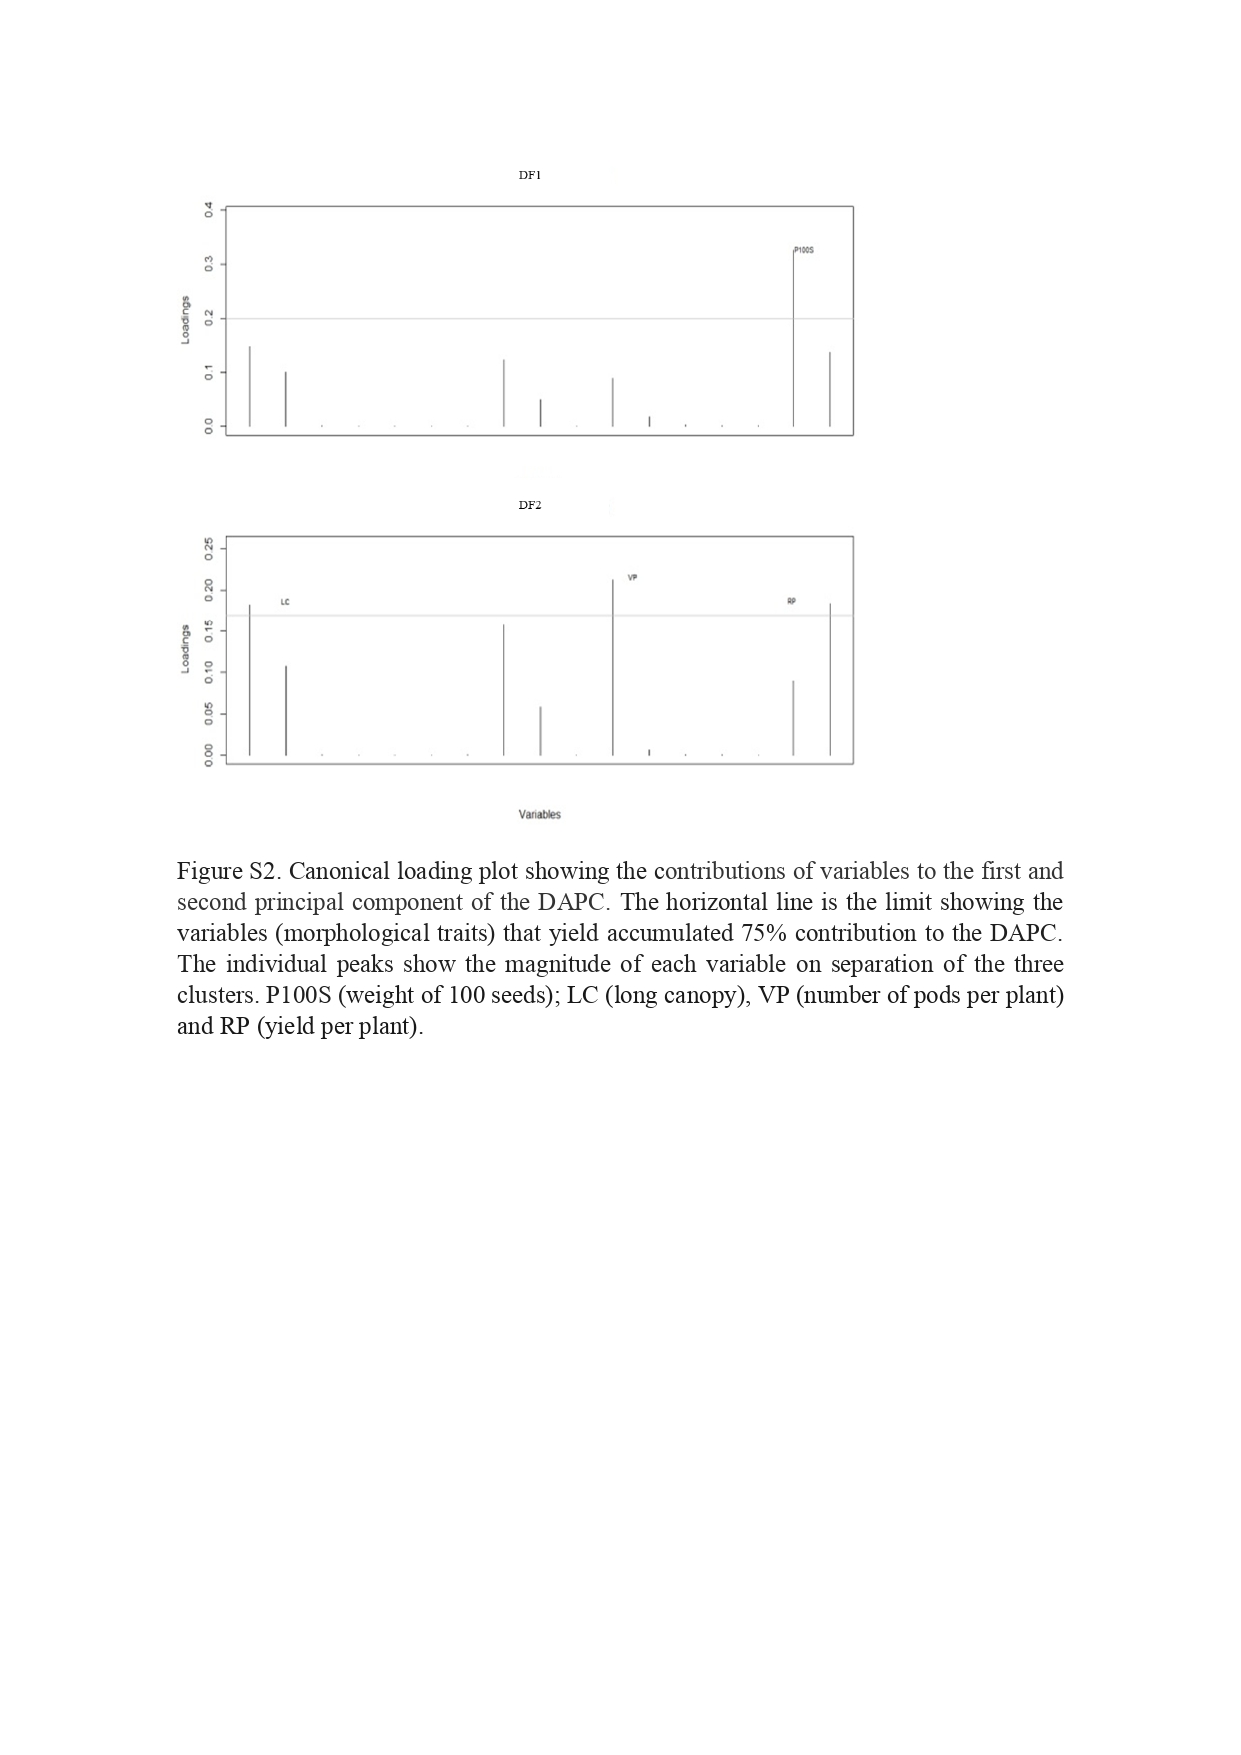
The scatterplot obtained from DPCA allowed to visualize the genetic structure based on 17 morphological traits. The optimal α-score was achieved by retaining three principal components amounting to 97.25% of the total variance. The DPCA provided two discriminant functions, the first one (DF1) accounted for 74.38% of the conserved variance and the second discriminant function (DF2) for 9.12%. The scatterplot of accessions showed three clearly differentiated clusters (online Supplementary Fig. S1). To get some insight into the underlying causes of the differentiation of the three groups, the contributions of variables were inspected to the first and second principal components of the DAPC (discriminant principal component analysis). The loading plot (online Supplementary Fig. S2) showed that, on the one hand, weight of 100 seeds (PS100) was the morphological trait that most contributed to DF1 and, on the other hand, long canopy (LC), number of pods per plant (VP) and yield per plant (RP) were those traits that most contributed to DF2.
The first component separated cluster 1 (to the left) from clusters 2 and 3 (to the right) associated with the weight of 100 seeds. Cluster 1 included material form the interspecific crosses (CA2990xWR315 y JG62xILC72) with smaller seeds. Clusters 2 and 3 comprised chickpea accessions (Mexican accessions and Norteño) with larger seeds.
Discriminant functions correctly assigned most individuals to the genetic cluster where they were assigned a priori by K means analyses used to infer the best-supported clustering solution (Fig. 3).

Fig. 3. Individual assignment probability to each cluster from DAPC. Horizontal axis shows the chickpea accession. Heat colours represent membership probabilities (red = 1, white = 0); blue crosses represent the cluster where the individuals were originally assigned by K-means analyses.
In the plot, genotypes (rows) were assigned to a genetic cluster (columns). Colours represent membership probabilities to each genetic cluster (red = 1, white = 0) and blue crosses indicate the cluster where the individuals were originally assigned by K-means analyses. While clusters 2 and 3 included 100 and 90.9% of chickpea accessions with a probability greater than or equal to 80% of membership to each group respectively, cluster 1 only showed 33.5% of the genotypes with a probability of belonging to the group greater than 80%.
The correspondence between the results of clustering obtained from the analysis based on SSR data and those found by DAPC from morphological data was moderated. The inclusion of genotypes in clusters 2 and 3 of both analyses coincided in 59 and 54%, respectively. Finally, cluster 1 obtained from both morphological and molecular data only overlapped in the Mexican genotypes and cultivar Norteño.
Discussion
The 53 chickpea accessions were characterized using 12 SSR markers located in seven of the eight linkage groups (LG) with a distribution of one to three markers per LG, satisfying the criterion proposed by The International Union for the Protection of New Varieties of Plants (UPOV) (http://www.upov.int) with regard to the genome distribution of the markers for DNA profiles of cultivars.
Despite the fact that chickpea is a self-pollinated crop, Tayyar et al. (Reference Tayyar, Federici and Waines1996) reported that outcrossing is less than 2%. Saeed et al. (Reference Saeed, Hovsepyan, Darvishzadeh, Imtiaz, Panguluri and Nazaryan2011) informed high SSR mutational rates that could result in allelic heterozygosity. These previous findings and probably seed mixtures or genetic exchange among chickpea populations could explain the detection of heterozygotes in four of the studied accessions. In this sense, Torutaeva et al. (Reference Torutaeva, Asanaliev, Prieto-Linde, Zborowska, Ortiz, Bryngelsson and Garkava-Gustavsson2014) studying 23 cultivars detected heterozygotes genotyping with nine SSRs.
According to Botstein et al. (Reference Botstein, White, Skolnick and Davis1980) markers with PIC > 0.5 are highly informative, those with a PIC value between 0.25 and 0.49 could be considered as reasonably informative and those with a PIC < 0.25 as lightly informative. Eight from the total SSRs used in this study could be considered high polymorphic since they presented PIC values greater than 0.5. As PIC estimation depends on both the number of alleles and the relative frequency of those alleles, SSR TA144, H1B09, TA106, TA30 and TA5 showed the same number of alleles but different PIC values.
SSRs have been employed to evaluate chickpea germplasm in previous studies (Cevik et al., Reference Cevik, Unyayar and Ergul2015; Sachdeva et al., Reference Sachdeva, Bharadwaj, Sharma, Patil, Soren, Roorkiwal, Varshney and Bhat2018; Seyedimoradi et al., Reference Seyedimoradi, Talebi, Kanouni, Naji and Karami2019; Bellemou et al., Reference Bellemou, Millàn, Gil, Abdelguerfi and Laouar2020; Getahun et al., Reference Getahun, Tesfaye, Fikre, Haileslassie, Chitikineni, Thudi and Varshney2021), although the number of alleles per SSR, the discriminating power and PIC values were not always consistent with the results obtained in the present study. For instance, Getahun et al. (Reference Getahun, Tesfaye, Fikre, Haileslassie, Chitikineni, Thudi and Varshney2021) genotyping 118 chickpea accessions detected 14, 7 and 22 alleles for SSR TA113, TA5 and TA 130 with an associated PIC value of 0.87, 0.65 and 0.9, respectively. Although they have detected a greater number of alleles, the PIC values are similar to those estimated in this work, except for the SSR TA130. In contrast, Seyedimoradi et al. (Reference Seyedimoradi, Talebi, Kanouni, Naji and Karami2019) informed fewer number of alleles than those detected in this study for SSR TA130 and TA59, three and two respectively. These authors obtained PIC values for these markers of 0.57 and 0.58 respectively. In our genotyped accessions, a greater discriminating power was detected for SSR TA59 (0.67). The average number of alleles per locus (4.8) did not differ significantly from that informed by Bellemou et al. (Reference Bellemou, Millàn, Gil, Abdelguerfi and Laouar2020) (5.8). On a larger germplasm collection (125 and 167 genotypes) Sachdeva et al. (Reference Sachdeva, Bharadwaj, Sharma, Patil, Soren, Roorkiwal, Varshney and Bhat2018) and Seyedimoradi et al. (Reference Seyedimoradi, Talebi, Kanouni, Naji and Karami2019) estimated fewer means (3.6 and 2.95, respectively). Compared to these reported data, our average allele numbers were lower and the PIC values were similar. This fact can be attributed to the use of fewer molecular markers and genotypes. Utilization of different population sizes and their different geographical origins might be other reasons that could account for these differences.
The evaluation of power discrimination of each primer based on the frequencies of the different banding patterns (DL) coincided with that obtained from PIC values (Table 2). This result was expected since, according to Tessier et al. (Reference Tessier, David and This1999), DL is an extension of the polymorphism information content (PIC) available from frequency of alleles. The efficiency of a given primer does not depend on the number of patterns only. Even when SSR TA106 and TA130 produced the same number of patterns (T = 6, 6 and 5 alleles, respectively), they showed different discriminating power (0.762 and 0.502, correspondingly). On the contrary, primers TA130 and TA59 with a quite different number of banding patterns had similar discrimination powers (0.757 and 0.723, respectively). This result can be explained by the frequency differences between patterns generated with these primers. A primer has a maximal discriminating power when it generates patterns at the same frequency (the isofrequency situation) (Tessier et al., Reference Tessier, David and This1999).
Except for some exceptions, individual chickpea genotypes within a cluster in the consensus tree were definitely more closely related with each other by the origin or pedigree. It is of special interest that cluster I grouped closely related ‘J’ accessions derived from interspecific crosses between desi and kabuli chickpea type (JG62xILC72 of Indian and Russian origin, respectively). At the same time, ‘J’ genotypes were grouped with ILC72, the Spain cultivars Juano and Pringao (derived from ILC72xC2156), and the Argentinian cultivar Felipe UNC-INTA. ‘J’ accessions and cultivars Juano, Pringao and Felipe have in common plants with greater height, which constitute a relevant morphological trait for mechanical harvesting. Cultivar Felipe also shares the cold tolerance trait with the rest of genotypes grouped in cluster I (Carreras et al., Reference Carreras, Allende, Rojas, Bologna, Carreras, Mazzuferi and Karlin2016). Cluster II showed two subclusters, the largest one regrouped 16 of the 21 ICARDA accessions, and the Argentine cultivar Chañaritos S-156. The second subcluster was also divided into two subgroups with a robustness of 100 and 95% of AU value. Within this cluster, the accessions tended to be grouped according to their origin and were made up mostly of the Mexican accessions. The first of these subgroups comprised genotypes named as ‘MEX’, selected from a Mexican population, which have early flowering, erect port, susceptibility to cold and to fusarium wilt. Two Argentine cultivars were included in this subgroup (Norteño and Kiara UNC-INTA). The inclusion of these genotypes in this subcluster could be due to their origin from a cross Mexicano × S-159. Genotypes ‘M’, MEX, and cultivars Norteño and Kiara UNC376 INTA share greater values of weight of 100 seeds.
The results confirmed that both multivariate data analysis methods, ordination and clustering, were complementary. On the one hand, PCoA provided a good representation of the distance between larger clusters but was not efficient in describing the distance between relatively similar genotypes. On the other hand, the clustering method allowed an accurate description of the distance between genetically very close accessions but distorted the distances between members of large groupings.
According to the diversity pattern detected in both classification and ordination methods, hybridization between genotypes accounting wide variance like ICARDA accessions (named as 25…)/J accessions and MEX accessions/J accessions would be effective for developing extreme divergent heterotic cross-combinations.
In most genotypes, DAPC classification was consistent with the original clusters defined by molecular data (blue crosses are on red rectangles). Differences in results from molecular and morphological data could be explained because SSR markers used in this study could not be associated with phenotypic variation of agronomic traits.
Several authors have shown a poor correspondence in classification and ordinations generated from morphological and molecular data. Semagn (Reference Semagn2002) explained that these differences could be due to molecular markers covering a larger proportion of the genome (including coding and non-coding regions), than the morphology. Moreover, most molecular markers are not subjected to artificial selection compared to morphological ones. In addition, most molecular markers are not subjected to artificial selection compared to morphological ones.
Conclusions
Microsatellites proved to be a suitable and reliable marker system for genetic characterization of chickpea accessions from the UNC germplasm (Argentina) because their power to detect polymorphism in closely related cultivars. Both morphologic and molecular markers included in this study were discriminative enough to differentiate among the investigated chickpea accessions. Assortment of genetically diverse parents is the most important assignment for any plant breeding actions. Great genetic variability was characterized by higher level of polymorphism with SSR markers. In view of the diversity pattern hybridization between genotypes accounting wide variance such as ICARDA accessions (named as 25…)/J accessions and MEX accessions/J 41 accessions, it is concluded that these parent combinations would be effective for developing extreme divergent heterotic cross-combinations.
Classification and ordination based on SSR tend to group accession according to their origin. It was possible to correlate associations of markers with the origin of materials. Differences in results from molecular and morphological data indicate that analyses from both genetic markers must be done in future studies because they provide complementary and relevant information for establishing genetic relationships among chickpea materials and a better description and interpretation of the available variability in the germplasm collection.
Supplementary material
The supplementary material for this article can be found at https://doi.org/10.1017/S1479262123000059