Introduction
The possibility of disintegration of large parts of the Antarctic ice sheet, either through the removal of ice shelves (which hold back the marine-based West Antarctic ice sheet) under the influence of global warming or as a result of surging of the major ice drainage basins, has been suggested on a number of occasions (Reference WilsonWilson, 1964; Reference HollinHollin, 1969; Reference HughesHughes, 1975; Reference MercerMercer, 1978). Supporting evidence of surging has been offered for the Lambert Glacier—Amery Ice Shelf system (Fig. 1), which drains about one-fifth of the East Antarctic ice sheet (Reference Budd, McInnes, Pittock, Frakes, Jenssen, Peterson and ZillmanBudd and McInnes, 1978; Reference Derbyshire and PetersonDerbyshire and Petersen, 1978; Reference AllisonAllison, 1979; Reference WellmanWell-man, 1982). However, other authors have argued against surging for this system (Reference RobinRobin, 1979, Reference Robin and Robin1983; Reference McIntyreMcIntyre, 1985a; Reference Radok, Jenssen and McInnesRadok and others, 1987).
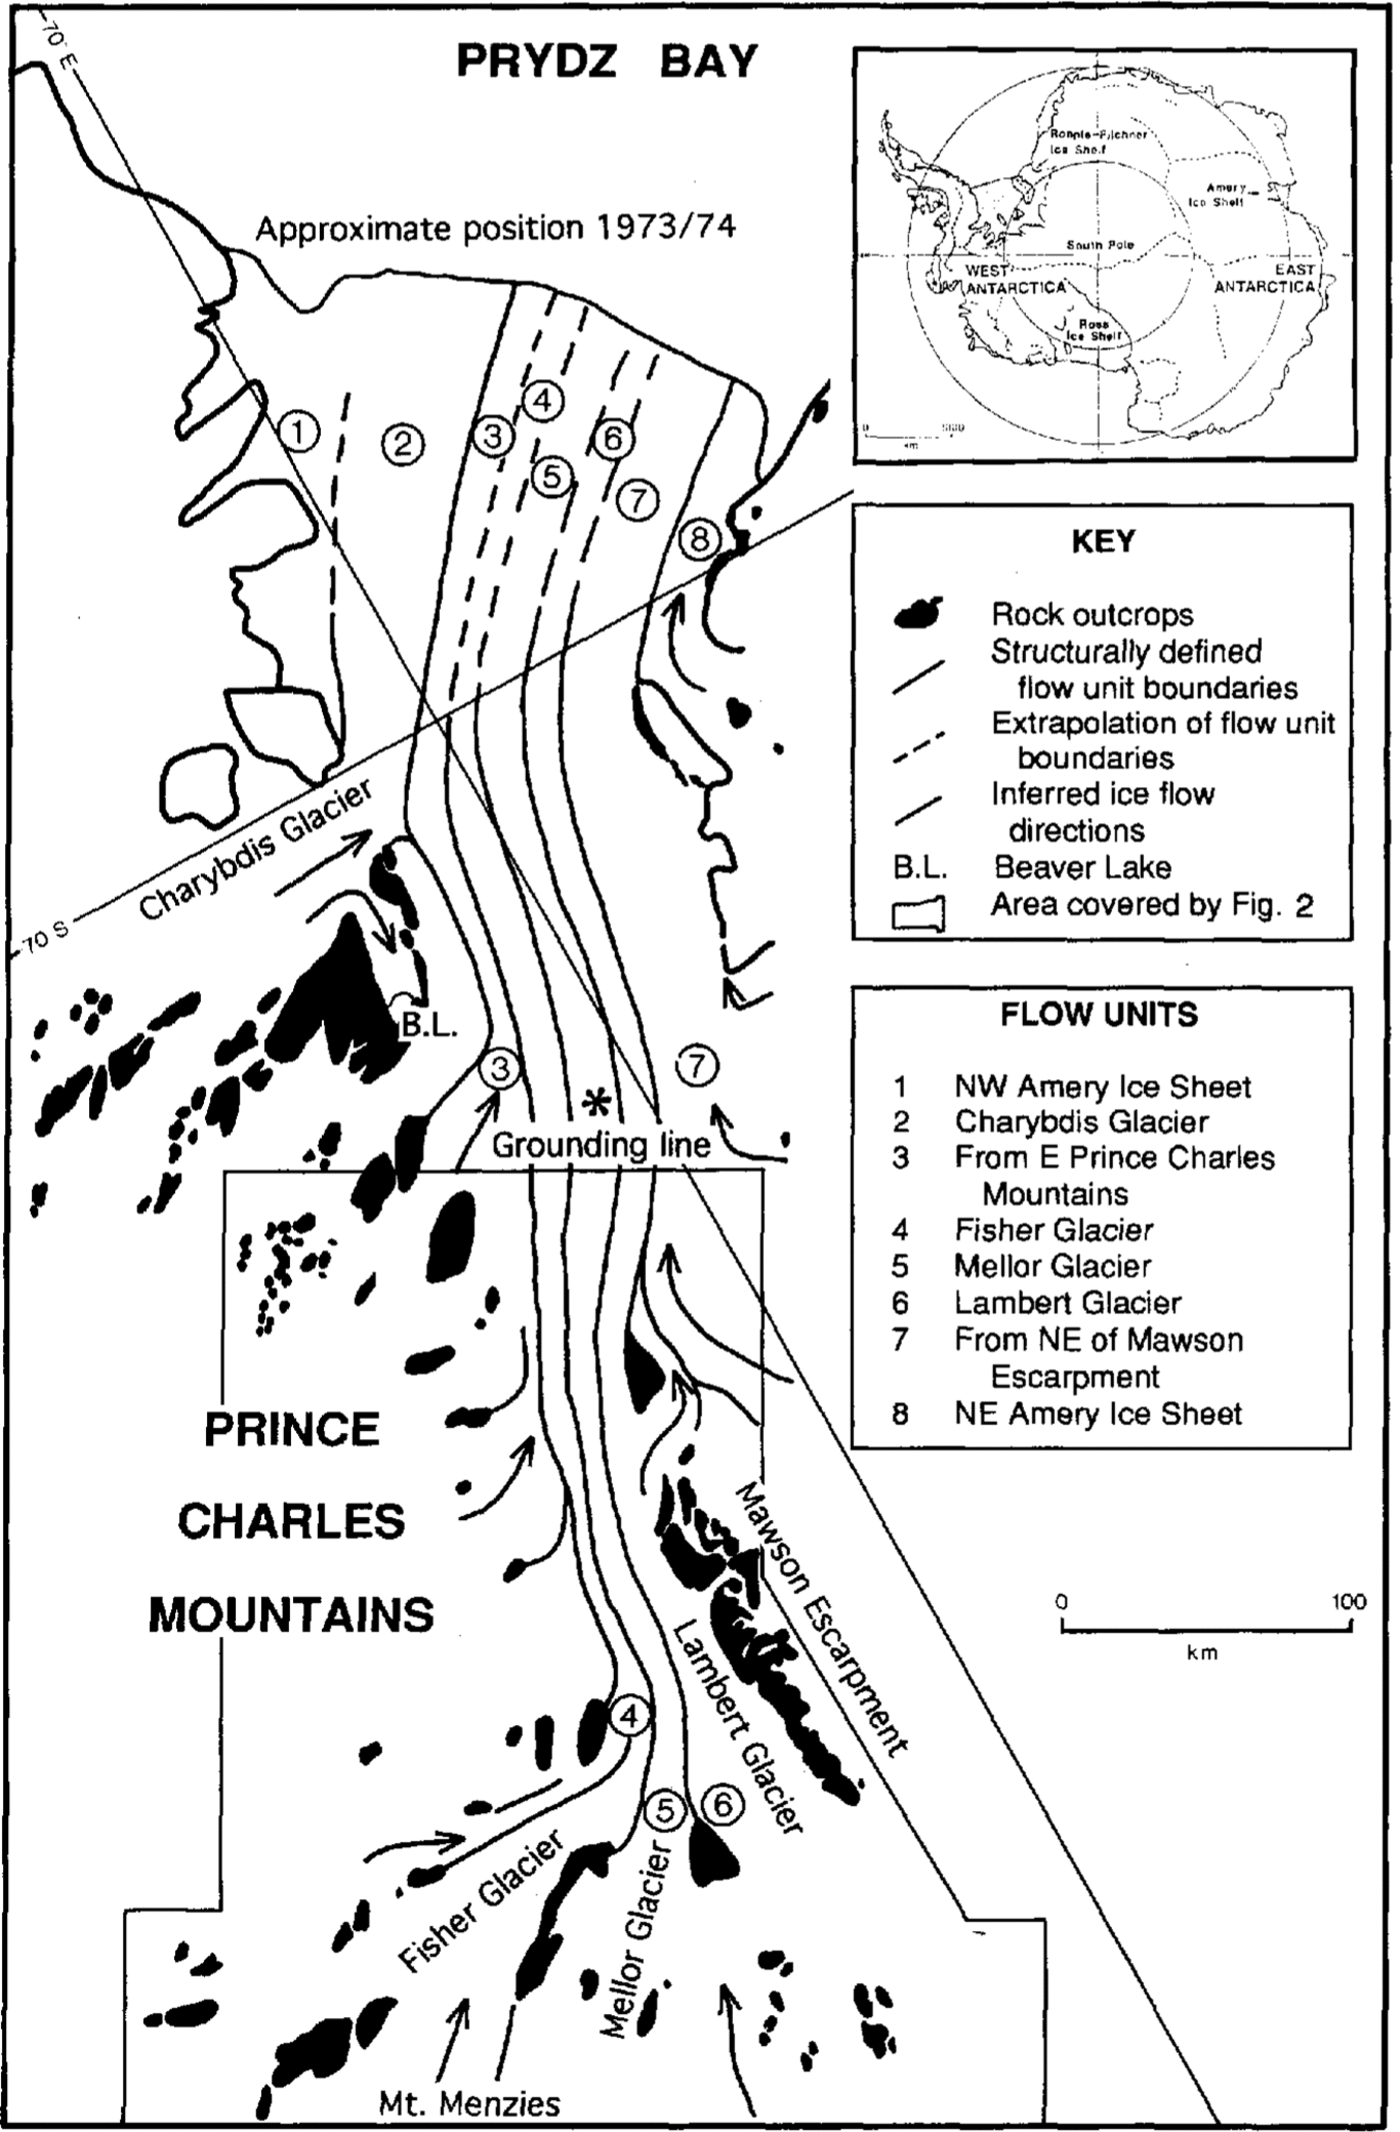
Fig. 1. Major flow units of the Lambert Glacier—Amery lce Shelf .system derived from the structural pattern revealed in satellite images (after Reference Hambrey and BarronHambrey, 1991). The grounding line is from Reference Budd, Corry and JackaBudd and others (1982). The location of Figure 2 is shown. The location of the Lambert Glacier-Amery lce Shelf system within Antarctica is shown in the inset; dashed lines represent ice divides (after Reference Drewry and DrewryDrewry 1983).
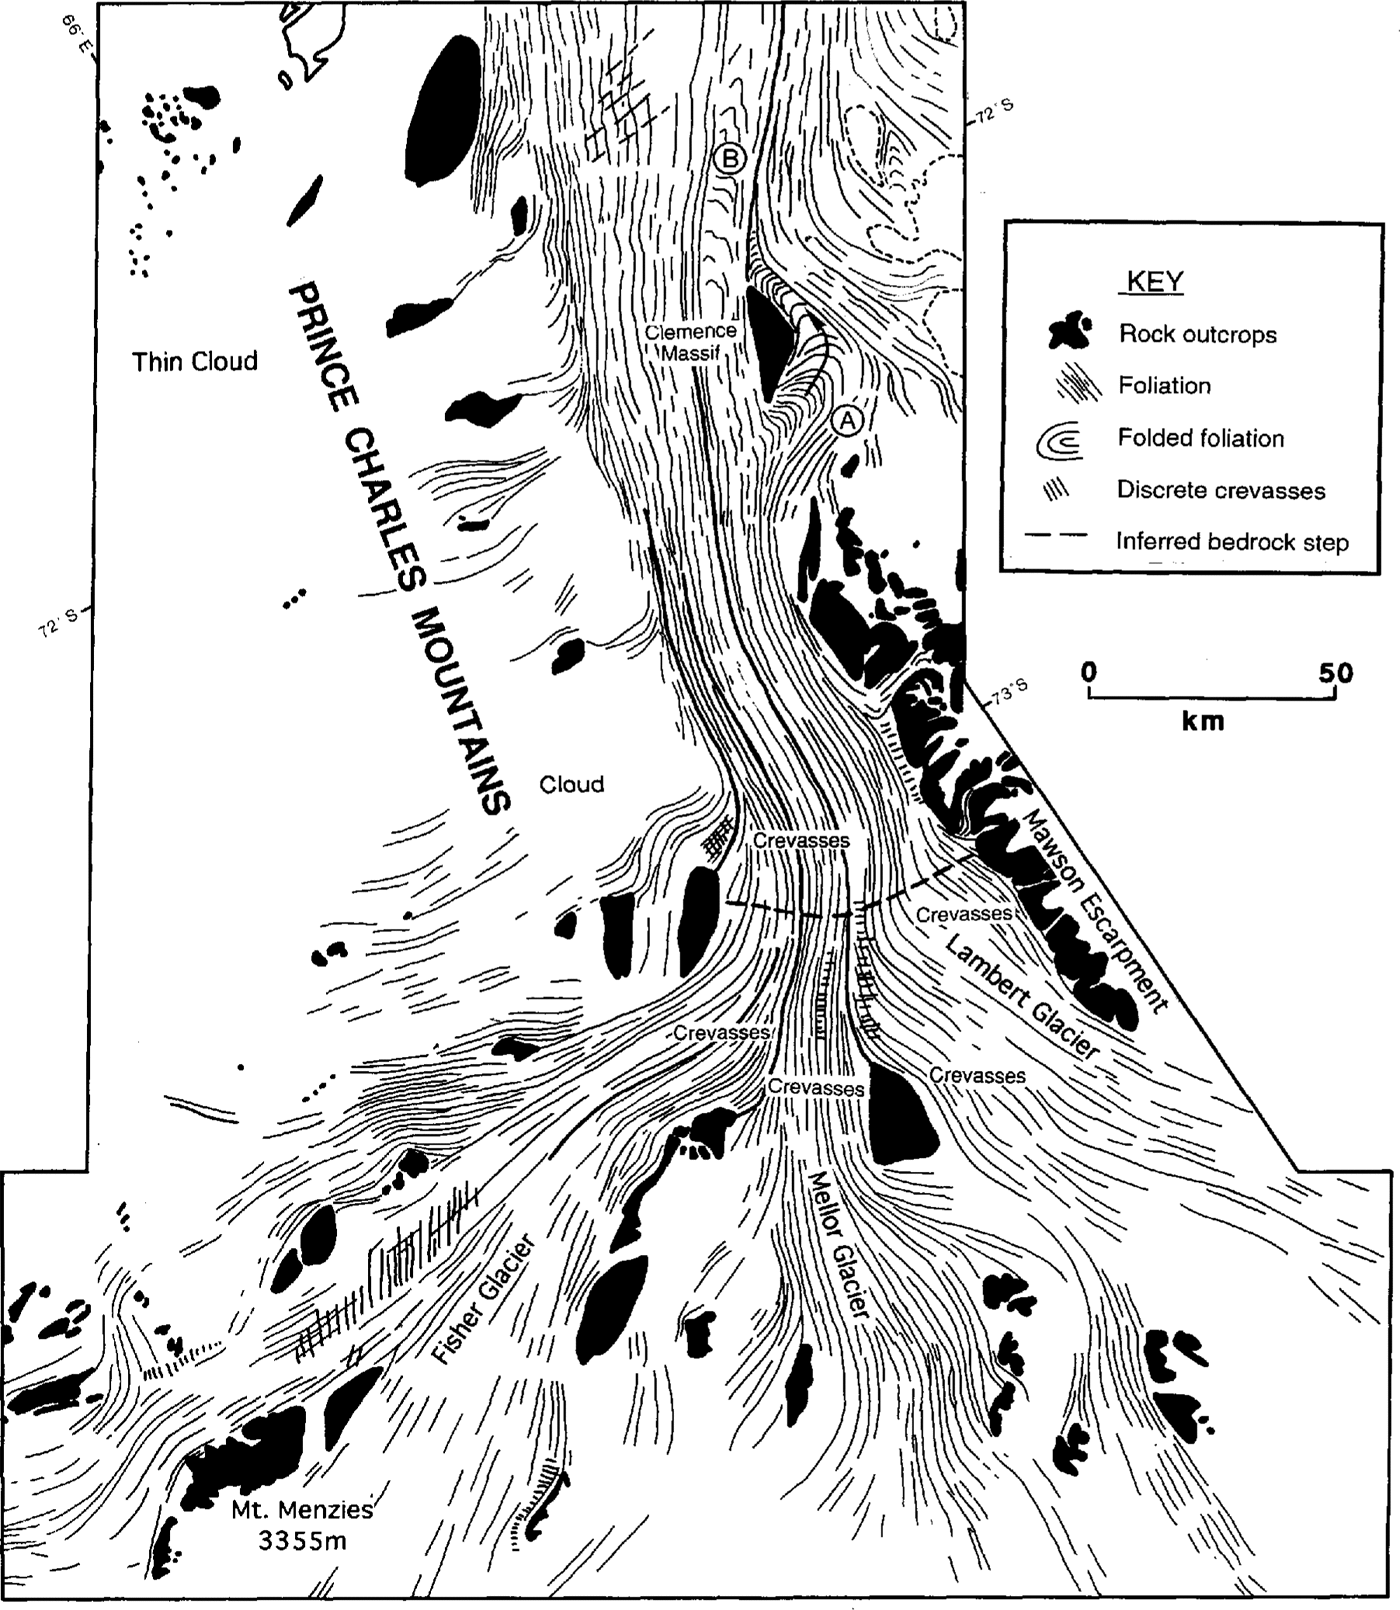
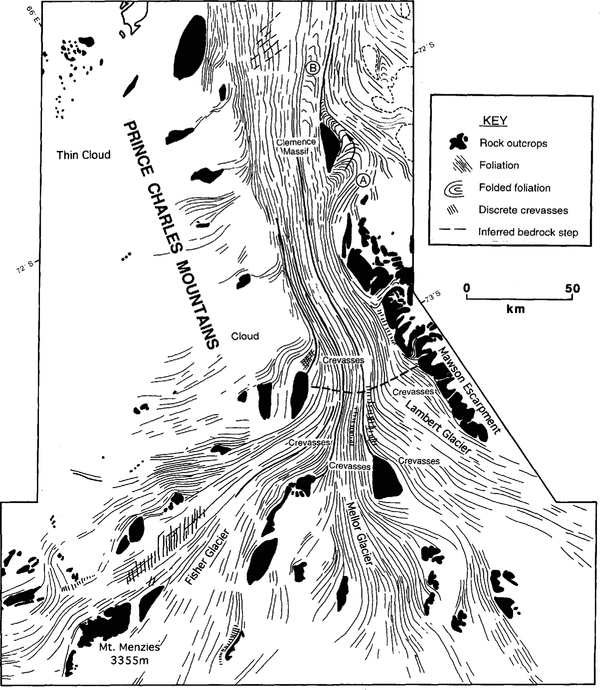
Fig.2. Structural map from satellite imagery, illustrating the dominant foliation trend, medial moraines and discernible crevasse patterns in the region where Lambert, Mellor and Fisher Glaciers merge.
The purpose of this paper is to examine the structural evolution of the Lambert Glacier-Amery Ice Shelf system in order to assess whether the system exhibits surging on a cyclical basis or has a constant flow regime. Features such as foliation, medial moraines and crevasse patterns, observable in Landsat images, may be used to determine the mode of flow of the major ice streams and outlet glaciers of the Antarctic ice sheet. These structures are most obvious where the snow cover has been removed by ablation, revealing bare glacier ice, as in the case of the Lambert Glacier system. These structures are described from an analysis of digital Landsat imagery and are discussed in the context of possible The purpose of this paper is to examine the structural evolution of the Lambert Glacier-Amery past instabilities in the flow of the system
The lambert glacier-amery ice shelf system
The Lambert Glacier-Amery Ice Shelf system is a composite feature, comprising eight structurally defined ice streams, for example, Lambert, Mellor and Fisher Glaciers, which feed into the Amery Ice Shelf (Fig 2 and Fig 3). A number of other ice streams join the main trunk glacier along its length, notably Charybdis Glacier from the west, and a large ice stream off Mawson Escarpment from the east (Fig. 1). Data on ice thickness, velocity, ice discharge and the grounding-line position have been provided by Reference Morgan and BuddMorgan and Budd (1975), Reference Budd, Corry and JackaBudd and others (1982), Reference McIntyreMcIntyre (1985a) and Reference Hambrey and BarronHambrey(1991)

Fig. 3. Digitally enhanced Landsat MSS image of the confluence region of Lambert, Mellor and Fisher Glaciers.The image is Fom path/row 134/ll2, acquired on 20 February 1974, and is approximately 70 km across. A marked break of slope, seaward of the confluence and approximately 70 km across, is marked by arrows. Ice flow in the main channel is towards the north-northeast. i.e. the top of the image.
A model of surging of the system (Reference Budd, McInnes, Pittock, Frakes, Jenssen, Peterson and ZillmanBudd and others, 1978) suggested a surge periodicity of the Lambert Glacier-Amery Ice Shelf system of 23 000 years, with major. surges lasting 250 years and velocities reaching several kilometres per year. It was further suggested that similar behaviour might be representative of other Antarctic drainage basins.
Reference AllisonAllison (1979) calculated the state of balance of the system from mass-balance and ice-flux data, and found that the mass flux for the interior part of the Lambert Glacier basin was far in excess of output into the main channel of Lambert Glacier. He regarded this imbalance as providing evidence for the build-up of ice prior to a surge. On the other hand, Reference RobinRobin (1979), Reference Robin and RobinRobin(1983) reached the alternative conclusion that the apparent imbalance may be due to strong basal melting. In a re-assessment of the area of the interior basin from Landsat imagery, Reference McIntyreMcIntyre (1985a) reduced its size from 1.09 to 0.90×10⁶km2 and further suggested that the accumulation rate was much lower than previously estimated; this had the effect of reducing the mass flux from the interior basin to a figure that almost matched the input into Lambert Glacier. Subsequent correspondence (Reference Allison, Young and MedhurstAllison and others, 1985; Reference McIntyreMcIntyre, 1985b) served to emphasize the disagreement and pointed to a need for better field data, especially concerning accumulation rates, or for alternative methods of analysis.
Most recently, an attempt has been made using a theoretical modelling approach to determine which Antarctic drainage basins were prone to surging (Reference Radok, Jenssen and McInnesRadok and others, 1987). The models demonstrated that the major Antarctic ice streams, including the Lambert Glacier-Amery Ice Shelf system, arc unlikely to surge.
Methods
Enhancement of digital satellite imagery allows specific surface features relating to structure and topography to be analysed in detail (cf. Dowdeswcll and Reference Dowdeswdell and McIntyreMcIntyre, 1987). Digital data from three Landsat Multispectral Scanner (MSS) scenes, covering the four spectral bands with wavelengths between 0.5 and 1.1µm (path/row 134/112 imaged on 20 February 1974; path/row 135/111 and 135/ 112, both imaged on 16 March 1973), were manipulated on a Sun-based image-processing system in Cambridge, and structural analysis took place on enhanced images both on screen and in the farm of hard copy.
In the absence of measurements of velocity and strain rate, the pattern of ice structures may be used to infer flow dynamics and particle paths through ice masses (Reference ReynoldsReynolds 1988,; Reference Reynolds and HambreyReynolds and Hambrey, 1988; Reference Hambrey and BarronHambrey, 1991).Despite the order-of-magnitude larger scale, there is a close correspondence between the crevasse and foliation patterns in large ice streams, such as the Lambert Glacier system, and those in valley glaciers in mountain regions (cf. Reference Hambrey and llerHambrey and Muller, 1978)
Landsat images, which clearly depict the major structures, cover Lambert, Mellor and Fisher Glaciers, and the main Lambert Glacier system north of the confluence of these ice streams (Fig. 1), areas which are critical for examining structural evidence for a variable flow regime. Satellite imagery is probably recording both the gross textural contrasts between different flow units and topographic variations. Dowdeswell and Reference Dowdeswdell and McIntyreMcIntyre (1987) have shown, through comparison of Landsat imagery and airborne altimetric data from the head of Byrd Glacier, that the surface expression of foliation may have amplitudes in excess of 10 m,
Structure of lambert glacier and its tributaries
Foliation
The dominant feature on digitally enhanced Landsat imagery of the Lambert Glacier Amery Ice Shelf system is a longitudinal structure or foliation (Fig. 2). Such structures, which in Antarctic ice masses generally are parallel to the margins of the flow unit, have previously been referred to as flowlines (Reference Crabtree and Doakecrabtree and Doake, 1980; Reference SwithinbankSwithinbank, 1988) flow stripes of uncertain origin (Reference Casassa, Jezek, Turner and WhillansCasassa and others, 1991) or flow traces originating from former shear margins (Reference Merry and WhillansMerry and Whillans 1993,). However, the structures are not always parallel to current l10w direction and, from ground observations elsewhere, it appears that they are the surface expression of the three-dimensional structure, longitudinal foliation (Reference Reynolds and HambreyReynolds and Hambrey, 1988). Longitudinal foliation commonly is parallel to medial moraines and is therefore useful in delineating individual flow units.
In the Lambert Glacier—Amery lee Shelf system, the foliation and moraine pattern indicate that, as flow units merge, their width is considerably reduced (Figs 1 3) and the foliation is intensified.
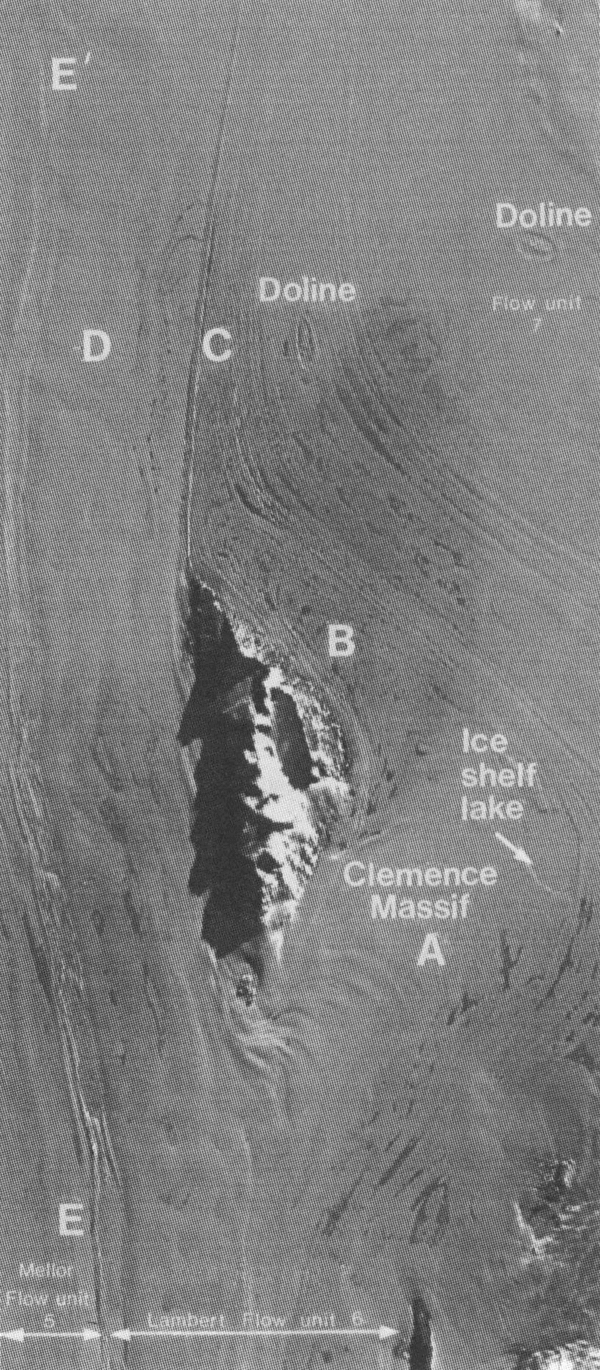
Although the foliation remains parallel to the overall direction of flow, diverging flow around Clemence Massif to the north of Mawson Escarpment (Fig. 1) deforms the longitudinal foliation into an arcuate or transverse trend as it turns northeast and flows around the eastern side of this nunatak (Fig. 4). initially, the ares are expressed at the surface as waves a few kilometres apart (Fig. 4 location A). After passing through a snow-covered area showing relatively little definition, this ice turns northwest and the arcs, now as transverse foliation, re-emerge. The arcs become progressively tighter downstream as ice flow is constrained by a major ice stream (flow unit 7). The structure here is dearly picked out by meltpoolson the ice surface (Fig. 4, location B). As the ice rejoins the main trunk glacier (Fig. 4, location C), the arcuate foliation becomes increasingly attenuated. Transposition of this structure to a new longitudinal foliation takes place in the zone of convergence. To the west of Clemence .Massif, the longitudinal foliation of the Lambert Glacier flow unit also becomes deformed, here forming faint drag-like folds (Fig. 4, location D)
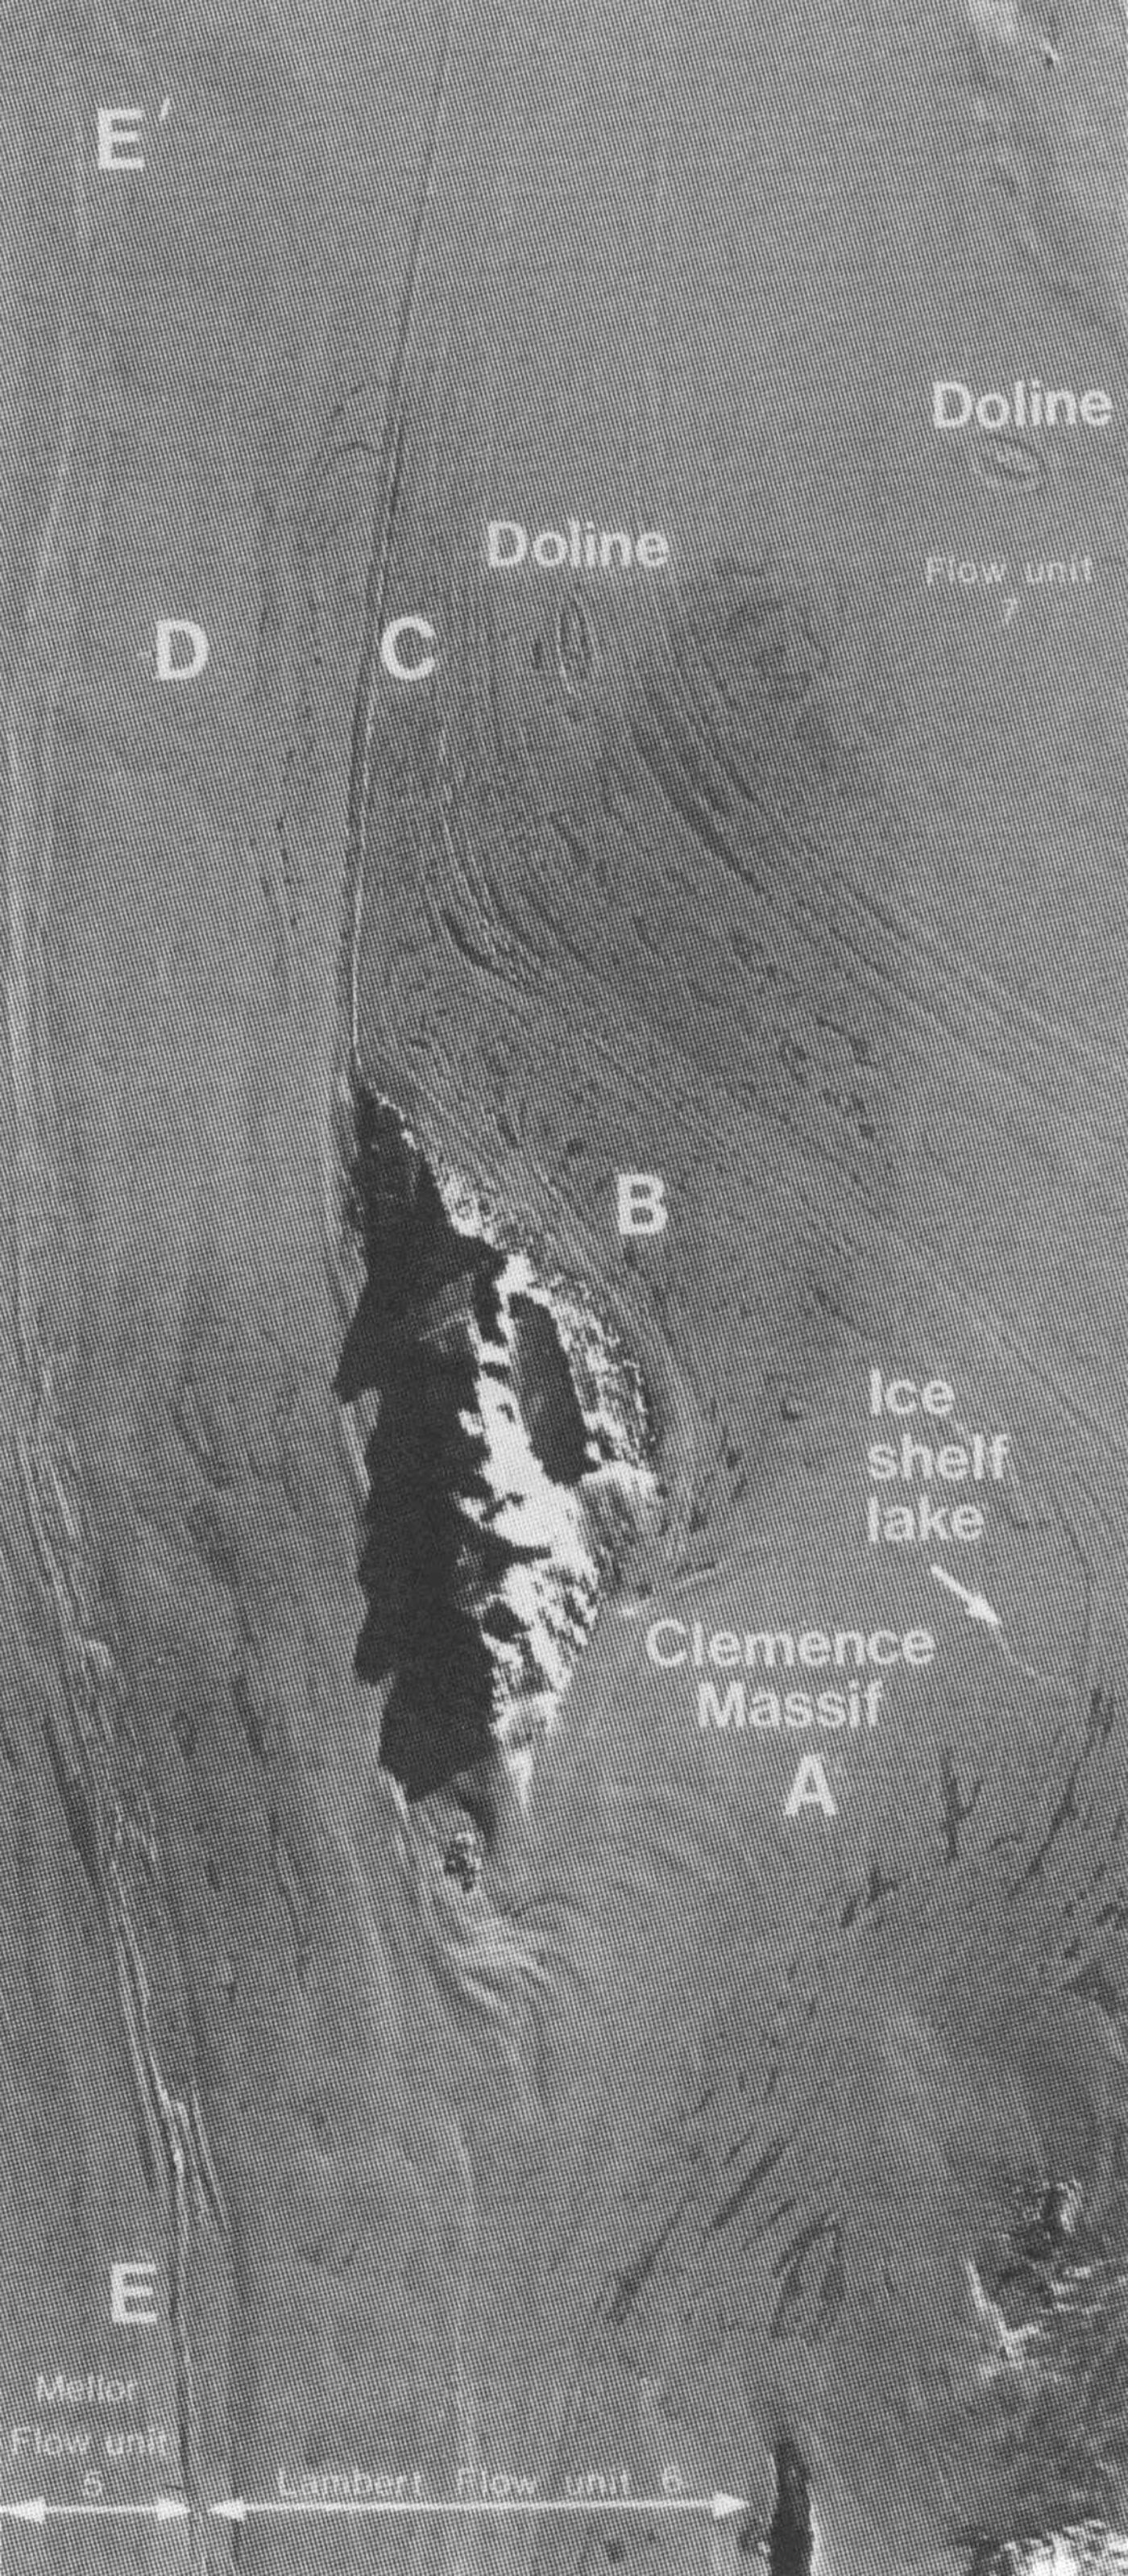
Fig. 4. Digitally enhanced Landsat MSS image of ice flow around Clemence Massif, located ill Figure 1. The image is path/row 135/111, acquired on 16 March 1974, and is approximately 40 km across. Ice flow is towards the north-northeast (top of image) in the zone to the left of Clemence Massif. Various features are labeled and discussed in the text.
Crevasses
Crevasses are widely distributed in the three ice streams, Fisher, Mellor and Lambert, that feed into the main trunk glacier called Lambert Glacier. In the first two ice streams, longitudinal zones of closely spaced transverse crevasses several kilometres wide are separated by relatively crevasse-free zones of similar width (Fig. 3). These zones are parallel to the dominant longitudinal structure and are present across the entire width of each ice stream. In Lambert ice stream, crevasse fields are more extensive and chaotic, and the zones, although still recognizable in enhanced images, are more diffuse
Soon after the three ice streams have merged, the ice passes through a transverse, concave down-glacier zone of disturbed flow (arrowed in Figure 3). Here, the crevasses are locally more intense and the longitudinal structures are slightly bent. These perturbations are probably related to a bedrock step or riegel and the ice surface has the appearance of steepening through this zone
Down-glacier, the crevasses gradually die out and, as the ice enters the narrowest part of the Lambert Glacier trough, few remain, allowing meltwater streams to flow considerable distances and lakes to form on the glacier surface. Only at the margins of the main trunk glacier, where small tributaries descend from the Prince Charles Mountains and Mawson Escarpment, are marginal crevasses developed.
Boudinage
structures on a scale of a few metres, resulting from differences in ductility within a multi-layered sequence, arc common in foliated glacier ice (Hambreyand Reference Hambrey and MilnesMilnes, 1975)
The zone between the Mellor and Lambert flow units west of Clemence Massif displays a string of mega-boudins(Fig. 4, line EE’ ). On average, these are 2km wide,thinning to 1km at the necks or breaking into discrete blocks, and are of the order of 5 km long. These mega-boudins appear to originate to the west of Mawson Escarpment to the south, and become more pronounced adjacent to Clemence Massif. Their development is probably related to longitudinal extension of the ice, first where it becomes strongly channelized and sub-sequently as it approaches the grounding zone. Mega-boudins are also evident at the boundary between the Fisher and Mellor flow units east and northeast of Fisher Massif.
Other surface features
Grounding lines or zones are often associated with a break in ice-surface slope and have been identified in a number of places around Antarctica (e.g. Reference SwithinbankSwithinbank, 1988).
Several ice-surface features, exhibited on enhanced Landsat imagery of the area around Clemence Massif (Fig. 4), suggest that the ice may be afloat at this location, considerably further south of the grounding-line position of Reference Budd, Corry and JackaBudd and others (1982). These features (Fig. 4) include: (i) a very flat feature about 6 km in length occupying a depression and having the form of an ice-covered lake, which may be connected to sub-ice-shelf waters; (ii) two elliptical depressions 3-4 km in diameter, similar to features termed "ice dolines" by Reference MellorMellor (1960) and found on several Antarctic ice shelves (Reference MellorMellor and McKinnon, 1960; Reference SwithinbankSwithinbank, 1988); these features have been interpreted as melt lakes that drain periodically through fractures to the sea beneath (Reference SwithinbankSwithinbank, 1988); (iii) large areas of ice-surface lakes, indicating the very low ice-surface slopes found in this area. Floating ice around Clemence .Massif would imply that the ice shelf extends at least 400 km inland from the terminus of the Amery Ice Shelf on the east side of Lambert Glacier.
Discussion
Does the Lambert Glacier-Amery Ice Shelf system surge?
Structural patterns in surge-type glacier systems are distinctive and differ from those in glaciers of the non-surging type (Reference Meier and PostMeier and Post, 1969; Reference PostPost, 1972). Folded and truncated foliation, and tear-drop-shaped moraines are typical. If the Lambert Glacier system, and in particular Fisher Glacier, had surged as previously supposed (Reference WellmanWellman, 1982) within the time it takes for all its ice to reach the ice-shelf edge, surge-related structures should be clearly visible in the satellite imagery. Evidence of surging in earlier times would have been preserved down-glacier if any of these flow units had surged. Velocity data suggest a residence time of ice passing along the centre line is of the order of 1000 years, a figure likely to be an order-of-magnitude greater near the margins. None of this ice shows evidence of former surging behaviour. Rather, we conclude that the structures indicate a constant flow and constant deformation regime through time (Fig. 4).
Crevasse patterns may also be used to infer whether a glacier is building up to a surge condition. During the quiescent phase of a surge-type glacier, crevasses disappear as the ice stagnates. As the ice at the head of the glacier builds up to a new surge and becomes more active, it becomes progressively more crevassed. There is a clear demarcation between heavily crevassed ice and ice which remains relatively slow moving (Reference LawsonLawson, 1989). There is no such demarcation in Lambert Glacier, further supporting the hypothesis that the (low regime is constant. This flow regime appears to have been maintained even though the ice thickness and mass balance may have changed considerably during this period.
Implications
The method of analysing Ice structures using Landsat imagery, which has been tested alongside ground observations elsewhere, has served to demonstrate that one of the major drainage basins of East Antarctica has not surged for several thousand years. In contrast, imbalances in flow have been documented for Ice Stream B, which feeds the Ross Ice Shelf from the West Antarctic ice sheet (Reference Bindschadlcr, Bindschadlcr, MaeAycal and ShahtaieBindschadler and others, 1987; Reference Whillans, Bolzan and ShabtaicWhillans and others, 1987). Surging is further suggested by the deformed nature of "flow stripes" (which we interpret as foliation) in the Ross Ice Shelf (Reference Casassa, Jezek, Turner and WhillansCasassa and others, 1991).
Satellite imagery offers the prospect of determining, from structural patterns, the flow regimes of many other parts of the Antarctic ice sheet, and establishing which, if any, part has a propensity for surging. In ice masses outside Antarctica, such phenomena are exceptional, and there is little reason to suppose that the Antarctic ice sheet is any different.
Acknowledgements
We thank the B.B. Roberts Fund of the Scott Polar Research Institute for the financial support which facilitated this work, and M.J. Sharp, 1.M. Whillans and two anonymous referees for comments on versions of this paper.


