


In the past decade, the prevalence of type 2 diabetes mellitus has been increasing steadily( Reference Roglic 1 ). Studies have shown that Asian populations, especially South Asians( Reference Misra and Khurana 2 ), have an increased risk in the development of obesity, insulin resistance, type 2 diabetes mellitus and cardiovascular diseases compared with Caucasians( Reference Ramachandran, Snehalatha and Shetty 3 – Reference Chan, Malik and Jia 5 ). The risks are further amplified by the traditional high-carbohydrate diets and lower physical activity levels observed among Asians( Reference Misra, Khurana and Isharwal 6 , Reference Phan, Alkema and Tai 7 ). In addition to increasing physical activity, it is also important to identify dietary interventions to improve insulin sensitivity for better glucose management and prevention of diabetes. Consuming a low-glycaemic-index (GI) diet has been implicated in minimising the risk of developing type 2 diabetes mellitus( Reference Schulze, Liu and Rimm 8 , Reference Willett, Manson and Liu 9 ). A simple replacement of white rice (higher GI) with brown rice (lower GI) has shown to reduce 24-h glucose and fasting insulin responses in overweight Indian adults( Reference Mohan, Spiegelman and Sudha 10 ). Similarly, the consumption of low-GI rice at breakfast showed a reduction in post-prandial glycaemic response (GR) and food intake during the subsequent meals( Reference Kaur, Ranawana and Teh 11 ).
GI is a method of characterising carbohydrate foods on the basis of how much these foods increase blood glucose levels relative to an equal amount of glucose over 2 h post ingestion( Reference Atkinson, Foster-Powell and Brand-Miller 12 ). Carbohydrate foods are classified as low (≤55), medium (56–69) and high (≥70) GI( Reference Willett, Manson and Liu 9 ). Higher-GI foods may influence glucose intolerance and/or development of type 2 diabetes. One of the proposed mechanisms is that the large incremental glucose concentration may exaggerate the body’s normal anabolic responses( Reference Ludwig 13 ). This consequently facilitates overproduction of insulin, and over an extended period of repeated exposure it results in pancreatic β-cell deficiency( Reference Ceriello 14 ). In our previous studies on healthy Chinese male population, we have shown that consuming a high-GI breakfast increased blood glucose concentrations not only after breakfast, but also throughout the entire day compared with a matched low-GI breakfast. Moreover, it has been reported that low-GI breakfast foods resulted in a significantly lower GR, which had a second meal effect on lunch, and resulted in a significantly decreased energy intake( Reference Kaur, Ranawana and Teh 11 ). This highlights the importance of consuming low-GI breakfast foods, which results in a day-long lower glycaemia. The insulinaemic index (II), similar to GI, is the insulin response to a carbohydrate-rich food. It is calculated as the incremental AUC (iAUC) of insulin from test food over 120 min compared with the iAUC of insulin from the glucose reference( Reference Wolever, Jenkins and Collier 15 ). Excessive post-prandial insulin secretion has been shown to increase oxidative stress and accelerate the decline of β-cell function especially in individuals who are at risk of developing type 2 diabetes( Reference Nimptsch, Brand-Miller and Franz 16 , Reference Mirmiran, Esfandiari and Bahadoran 17 ). Hence, the measurement of II along with GI of food is an important biomarker of the metabolic consequences of consuming a carbohydrate-rich diet( Reference Mirmiran, Esfandiari and Bahadoran 17 ). Although post-prandial glucose response is closely associated with insulin excursions, this association is not consistent especially in the presence of protein, fat, fibre and structural differences( Reference Alminger and Eklund-Jonsson 18 – Reference Juntunen, Laaksonen and Autio 20 ).
As Singapore imports over 90 % of its food owing to the limited farming grounds( 21 ), various traditional and international breakfast foods are easily and widely consumed in Singapore. Given the wide variety of breakfast cereals consumed in Singapore and this region, the GI of these breakfast foods are largely unknown. To provide scientific evidence on breakfast choices to the local populations, this study investigated the GI and II of selected Western and Asian breakfast foods consumed locally. As Western and Asian breakfast foods included in this study differed in macronutrient composition, this study also investigated how these nutrients may be associated and influence both glycaemic and insulinaemic response (IR).
Methods
Participants
The inclusion criteria were healthy Chinese and Indian men aged between 21 and 40 years, who were non-smokers with a healthy BMI between 18·5 and 25 kg/m2. Participants with metabolic diseases (such as diabetes, hypertension and so on), known glucose-6-phosphate dehydrogenase deficiency, medical conditions and/or taking medications known to affect glycaemia (glucocorticoids, thyroid hormones, thiazide diuretics), intolerances or allergies to foods, those who partake in sports at the competitive and/or endurance levels, those who intentionally restrict food intake and those whose fasting blood glucose was more than 6 mmol/l and HbA1c was more than 6 % were excluded from the study. A total of twenty-four participants were screened and twenty-two participants (eleven Chinese and eleven Indians) were recruited. Two participants failed screening owing to BMI not being within range. The study was conducted in accordance with the guidelines laid down in the Declaration of Helsinki, and all procedures involving human participants were approved by the Domain Specific Review Board of National Healthcare Group, Singapore (reference no. 2016/00614). Participants gave their informed consent before their participation.
Study protocol
The study was conducted using a randomised, cross-over design. Participants were given the option to choose between five or ten breakfast test foods. For all participants, the first three test sessions were the reference foods (50 g of glucose anhydrous powder dissolved in 250 ml of water) followed by five or ten sessions of different breakfast test foods containing 50 g of available carbohydrate in randomised order (using https://www.randomizer.org/). Five Asian and five Western breakfast test foods were selected. The five Asian breakfast foods were commercially available dry mix rice idli (India), upma (India), rice dosa (India), white bun filled with red bean paste (Singapore) and Chinese steamed white bun (Malaysia), whereas the five Western breakfast were whole-grain biscuits (USA), whole-grain biscuit filled with peanut butter (USA), whole-grain oat muesli (USA), whole-grain oat protein granola (USA) and whole-grain protein cereal (USA). These foods were chosen for their variety, cultural relevance (i.e. snacks or breakfast) and were commonly consumed in Asia. Moreover, their GI values were not reported in any established GI database. The foods were selected to represent a wide spectrum of grain type, macronutrient composition and differing form (flaked oats in muesli, milled rice in idli and so on). These are some of the factors that influence GI and II.
Nutrient analyses were conducted for all test foods, including available carbohydrate content assessed by Medallion Laboratories, and were served in portions containing 50 g of available carbohydrates (Table 1). The food was prepared freshly as per cooking instructions given on the packaging (Table 2) every morning and was served with 250 ml of water. All foods tested had ≥45 % of energy content coming from carbohydrates.
Table 1 Serving portion sizes and nutrient compositions of ten test foods (per serving of 50 g of available carbohydrate product)
Table 2 Preparation method and main ingredients of ten commercially available Western and Asian breakfast foods
Participants arrived at the centre at 08.30 hours after a 10- to 12-h overnight fast. They were advised to follow a standard dinner, and to avoid any strenuous physical activities and consumption of alcoholic beverages the day before the test sessions. After a 10-min rest, two finger-prick blood samples were collected 5 min apart to measure baseline blood glucose concentrations, and approximately 0·5 ml of blood sample was collected for insulin analysis. Another fasting blood sample was taken if the first two baseline readings were more than 0·2 mmol/l apart. Subsequently, participants were given either a reference glucose drink or a test food to be consumed within 12 min. After consumption of breakfast test foods, approximately 5 µl of capillary blood samples were collected at 15-, 30-, 45-, 60-, 90-, 120-, 150- and 180-min time points for glucose measurements, and 0·5 ml of blood sample was collected at similar time points for insulin measurements.
The methodology used to measure the GI was adopted from that described by Brouns et al. ( Reference Brouns, Bjorck and Frayn 22 ) and was in line with procedures recommended by the ISO 26642( 23 ). The blood glucose concentration in the sample was measured and recorded using the HemoCue® 201+ Glucose analyser (HemoCue Ltd)( Reference Tan, Wu and Henry 24 ). The mean intra- and inter-assay CV for glucose were 1·2 and 1·3 %, respectively.
For the measurement of blood insulin levels at baseline and every 30-min intervals, 500 µl of capillary blood (obtained from fingerprick) was collected in a Microtainer containing EDTA and chilled. Fingerpricks were made using the Accu-Check single-use lancing device (Roche). To minimise plasma dilution, fingertips were gently massaged starting from the base of the hand moving towards the tips. The blood samples were centrifuged at 6000 g for 10 min and the supernatant plasma was pipetted into Eppendorf tubes and stored in a −80°C freezer for further analysis. Insulin concentration (µU/ml) in the plasma samples was determined using the Cobas e411 immunochemistry analyzer (Roche Diagnostics). The mean intra- and inter-assay CV for insulin were 1·9 and 2·6 %, respectively.
Statistical analysis
To obtain sufficient statistical power for GI testing of a single food, a minimum of ten participants are recommended by the ISO26642( 23 ) standard and by Brouns et al. ( Reference Brouns, Bjorck and Frayn 22 ). A total of nineteen participants were therefore used in the data analysis. With reference to the present study, retrospective power calculation for a repeated measures design with ten treatments and nineteen participants, to detect significant difference between treatments with partial η 2 of 0·40 and non-sphericity correction, ε, of 0·6 resulted in a power larger than 95 %. Moreover, using the power calculation with 80 % power at 0·05 significant level, a minimum sample size of six participants would be required in the future. This indicates that sufficient participants were recruited for this present study.
The increment in GR was calculated by taking the difference of blood glucose reading at each time point and mean baseline value. The total GR over 120 min was also calculated as iAUC, using the trapezoidal rule that ignored the area under the baseline( Reference Wolever 25 ). In the case of the reference food, the mean of the three glucose tests was taken as the iAUC for the reference food. If the mean within-participant CV for three glucose drinks was >30 %, outlying values were excluded as per standard protocol( 23 ). Using the iAUC values, the GI of the test food was calculated using the following formula( 26 ):
 $$\eqalignno{{\rm GI}{\equals} & \left( \matrix{ {\rm iAUC}\,{\rm of}\,{\rm plasma}\,{\rm glucose}\,{\rm for}\,{\rm the}\,{\rm test}\,{\rm food}\,/{\rm average}\,{\rm iAUC}\,{\rm of}\,\cr {\rm plasma}\,{\rm glucose}\,{\rm for}\,{\rm the} \,{\rm glucose}\,{\rm reference}\,{\times}\,{\rm 1}00 \hfill \cr} \right).$$
The calculation of II is similar to that of GI, that is II=(iAUC of plasma insulin for the test food/average iAUC of plasma insulin for the glucose reference×100).
The final GI value of the test foods was determined by taking the average GI values of a test food from all participants. Participants whose GI value was not within two standard deviations from the mean GI value were excluded as per standard GI protocol( 23 ). The same procedures were repeated for IR and II. Simple Spearman’s correlation and partial correlation controlling for two macronutrient contents at each time was also performed to evaluate the strength of association between the GI values and macronutrient content of the test foods. All statistical analyses were performed using SPSS version 24.0 (IBM Corp.), and statistical significance was set at P<0·05, two-tailed.
Table 3 Anthropometric characteristics of the study participants (n 19, nine Chinese, ten Indians) (Mean values with their standard errors)
Results
A total of twenty-two participants were recruited (eleven Chinese and eleven Indians). Three participants were excluded from the analysis owing to incomplete test sessions (one Chinese), withdrawal of consent owing to time commitment issues (one Indian) and GR that was deemed outliers based on the ISO 26642 definition( 23 ). The final analysis of this study therefore included nineteen participants, and the anthropometric characteristics of these participants were reported in Table 3. The mean within-participant CV of GR and IR (based on iAUC) to glucose standard drinks for nineteen participants were 14·5 and 15·4 %, respectively.
Temporal changes in capillary glucose after the consumption of test meals were presented in Fig. 1. The GI of ten tests foods calculated on the basis of the iAUC are presented in Table 4. Rice idli, upma and rice dosa were categorised as high-GI foods; Chinese steamed white bun and white bun filled with red bean were categorised as medium-GI foods; and whole-grain biscuit, whole-grain biscuit filled with peanut butter, whole-grain oat muesli, whole-grain oat granola and whole-grain protein cereal were categorised as low-GI foods. The GI values of test breakfast foods were significantly and negatively correlated with overall protein (r s −0·366, P<0·001), fat (r s −0·268, P<0·001) and dietary fibre (r s −0·422, P<0·001) levels. When partial correlations were performed controlling for two other macronutrients each time, only dietary fibre content was observed to maintain its negative correlation with GI (partial correlation between GI and dietary fibre controlling for protein and fat) (r s −0·218, P=0·003). As for insulin, the post-prandial changes in insulin concentrations after meals are shown in Fig. 2 and the II of test foods are reported in Table 4. There was a significant negative correlation observed between II and overall dietary fibre (r s −0·168, P=0·021), but not with fat and protein content.
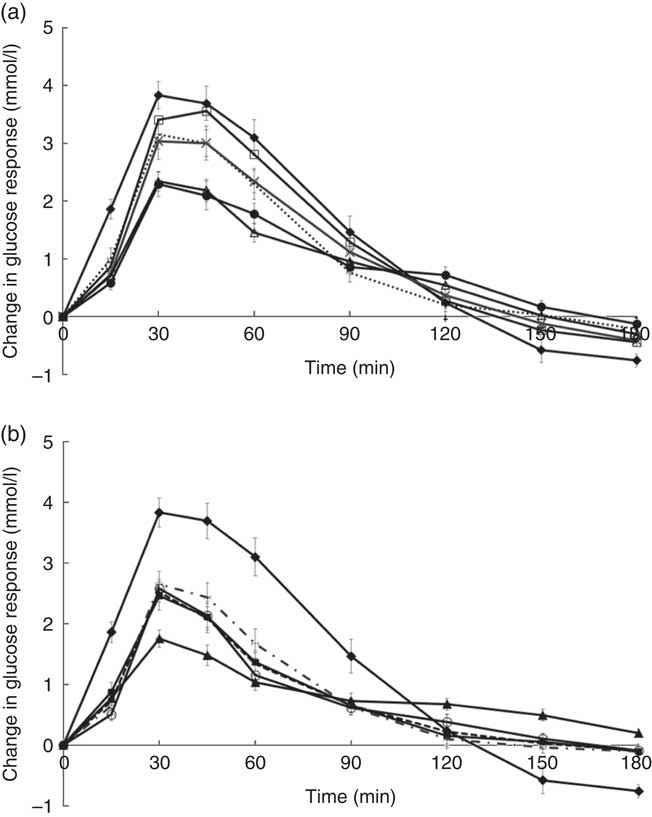
Fig. 1 (a) and (b) Temporal curves of blood glucose response to different breakfast foods containing 50 g of available carbohydrates. Values are means with their standard errors. a:![]() , Glucose;
, Glucose; ![]() , rice idli;
, rice idli; ![]() , upma;
, upma; ![]() , rice dosa;
, rice dosa; ![]() , white bun filled with red bean paste;
, white bun filled with red bean paste; ![]() , Chinese steamed white bun; b:
, Chinese steamed white bun; b: ![]() , glucose;
, glucose; ![]() , whole-grain biscuit;
, whole-grain biscuit; ![]() , whole-grain biscuit filled with peanut butter;
, whole-grain biscuit filled with peanut butter; ![]() , whole-grain oat muesli;
, whole-grain oat muesli; ![]() , whole-grain oat protein granola;
, whole-grain oat protein granola; ![]() , whole-grain protein cereal.
, whole-grain protein cereal.
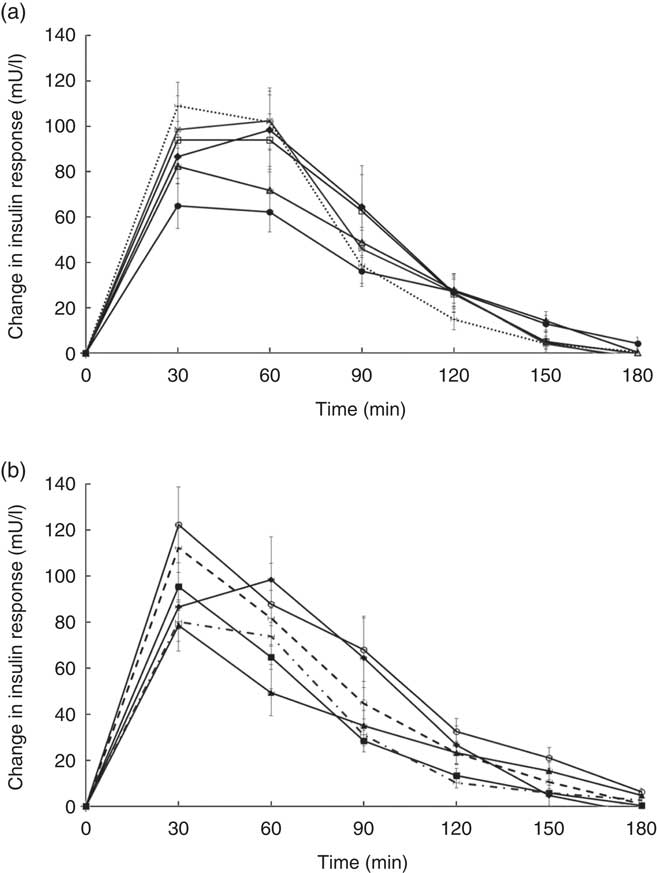
Fig. 2 (a) and (b) Temporal curves of blood insulin response to different breakfast foods containing 50 g of available carbohydrates. Values are means with their standard errors. a: ![]() , Glucose;
, Glucose; ![]() , rice idli;
, rice idli; ![]() , upma;
, upma; ![]() , rice dosa;
, rice dosa; ![]() , white bun filled with red bean paste;
, white bun filled with red bean paste; ![]() , Chinese steamed white bun; b:
, Chinese steamed white bun; b: ![]() , glucose;
, glucose; ![]() , whole-grain biscuit;
, whole-grain biscuit; ![]() , whole-grain biscuit filled with peanut butter;
, whole-grain biscuit filled with peanut butter; ![]() , whole-grain oat muesli;
, whole-grain oat muesli; ![]() , whole-grain oat protein granola;
, whole-grain oat protein granola; ![]() , whole-grain protein cereal.
, whole-grain protein cereal.
Table 4 Glycaemic (GI) and insulinaemic index (II) of ten breakfast foods (n 19) (Mean values with their standard errors)
a,b,c,dFoods that share the superscript letters are not significantly different from each other in terms of mean GI (mean II). However, the superscript letters in GI are not the same as the superscript letters in II. Repeated measures ANOVA was used to test for significant differences in mean GI (mean II) between foods.
* GI classification: low≤55, medium: 56–69, high≥70.
† Asian breakfast.
‡ Western breakfast.
Discussion
We tested the GI and II of ten commercially available Western and Asian breakfast foods in both Chinese and Indian participants. Among the ten test foods, five were of low GI, two were of medium GI and three were of high GI. Interestingly, out of all the test foods, all medium- and high-GI breakfast foods were of Asian cuisines, whereas all low-GI breakfast foods were of Western cuisines.
The high GI of both rice dosa and rice idli may be partly attributed to the larger proportion of refined rice flour compared with de-husked split black lentil flour in these foods. Refined rice has been reported to increase GI( Reference Heaton, Marcus and Emmett 27 ). This was evident from the steep glucose response peak observed at 30 min and high GI classification (Fig. 1(a)). In addition, these foods had low fat and protein content leading to a rapid increase in GR. Significant negative correlations found between GI and fat, protein and dietary fibre content supported this speculation. Moreover, our previous study has reported significant reduction in the GI of white rice when protein from chicken was added to the white rice( Reference Sun, Ranawana and Leow 28 ). Studies have shown that the presence of fat significantly reduces GR by slowing gastric emptying( Reference Gentilcore, Chaikomin and Jones 19 ) and the presence of protein increases insulin secretion( Reference Sun, Ranawana and Leow 28 ). This may explain why whole-grain protein cereal, whole-grain biscuit filled with peanut butter and whole-grain protein granola have low GI. However, for whole-grain biscuit filled with peanut butter, it is postulated that the presence of higher fat content delayed gastric emptying. This reduces the rate of glucose uptake into the circulation, which resulted in a reduced insulin response. Upma is an Indian dish that mainly consists of semolina, which is derived from wheat. Its consistency is similar to couscous. The GI of upma (GI=71) was comparable to the GI of couscous (GI=65±4) that has previously been reported( Reference Atkinson, Foster-Powell and Brand-Miller 12 ).
Despite having low fat and protein content, Chinese steamed white bun was categorised as medium GI. This may be owing to the use of frozen Chinese white bun, as studies have shown that freezing may cause starch retrogradation and the formation of resistance starch( Reference Burton and Lightowler 29 , Reference Carreira, Lajolo and Menezes 30 ). This reduces starch digestion, which may reduce GR. This may also explain the lower GI value of white bun filled with red bean paste (thawed from frozen) compared with rice dosa while having similar protein and fat composition. Of the ten foods tested, it was found that three of the breakfast/snacks were of high GI, two were of medium GI and five were of low GI. In recommending the optimal breakfast choice, consumers are encouraged to select these five low-GI foods in the first instance. If medium- or high-GI foods are selected, a recommendation to reduce the portion size by approximately 20–30 % will reduce the glycaemic load correspondingly( Reference Brand-Miller, Thomas and Swan 31 ).
Whole-grain biscuit, whole-grain biscuit filled with peanut butter and whole-grain oat muesli had the highest dietary fibre content among all ten foods (Table 1). Certain dietary fibres play a role in the modulation of GR, which lowers the overall GI of those foods( Reference Russell, Baka and Björck 32 ). The lower GI of whole-grain oat protein granola and muesli may also be explained by the structure of the carbohydrate. These products contained intact whole grains, which may lower the digestion and availability of carbohydrates. Studies have shown that the degree of processing or refining of grains results in structural differences that can have an impact on GR( Reference Juntunen, Laaksonen and Autio 20 , Reference Heaton, Marcus and Emmett 27 ). These examples showed that structural variations do affect the overall GI of the product in addition to nutrient composition.
In conclusion, this study provides GI and II values of ten commercially available Western and Asian breakfast foods. The presence of macronutrients, dietary fibre and level of grain intactness had significant influence in the overall GI of the breakfast foods. Between GI and II, it appears that II values markedly differ between subjects, making II less universally valid than GI( Reference Wolever 25 ). Consumers are therefore best advised to consume foods with low GI. The results obtained may contribute to the evolving global database of GI of foods, and may assist in the selection of lower-GI breakfast/snacks to support day-long glycaemic control among Asians who are at increased risks for diabetes.
Acknowledgements
The authors thank the participants for their participation in this study.
This research was co-funded by General Mills Inc. and Singapore Institute for Clinical Sciences, A* STAR.
C. J. H., K. K. and R. M. designed the study and critically reviewed the manuscript. W. S. K. T. and W. J. K. T. assisted in study design, obtained study data, performed the data analysis and drafted the manuscript. S.-Y. T. and S. P. analysed the data and reviewed the manuscript. All authors approved the final manuscript as submitted.
C. J. H. is the guarantor of this work and had full access to all the data in the study and takes responsibility for the integrity of the data and the accuracy of the data analysis. None of the authors has any conflicts of interest to declare.


