


Introduction
The Groningen gas field in the northeast Netherlands was discovered in 1959. Exploration resulted in the realisation that Groningen was one of the largest gas fields in the world; on the current global list it ranks ninth, with a total originally recoverable volume of gas of 2700–2800 × 109 Nm3 (EZ, 2015). Production started in 1964. After some years, subsidence of the surface above the producing gas field became apparent. This was quickly understood to originate from reservoir compaction as a result of reservoir pressure depletion. Geertsma (Reference Geertsma1973a,Reference Geertsmab), in his seminal papers on subsidence, put the phenomenon in the context of poroelastic theory as a parallel to thermoelasticity (Goodier, Reference Goodier1937; Biot, Reference Biot1956; Nowacki, Reference Nowacki1962), and applied earlier-developed nucleus-of-strain theories (Mindlin & Cheng, Reference Mindlin and Cheng1950; Sen, Reference Sen1950) to estimate the magnitude and distribution of subsidence resulting from reservoir depletion. Geertsma's nucleus-of-strain solution is equivalent to Mogi's (Reference Mogi1958) concept, which related volcanic eruptions to ground surface deformation. It is also equivalent to the inflation sources in Okada's (Reference Okada1992) calculation of stresses and displacements due to seismic events. However, Geertsma extended the approach to incorporate the areal distribution of the volume source, by using the point source solution as an influence function that is integrated over the compaction distribution over the reservoir. Segall (Reference Segall1992) extended this treatment to general axisymmetric pressure distributions.
The subsidence estimations of Geertsma critically depended on the subsurface properties. One of these is the compaction coefficient, relating the relative pressure drop to the resulting volume strain. In a linear elastic context this number can be calculated from the elastic moduli. Even here, however, care must be exercised: the scalar value of the pore compressibility depends on the stress path, which renders a direct translation of laboratory results to field conditions problematic (Hettema et al., Reference Hettema, Schutjens, Verboom and Gussinklo2000; Schutjens et al., Reference Schutjens, Hanssen, Hettema, Merour, de Bree, Coremans and Helliesen2004). Furthermore, for material that is nonlinearly elastic, viscoelastic, non-elastic or failing, a more elaborate treatment is warranted. The mechanism of compaction has attracted considerable attention. Fundamental approaches to model compaction include plastic flow, brittle failure, linear viscoelasticity and others (see, e.g., Schutjens, Reference Schutjens1991; Niemeijer et al., Reference Niemeijer, Spiers and Bos2002; Davis & Selvadurai, Reference Davis and Selvadurai2005; Brantut et al., Reference Brantut, Heap, Meredith and Baud2013; Brzesowsky et al, Reference Brzesowsky, Hangx, Brantut and Spiers2014a,Reference Brzesowsky, Spiers, Peach and Hangxb; Hol et al., Reference Hol, Mossop, Van der Linden, Zuiderwijk and Makurat2015). Other methods capture the compaction behaviour in an effective compaction coefficient, depending on time, pressure or depletion rate (De Waal, Reference De Waal1986; Mossop, Reference Mossop2012; Pruiksma et al., Reference Pruiksma, Breunese, Van Thienen-Visser and De Waal2015). The exact mechanism of compaction is not yet completely understood.
How the volumetric source in the reservoir propagates to the surface depends on the geological structure of the subsurface. Geertsma's approach was to employ an influence function applicable for a homogeneous half-space. Van Opstal (Reference Van Opstal1974; see also Tempone et al., Reference Tempone, Fjær and Landrø2010) produced a first adaptation of Geertsma's treatment, by incorporating a rigid basement, which affects the shape of the subsidence bowl. The concept of an influence function was also employed by Hejmanowski (Reference Hejmanowski1995), who used a stochastic theory resulting in a Gaussian shape rather than mechanical principles. This approach is commonly used in the mining industry, where displacements are far beyond the elastic regime in a large part of the affected volume. Atefi-Monfared & Rothenburg (Reference Atefi Monfared and Rothenburg2011) employed an influence function based on a double force, which would be valid for an inflating fracture, but their approach is not applicable to a poroelastic reservoir. Others extended Geertsma's nucleus-of-strain concept to layered subsurface (Fares & Li, Reference Fares and Li1998; Fokker & Orlic, Reference Fokker and Orlic2006; Wang et al., Reference Wang, Lorenzo-Martin and Roth2006; Vasco et al., Reference Vasco, Rucci, Ferretti, Novali, Bissell, Ringrose, Mathieson and Wright2010), possibly with viscoelastic layers. The limitation of horizontal layers could be abandoned using finite-element approaches instead of influence functions (Morita et al., Reference Morita, Whitfill, Nygaard and Bale1989; Teatini et al., Reference Teatini, Castelletto, Ferronato, Gambolati, Janna, Cairo, Marzorati, Colombo, Ferretti, Bagliani and Bottazzi2011; Orlic & Wassing, Reference Orlic and Wassing2013; Marketos et al., Reference Marketos, Govers and Spiers2015, Reference Marketos, Spiers and Govers2016). Finite-element calculations are not based on the nucleus-of-strain concept but employ a fully numerical approach. As a result, the finite-element approach is more versatile and can handle more complicated geological settings, at the cost of computing time.
Measurements of compaction and subsidence have long been recognised as a valuable source of information about reservoir properties and dynamics (Mobach & Gussinklo Reference Mobach and Gussinklo1994; Marchina, Reference Marchina1996; Du & Olson, Reference Du and Olson2001; Fokker, Reference Fokker2002; Du et al., unpublished, 2005; Muntendam-Bos & Fokker, Reference Muntendam-Bos and Fokker2009; Vasco et al., Reference Vasco, Rucci, Ferretti, Novali, Bissell, Ringrose, Mathieson and Wright2010; Zoccarato et al., Reference Zoccarato, Baù, Ferronato, Gambolati, Alzraiee and Teatini2016). Extracting this information, however, is usually a highly ill-conditioned or even ill-posed problem. Therefore, prior information or regularisation is required to obtain sensible results.
In the present paper we wish to highlight the above issues with regard to gas production of the Groningen gas field. We start by addressing the compaction behaviour observed in the Groningen gas field. Then we describe how the compaction field was constrained using an inversion methodology on observed surface movement data (Fokker & Van-Thienen-Visser, Reference Fokker and Van Thienen-Visser2016). This has consequences for understanding the geology and the reservoir dynamics. Integrating all the knowledge currently acquired, an estimate for the compaction and the subsidence for 2016 and beyond can be formulated for the scheduled reservoir exploitation scenario. An essential attribute in this prediction is its uncertainty: it is necessary to be able to give a confidence interval of the expected values, but also to be able to judge the reliability once new measurements become available. In the final section we put our results in the context of other approaches and provide an outlook for future developments.
Compaction based on geological and reservoir modelling
Gas production in Groningen started in 1964, but little subsidence was observed. After 1975, the subsidence rate accelerated (Fig. 1; Hettema et al., Reference Hettema, Papamichos and Schutjens2002). This delay in the onset of subsidence is not yet physically understood, although multiple hypotheses are currently investigated. A likely cause is that the mechanical response of the reservoir rock to pressure depletion is not linearly elastic. Another possibility is that the pressure reduction propagates only slowly into intermediate shale layers or into connected aquifers, thereby delaying the growth of the area affected by depletion.
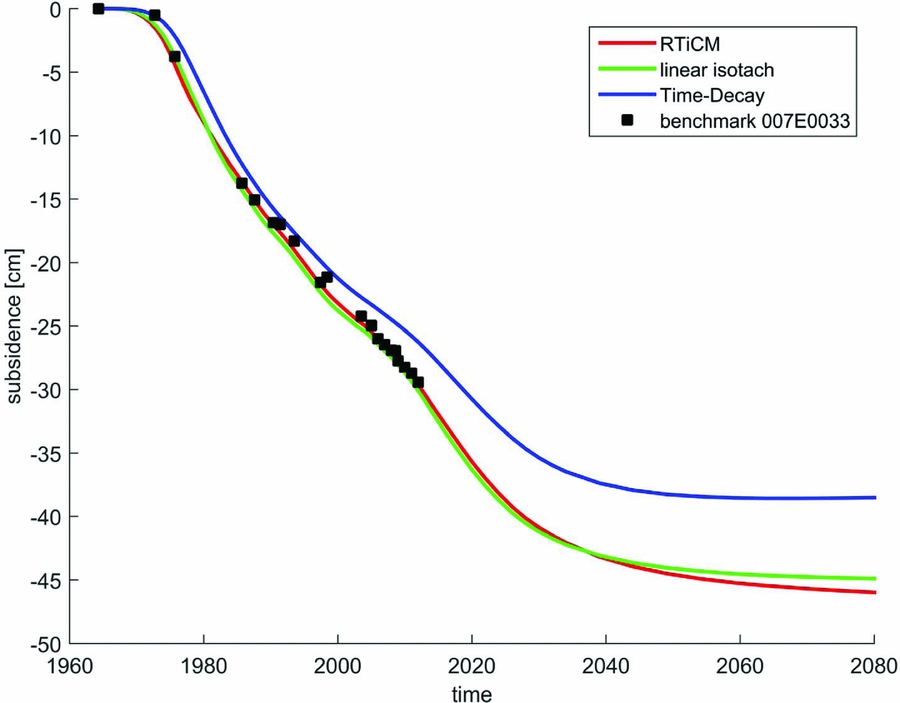
Fig. 1. Different compaction models (RTiCM, linear Isotach and Time Decay) and their fit to a levelling benchmark in the centre of the field (from TNO, 2013).
Compaction was calculated based on a dynamic reservoir model in which pressures are distributed over the field in such a way that the historic pressure and gas flow measurements are matched. This is called a forward calculation. We used NAM's (Nederlandse Aardolie Maatschappij BV's) dynamic reservoir model, based on their static geological reservoir model, for detailed information on reservoir thickness, depth and porosity values (TNO, 2013; NAM, 2016).
In a first attempt to improve our knowledge of the compaction field, three different compaction models were applied to the history-matched pressure field, propagated to surface movement and fitted to the measured subsidence. The first was the time decay model, which had been used previously in other gas fields in the Netherlands (Mossop, Reference Mossop2012; NAM 2013). The second was the Isotach model, derived from shallow geotechnical models (Den Haan, Reference Den Haan1994). The third was the Rate Type Compaction (RTiCM) in Isotach formulation. This model had been proposed in the past for Groningen (De Waal, Reference De Waal1986) and reformulated in 2013 (Pruiksma et al., Reference Pruiksma, Breunese, Van Thienen-Visser and De Waal2015). Its output contains direct (elastic) and secular (creep) strain at different production rates, more closely following the observed subsidence. The three models differ in the way they predict the final compaction as well as their response to a sudden local change in gas pore pressure. The RTiCM and Isotach models react partly instantaneously (direct strain) and partly with a delay (secular strain) that depends on the pressure and on the rate of pressure change, while for the time decay model there is no direct strain and the delayed response only depends on the time (in the order of years). The Van Opstal (Reference Van Opstal1974) nucleus solution was used to propagate compaction in the reservoir to subsidence at the surface. The benefit of Van Opstal (Reference Van Opstal1974) is the use of a rigid basement which was, in this case, varied to match the shape of the subsidence bowl. Figure 1 shows the fit to the measured subsidence using these three models for one of the optical levelling points in the centre of the field. The three employed compaction models all capture the delay behaviour at the start of production but differ in the prognosis of subsidence at the end of gas production.
The best compaction field obtained for the Groningen field in this way still comprised several areas of poor fit between the measured and modelled subsidence (Van Thienen-Visser & Breunese, Reference Van Thienen-Visser and Breunese2015). A local reduction in porosity and influence of a partially depleting aquifer seemed to point to the influence of the static and dynamic reservoir model in the compaction modelling. As a direct ‘forward’ calculation could not give compaction values in view of the large uncertainties in the reservoir, we instead chose to perform an inversion based on knowledge of the reservoir and the measured subsidence. This is described in the next section.
Compaction in 2013 obtained through inversion of subsidence data
Results from laboratory tests on the relationship between compaction coefficient and porosity show a large scatter: for a given porosity, the measured compaction coefficient typically has a variability of a factor 5 (TNO, 2013). This complicates the application of a relationship directly derived from these lab tests. Another large uncertainty is the amount of aquifer activity. The Groningen gas reservoir is connected to aquifers which may or may not respond as the reservoir depletes. Additional depletion in the aquifers will give additional compaction and, subsequently, subsidence away from the reservoir. There is thus considerable prior uncertainty in the results of the modelled compaction field.
In an attempt to integrate the knowledge available on subsidence and compaction in the Groningen gas field, we performed an inversion on the available levelling data in the area, utilising the complete information available on the geology and the pressure development in the field (Fokker & Van Thienen-Visser, Reference Fokker and Van Thienen-Visser2016). The aim of this study was to improve knowledge of uncertain reservoir parameters and thus facilitate better reservoir development and better subsidence predictions.
The subsidence inversion used the so-called double differences: the temporal differences of measured differences between different levelling benchmarks. In this way we circumvented the frequently used procedure to employ differences of estimated benchmark heights without using the full covariance matrix of the data (Marchina, Reference Marchina1996). The error made using the differences of estimated benchmark heights is particularly significant because of the procedure used to obtain benchmark heights: differences between benchmarks must be accumulated to arrive at a benchmark height with regard to a datum, and this makes heights of nearby benchmarks highly correlated (Vanicek et al., Reference Vanicek, Castle and Balazs1980; Houtenbos, Reference Houtenbos2000). Such correlations must be incorporated in the covariance matrix of the data, but given the lack of this information we chose to use the measured differences directly and construct double differences to be used in the inversion scheme.
Our inversion targeted the distribution of compaction over the reservoir without explicitly considering the underlying geological uncertainties, and without varying the geomechanical influence function within the procedure. Instead, a number of inversions were performed for different influence functions (a Geertsma function for a homogeneous subsurface (Geertsma, Reference Geertsma1973a); a Van Opstal function employing a rigid basement (Van Opstal Reference Van Opstal1974); and a function for a layered subsurface with representative layer properties (Fokker & Orlic Reference Fokker and Orlic2006)). The different influence functions, however, did not yield very different results. The update resulting from the inversion yielded areas of increased and reduced compaction relative to the existing compaction field which corresponded with areas of possible discrepancies in porosity and aquifer activity. This is highlighted in Figure 2.

Fig. 2. Field of compaction multiplication factors resulting from the inversion.
Compaction and subsidence forecasts
The previous sections have made it clear that uncertainties in the reservoir model hamper the direct calculation of compaction from the pressure depletion of the Groningen field. Using the correction factors derived from subsidence inversion makes it possible to obtain more reliable compaction and subsidence forecasts from the pressure depletion forecasts of the Groningen field. The correction factors will adjust compaction in those areas where problems with the underlying porosity or aquifer activity are present.
We used the Rate Type Compaction model in Isotach formulation previously derived (Pruiksma et al., Reference Pruiksma, Breunese, Van Thienen-Visser and De Waal2015) and applied to the Groningen field (TNO, 2013). The Rate Type Compaction model has three parameters that were fitted to the subsidence data in 2013. We used the same values for these parameters as in TNO (2013): b = 0.017, $\frac{{{\boldsymbol{c}_{{{\bf m}},{{\bf a}}}}}}{{{\boldsymbol{c}_{{{\bf m}},{{\bf ref}}}}}}$
= 0.44 and
$\frac{{{\boldsymbol{c}_{{{\bf m}},{{\bf a}}}}}}{{{\boldsymbol{c}_{{{\bf m}},{{\bf ref}}}}}}$
= 0.44 and $\boldsymbol{\dot{\sigma }}{\boldsymbol{'}_{{{\bf ref}}}}$
= 3.16 × 10⁻⁴. The
$\boldsymbol{\dot{\sigma }}{\boldsymbol{'}_{{{\bf ref}}}}$
= 3.16 × 10⁻⁴. The $\frac{{{\boldsymbol{c}_{{{\bf m}},{{\bf a}}}}}}{{{\boldsymbol{c}_{{{\bf m}},{{\bf ref}}}}}}$
gives the relation between the elastic part (direct strain) of the RTiCM model and the plastic part (indirect strain). For the compaction model we base our analysis on one realisation of the static and dynamic reservoir model; the influence of uncertainty in these models is therefore not explicitly accounted for in the compaction and subsidence workflows.
$\frac{{{\boldsymbol{c}_{{{\bf m}},{{\bf a}}}}}}{{{\boldsymbol{c}_{{{\bf m}},{{\bf ref}}}}}}$
gives the relation between the elastic part (direct strain) of the RTiCM model and the plastic part (indirect strain). For the compaction model we base our analysis on one realisation of the static and dynamic reservoir model; the influence of uncertainty in these models is therefore not explicitly accounted for in the compaction and subsidence workflows.
Figure 3 shows the compaction in January 2016 with and without application of correction factors obtained through inversion. Figure 4 shows the difference between the measured and calculated subsidence in 2011 with and without correction factors. Clearly, the introduction of correction factors has decreased the mismatch between calculated and measured subsidence – not surprisingly, since the correction factors are the result of a subsidence inversion, which used the measured subsidence as input. The largest difference between measured and calculated subsidence is in the northwestern part of the field. Also, the fit in the western part of the field, close to the city of Groningen, improved substantially (Fig. 4C). Even though the fit is substantially improved, there are still differences between the modelled and measured subsidence. This may be due to uncertainties in the subsurface model or elements that were not taken into account during the inversion, such as the presence of other gas fields (Bedum, Warffum, Kiel-Windeweer) and shallow sources of subsidence.

Fig. 3. Compaction (m) in January 2016 for the GFR 2015 v2.5 model without (A) and with (B) correction for the compaction coefficient determined from subsidence inversion.

Fig. 4. Difference (cm) between measured and calculated subsidence (in 2011) for GFR 2015 v 2.5 without (A) and with (B) correction for compaction coefficient determined from subsidence inversion. Red values indicate more subsidence calculated than measured, blue less subsidence calculated than measured. The correction is given in (C) (the difference between the values in (A) and (B)). Red indicates a correction to a lower modelled subsidence, blue indicates a correction to a higher modelled subsidence.
The computed compaction fields (Fig. 3) were used to create subsidence maps, applying the Geertsma–Van Opstal influence function (Van Opstal, Reference Van Opstal1974; TNO 2013). The input pressure distribution forecasts in space and time were taken from the dynamic model, provided by NAM (NAM, 2016). Three different production forecasts for the Groningen field were available, provided by the operator. They are characterised by a plateau rate of 21, 27 or 33 bcm (billion cubic metres) a−1 starting in 2017. Plateau length strongly depends on the plateau rate. For the 21 bcm a−1 plateau the plateau length is 15 years, for 27 bcm a−1 it is 8 years and for 33 bcm a−1 it is 5 years. At the end of the plateau period a relatively fast decline in production per year commences. After 2027 the order in the yearly production reverses: the 33 bcm a−1 plateau profile will produce less than the 27 bcm a−1 plateau profile, and the 27 bcm a−1 profile less than the 21 bcm a−1 profile. The cumulative production as forecasted for the year 2080 is virtually identical for the three profiles.
Figure 5 shows the projected subsidence in 2025 over the Groningen gas field assuming the production profiles of 21, 27 and 33 bcm a−1 plateau rate from 2017. Projected subsidence shows small differences for these production profiles, with the 21 bcm a−1 scenario leading to less subsidence in 2025 followed by the 27 bcm a−1 scenario and the 33 bcm a−1 scenario. This difference in subsidence for the production profile will disappear in 2080 since 2080 is considered to be the end of lifetime for the Groningen gas field. All gas will have been produced up to the same level of pressure depletion, hence compaction and subsidence will be similar for all production scenarios. The maximum subsidence in 2080 is 47 cm in the centre of the field close to the village of Ten Post. This part of the reservoir corresponds to the highest compaction in the field caused by a large compaction coefficient, relatively high porosity and thick reservoir layer.

Fig. 5. Subsidence (cm) from 1 January 2016 to 1 January 2025 for the scenario with 21 bcm a−1 (A), 27 bcm a−1 (B) and 33 bcm a−1 (C) plateau rate.
Discussion
In this section we wish to highlight areas where questions or uncertainties are still present, and to put the work in the context of the host of research that is performed in this realm. We follow the workflow starting from the geology and the reservoir modelling, the compaction modelling and geomechanics, to surface measurements and their interpretation. We finish the section with implications in a broader context, with a broader view on what we see as the preferred way to proceed.
Geological and reservoir models
The basis of all modelling is in the static geological description of the gas field and its surroundings, and in the dynamic reservoir models based on the static model. The set-up that we presented is based on a single geological model and a single reservoir model. This was warranted by the vast amounts of accumulated knowledge about the Groningen gas field and the pressure development in the numerous wells during the field production history since the early 1960s. However, there are still uncertainties. As highlighted in the inversion results, some areas in the field still exhibit sizeable uncertainty in the porosity distribution or pressure development, especially in areas not sampled by wells. Our current approach was to catch these uncertainties in a correction factor for the compaction coefficient encompassing the entire range of uncertainty in this factor. A more scientifically sound approach is to assess the uncertainty a priori and construct an ensemble of models that map this uncertainty. This ensemble could then be fed into an integrated inversion or data assimilation exercise intended to constrain uncertainty (Wilschut et al., Reference Wilschut, Peters, Visser, Fokker and Van Hooff2011; NAM, 2015). For Groningen, the large size of the field hampers this scientifically sound approach. Making multiple static and dynamic model realisations may take up to several years of manpower. Another choice to be made entails whether to accept history-matched reservoir models only or to integrate the history matching with the surface movement inversion. The latter procedure may be more comprehensive, but could easily exceed the reach of current computer capabilities.
Compaction
We presented a modelling approach to obtain compaction behaviour. Two alternative ways of obtaining the reservoir rock compaction behaviour are laboratory experiments and direct field observations. Field observations have been obtained by employing multiple radioactive markers in a number of boreholes, which then were periodically logged to follow their relative distance (Mobach & Gussinklo, Reference Mobach and Gussinklo1994). However, the limited precision of these measurements does not allow for a detailed testing of different compaction models. A new technology is the use of fibre-optical sensors, which provide two-orders-of-magnitude better resolution in measured strains and a semi-continuous sampling in time.
Laboratory testing can provide insight into the mechanical behaviour of core material on a small scale and for limited time durations. De Waal's (Reference De Waal1986) RTCM model was actually based on experiments. Of course, to extrapolate such experimental results to the field scale, either a physics-based model or a field-scale experiment is required – and ideally both. One can view the Groningen case itself as a field-scale experiment, with subsidence measurements as the experimental outcome. However, there are still many uncertainties, like the geomechanical response of the reservoir surroundings and the pressure distribution and development, which makes it less controlled than in laboratory conditions. Therefore, alternative approaches have focused on experiments targeted at understanding the compaction physics (see, e.g., Niemeijer et al., Reference Niemeijer, Spiers and Bos2002; Brantut et al, Reference Brantut, Heap, Meredith and Baud2013; Brzesowsky et al., Reference Brzesowsky, Hangx, Brantut and Spiers2014a,Reference Brzesowsky, Spiers, Peach and Hangxb). Many questions remain, however, such as which mechanism is at work in which regime, or how to extrapolate laboratory results to the field scale. More work is required to adequately describe the physics involved and to build confidence when bridging the laboratory scale to the field scale (Hangx et al., Reference Hangx, Spiers and Niemeijer2017). An interesting lead seems to be an interpretation of the RTCM model in terms of statistical or micromechanical models for brittle creep (Brantut et al., Reference Brantut, Heap, Meredith and Baud2013).
The coupling of reservoir engineering and geomechanics for gas reservoirs usually employs one-way coupling: reservoir pressures are used as an input forcing for the geomechanical simulator. This approach is warranted since the compressibility of the gas is much larger than that of the porous reservoir structure. In other words, pressure changes due to the change in pore volume by poroelastic stressing are much smaller than the pressure changes due to reservoir depletion. For connected aquifers, this approach may not be permitted, and a two-way coupling may be more appropriate in certain circumstances.
Geomechanical response
An important link between compaction and subsidence is the influence function. Where Marchina (Reference Marchina1996) utilised the Geertsma solution for a homogeneous half-space and NAM (2013) employed the Geertsma–Van Opstal solution with a rigid basement, we performed a limited sensitivity study in order to test different forward models. The different forward models, however, did not yield very different results.
An influence function starts from the assumption of a layered subsurface. When significant structures are present in the subsurface, like salt domes, this approach can be insufficient (Orlic & Wassing, Reference Orlic and Wassing2013). There is also discussion whether an influence-function approach is adequate when horizontal salt layers are present: Marketos et al. (Reference Marketos, Govers and Spiers2015) show time-dependent behaviour with time constants different from the time constants of the salt itself, which cannot easily be understood from a linear response captured in an influence function. The understanding of time-dependent behaviour in several regimes (Marketos et al., Reference Marketos, Spiers and Govers2016) calls for a thorough geomechanical investigation.
Subsidence measurements
The surface movement measurements used in our inversion study were double differences calculated from the original height differences (Fokker & Van Thienen-Visser, Reference Fokker and Van Thienen-Visser2016). The background of this choice was the suboptimal practice of using estimated temporal height differences without knowledge about the covariance matrix. The principle of our approach is equivalent to using estimated height differences with a full covariance matrix. In practice, the latter procedure might be better, since careful adjustment of the raw data to arrive at estimated heights involves testing for outliers and errors, facilitated by the redundancy normally present in the data (Vanicek et al., Reference Vanicek, Castle and Balazs1980; Houtenbos, Reference Houtenbos2000). We therefore prefer the latter approach for future exercises if the covariance matrix is known.
A recent development in geodetic monitoring is the use of remote sensing. The deployment of interferometric radar, InSAR (Ferretti, Reference Ferretti2014), has become very popular, as it can provide millimetric accuracies. The technique has been demonstrated to be applicable to the Groningen area (Ketelaar, Reference Ketelaar2008). An advantage of InSAR above levelling is the possible determination of movement in different directions, allowing the establishment of vertical and horizontal (east–west) movements (for applications to gas fields or CO2 injection see Samiei-Esfahany et al., Reference Samiei-Esfahany, Hanssen, Van Thienen-Visser and Muntendam-Bos2009; Rucci et al., Reference Rucci, Vasco and Novali2013; Fokker et al., Reference Fokker, Wassing, Van Leijen, Hanssen and Nieuwland2016). For many regions, data are available in historical records since 1993, and these can be processed and used for additional evaluation. Complications of the technology are the non-unique identification of measurement points (the scattering object may not always be exactly identified), the extensive processing required to obtain movement data from the satellite images, and the low density of measurement points in rural or highly vegetated regions.
Inversion approach
Inversion of measurements to model parameters is a general geophysical problem (Tarantola, Reference Tarantola2005; Menke, Reference Menke2012). An early inversion of subsidence measurements in Groningen was performed by Marchina (Reference Marchina1996). Although he did not take into account the full covariance matrix of the subsidence data, his results are noteworthy: he observed that to the west of the Groningen field, some compaction in the aquifer evolved. Our results are not completely in line with these observations, presumably because of the almost 20 years longer monitoring period and the use of double differences.
We already highlighted in the subsection on geological and reservoir models that a better approach than ours would be to incorporate all uncertainties in a single integrated inversion exercise. In our view, an ensemble approach is the most promising way forward, since the number of uncertainties and the associated dimensionality of the space where a solution must be found quickly will make other approaches unfeasible because of the required computer time and storage capacity. In an ensemble approach, all realisations are in principle geologically sound, and correlations between parameters are thus implicitly honoured. Ensemble methods have been shown to be extremely helpful in problems with large amounts of data and high levels of uncertainties (see, e.g., Evensen, Reference Evensen2010).
A way forward
A possible set-up in which the different steps are integrated and in which a stochastic ensemble approach is propagated through the complete workflow is presented in Figure 6. In the first place, a dedicated procedure is required to obtain the data in adequate format. This involves the definition of an area and a time interval of choice. The data are to be used later in the conditioning step; metadata (positions, times, data types) are created for use in the calculation modules.

Fig. 6. Compaction modelling and inversion workflow.
The calculations start from geological and reservoir models, in which the uncertainty is mapped on an ensemble of realisations. This ensemble is extended with samples of prior parameters and conceptual choices on the compaction model. Then, to calculate subsidence, the ensemble is again extended, to honour the prior uncertainty about conceptual and quantitative realisations. The complete flow of calculations results in a large ensemble of model predictions, which can then be confronted with the data. Different approaches for this confrontation can be envisaged: an Ensemble Smoother, an Ensemble Kalman Filter or a Particle Filter are three examples (Evensen, Reference Evensen2010; Nepveu et al., Reference Nepveu, Kroon and Fokker2010; Emerick & Reynolds, Reference Emerick and Reynolds2013; Tavakoli et al., Reference Tavakoli, Yoon, Delshad, ElSheikh, Wheeler and Arnold2013; Fokker et al., Reference Fokker, Wassing, Van Leijen, Hanssen and Nieuwland2016).
Facilitating appropriate decision-making based on the stochastic simulations involves a study in itself. We will not touch further on this subject in the present paper but wish to highlight two issues here. In the first place, it is important to acknowledge that predictions made after confrontation of data and model results are still stochastic and bear with them their own uncertainty. In the second place, any decision will directly depend on the goal to be achieved – be it maximised productivity, subsidence limited to a threshold value, or seismicity induced by field operations.
Conclusion
The compaction and subsidence of the Groningen gas field has been assessed in an integrated manner, incorporating all available knowledge on geology, reservoir pressure development and compaction behaviour, geomechanical response, and surface movement measurements, This yielded an improved definition of the compaction field. The update was used to improve compaction and subsidence forecasts. A further improvement would be to integrate the different steps by incorporating the uncertainty on geology, reservoir and compaction behaviour in a fully stochastic workflow. Measurements can then be used to constrain an ensemble of field realisations and reduce the variance of compaction and subsidence forecasts.
Acknowledgements
We thank our reviewers Pietro Teatini and Ger de Lange for constructive comments and suggestions that helped to improve the manuscript.


 Open access