


This paper contains supplementary material that can be found online at http://journals.cambridge.org
Introduction
Population censuses are widely used in monitoring for conservation but it is rare to be able to make complete counts for any population. Estimates of total population are prone to natural error; generally the more effort expended the more accurate and precise the estimate. There is a trade-off in sampling effort and minimizing statistical error (Zar, Reference Zar1999). Optimization of sampling design is a managerial decision that may have to take into account a variety of factors, including funding, research agenda and impacts on habitat.
Marine turtles are subject to widespread exploitation for subsistence use, as well as for domestic and international trade. All marine turtles are classified as Endangered or Critically Endangered on the IUCN Red List but their conservation status has been extensively debated (Mrosovsky Reference Mrosovsky1997, Reference Mrosovsky2004; Meylan Reference Meylan1998; Seminoff & Shanker, Reference Seminoff and Shanker2008; Webb, Reference Webb2008). There is a tendency to treat inference in a biased way, accepting any inference that a population is declining but demanding a high level of proof before accepting any evidence of an increase (Mrosovsky, Reference Mrosovsky2002, Reference Mrosovsky2004). Such a bias is favoured by the lack of a long time series of data. In a recent review several objectives were proposed as priorities: ‘Promote the standardization of data collection protocols through professional workshops and educational outreach. Conduct long-term monitoring of nesting and in-water populations, with emphasis on collecting the appropriate data necessary for population trend analyses’ (Seminoff & Shanker, Reference Seminoff and Shanker2008).
The goal of any monitoring must be clearly stated and must clearly define the analysis methods that are available or the need to develop new ones if required. The monitoring strategy can then be defined, taking into account knowledge of the site and the species, and logistical constraints (time, finance and field workers). The basis for management decisions for populations must include accurate assessments of population size, including a determination of whether populations are stable, increasing or declining (Eckert, Reference Eckert, Eckert, Bjorndal, Abreu-Grobois and Donnelly1999). For marine turtles estimates of relative abundance using nest counts are useful (Richardson, Reference Richardson, Eckert, Bjorndal, Abreu-Grobois and Donnelly1999) and can be used to detect temporal trends in abundance. Such estimates are usually simpler and less expensive to obtain than estimates of absolute population size. However, estimates of relative abundance require several assumptions and if these assumptions are invalid the estimates may be biased (Gerrodette & Taylor, Reference Gerrodette, Taylor, Eckert, Bjorndal, Abreu-Grobois and Donnelly1999). Nevertheless, estimates of the absolute population size of marine turtles are often obtained by simple conversion from a relative measure and thus suffer the same bias.
Counting nests or turtles during only a part of the nesting season can capture the information required to estimate long-term trends. Ten rather than 20 weeks of monitoring are sufficient to detect trends in the number of female hawksbill turtles Eretmochelys imbricata (Sims et al., Reference Sims, Bjorkland, Mason and Crowder2008). Alternatively, accurate annual population estimates can be achieved with as few as 14 days of survey effort providing monitoring spans the peak of nesting and the quality of the annual population estimate does not increase greatly if more monitoring days are added (Jackson et al., Reference Jackson, Broderick, Fuller, Glen, Ruxton and Godley2008).
However neither of these methods are suitable where beaches are small and widely dispersed. For example, 157 nesting beaches are known in the Guadeloupe archipelago in the French West Indies but on a given night it is logistically impossible to monitor such a large number of locations. The monitoring of a few index beaches has been recommended in such a situation (Eckert, Reference Eckert, Eckert, Bjorndal, Abreu-Grobois and Donnelly1999). However, nest density is low on all of the beaches on Guadeloupe. Few nests will be recorded on the index beaches and, as a consequence, the power to detect a trend will be low (Galimberti, Reference Galimberti2002). Furthermore, if turtles stop nesting on one of the index beaches and nest elsewhere the time series for this location will be incomplete. Such a situation has been documented in French Guiana, where leatherback turtles Dermochelys coriacea change their nesting location from year to year, for unknown reasons, even if the previously used beach is still available (Girondot et al., Reference Girondot, Godfrey, Ponge and Rivalan2007). An index beach could also become eroded, for example after a hurricane.
Girondot (Reference Girondot2010a) developed a monitoring design in which each beach is monitored at a low level for the entire season. Here we extend this method to deal with spatial variation in nesting activity. All the datasets for all beaches monitored in one nesting season are analysed simultaneously using a common statistical model. The methodology has been tested in the Guadeloupe archipelago, where monitoring began in 2000 for the hawksbill, green Chelonia mydas and leatherback marine turtles. The new monitoring design was implemented there in the 2007 and 2008 nesting seasons.
There is a lack of detailed accounts of methodologies for monitoring nesting beaches. As an aid to monitoring programmes we therefore describe explicitly the scheme that we used to choose the beaches to be monitored and the time of monitoring. The data we use encompass nearly all the difficulties that are encountered in monitoring marine turtles: a large number of nesting beaches and limited financial and human resources, non-systematic field monitoring (with field workers sometimes reporting only nights with nests), and low levels of nesting. Combining a new monitoring design and new analysis models we were able to use all the available information collected during 2,517 beach and night surveys over 9 years on 59 beaches. Using this monitoring design we were able to estimate the nesting effort on 45 beaches in 2007 and 59 in 2008 and to use the data for 2000–2006 (when the zero counts were not systematically reported). The new statistical tools and monitoring design we developed could be useful elsewhere and also for species other than marine turtles.
Methods
Species and nesting season
In the Guadeloupe archipelago the hawksbill turtle nests from mid April to mid October, with a peak in June–August, the green turtle from early July to the end of November, with a peak between mid August and the end of September, and the leatherback turtle from early March to September, with a peak in May–June. However, sparse nesting of all three species can be observed year-round.
Inventory of nesting beaches
The beaches of the Guadeloupe archipelago are described in a regional action plan for marine turtles of the Caribbean French Islands (Chevalier, Reference Chevalier2006). Beaches suitable for nesting have been catalogued using aerial photographs from the Institut Géographique National, interviews and preliminary field surveys. The location of each beach has been recorded with a global positioning system and each has been tagged with a unique ID because several beaches have the same local name.
Monitoring design
The archipelago was grouped into 10 sectors based on beaches that are geographically proximate. These beaches are used by 0–3 marine turtle species but at least one species is believed to nest in each sector. La Désirade sector has not been monitored as it is logistically difficult and potentially unsafe to monitor this remote island.
Two kinds of monitoring were used based on the level of frequentation of at least one marine turtle species. A-beaches are defined as high-frequency nesting beaches for at least one species and B-beaches as low-frequency nesting beaches for all species. From one to 10 A- and B-beaches, for a total beach length of 0.8–12 km, were monitored in each sector. A-beaches were monitored during the whole nesting season whereas B-beaches were monitored only during the peak nesting season. A total of 45 beaches were monitored in 2007 and 59 in 2008 (29% and 38% of the total number of beaches in the archipelago). All islands and mainland Caribbean and Atlantic beaches are represented (Figs 1–3).

Fig. 1 The estimated number of hawksbill turtle Eretmochelys imbricata nests on the beaches of the Guadeloupe archipelago in 2007 and 2008. Crosses indicate beaches where no nesting was observed.

Fig. 2 The estimated number of green turtle Chelonia mydas nests on the beaches of the Guadeloupe archipelago in 2007 and 2008. Crosses indicate beaches where no nesting was observed.
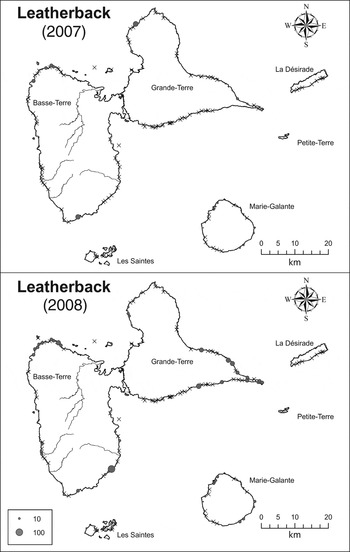
Fig. 3 The estimated number of leatherback turtle Dermochelys coriacea nests on the beaches of the Guadeloupe archipelago in 2007 and 2008. Crosses indicate beaches where no nesting was observed.
A-beaches were monitored on 6–7 days per month before and after the peak nesting period and on 7–15 days during the peak, and B-beaches on 14–22 days during the peak. This monitoring effort was based on a power analysis for this method (Russo & Girondot, Reference Russo and Girondot2008a,Reference Russo and Girondotb). Monitoring for 2007 began on 28 March and ended on 23 December. Monitoring for 2008 began on 3 March and ended on 11 November. From 2000 to 2006 only one or two beaches (Folle Anse and Trois Ilets on Marie-Galante) were patrolled nightly. On each beach on each monitoring day we recorded the species that made each track, if the nest was from the current night or older, and if the female had successfully nested or not. The latter is difficult to interpret in the field and therefore we analysed the track counts.
Model of nesting season
Let t be an ordinal date (calendar date ranging between 1 and 365 or 366, starting on January 1 or any other reference), with the number of nests deposited per night modelled using (Girondot, Reference Girondot2010a):
 $$\left\{ {\matrix{ {{\rm if}\; t \lt B \to { Min\ B}}\cr \matrix{\!{\rm if}\; t \in \left[ {B{\rm,} P - F/2} \right] \to ((1 + {\cos}(\pi (P - F/2 - t)/ (P - F/2 - B)))/2)({Max} - {Min}\; B) + {Min}\; B } \cr {{\rm if}\; t \in [P - F/{\rm 2},P + F/2] \to {Max}} \cr \matrix{\!\!\!{\rm if}\; t \in \left[ {P{\rm +} F/2{\rm,} E} \right] \to ((1 + \cos(\pi (t - P + {\rm F}/2)/(E - P + {\rm F}/2)))/2)({Max} - \; {Min\; E}) + \; {Min\ E} \cr\!\!\!{\rm if}\; t \gt E \to {Min\ E} } \cr}} \right\}$$
The model requires at most seven parameters that have a direct biological or phenological interpretation: MinB is the mean nightly number of nests before the beginning of the nesting season; MinE is the mean nightly number of nests after the end of the nesting season; Max is the mean number of nests at the peak of the nesting season; P is the ordinal date of the peak of the nesting season; F is the number of days where nest distribution is flat around the date P; B is the ordinal date of the beginning of the nesting season; and E is the ordinal date of the end of the nesting season. MinB, Max and MinE are scaling parameters, and P, F, B and E are shape parameters. Various constraints can be set up to simplify this model: MinB = MinE, same number of nests before and after the nesting season; MinB and/or MinE # 0 (e.g. 10−9), no nests out of the nesting season; P – B = E – P, nesting season is symmetric around P. The simplest model uses four parameters, (P, P – B = E – P = constant, Max, MinB = MinE = 10−9). The nesting season is defined as the interval [B, E].
When several series for the same species and region are analysed simultaneously a single set of shape parameters (B, P, F, E) can be used for all time series and only Max and MinE/MinB are series-specific. It can be convenient to define MinE and MinB as a ratio of Max, with %MinB and %MinE being the proportional constant (i.e. MinE = %MinE.Max and MinB = %MinB.Max) as only two common scaling parameters are necessary for all series (%MinB, %MinE) and only Max is series-specific.
Parameter estimation and model selection
The parameters were fitted using maximum likelihood statistical methodology; i.e. the parameter values that maximize the likelihood of observations in the model (named L) are searched for using a non-linear fitting algorithm (Lasdon & Waren, Reference Lasdon and Waren1981). The likelihood is the hypothetical probability that an event that has already occurred would yield a specific outcome. A negative binomial distribution was used as a link for maximum likelihood. The popularity of the negative binomial distribution is largely because of its ability to model count data with varying degrees of overdispersion, as observed with marine turtle nest counts (Girondot et al., Reference Girondot, Rivalan, Wongsopawiro, Briane, Hulin and Caut2006). The distribution is commonly expressed in terms of the mean m and dispersion parameter k such that the likelihood of observing a non-negative integer x is:
 $$\Pr (X = x) = \displaystyle{{\Gamma (k + x)} \over {x!\Gamma (k)}}\left( {\displaystyle{m \over {m + k}}} \right)^x \left( {1 + \displaystyle{m \over k}} \right)^{ - k}, m \!\gt\! 0,k \!\gt\! 0$$
and L(M;x)=α Pr(X=x) with α being a constant and M being the model.
For time series in which zero counts were not systematically reported we use conditional probability as a likelihood function. When x = 0 is discarded the likelihood function becomes:
 $$L\left( {M{ ; x}\left[{\ne} 0 \right]} \right){ = \alpha} \displaystyle{{{\rm Pr}\left( {X{\rm =} x} \right)} \over {1 - {\rm Pr}\left( {X{\rm =} 0} \right)}}$$
Model selection was performed using the Akaike information criterion (AIC; Akaike, Reference Akaike1974). This is a ranking measure that takes into account the quality of the model fit, comparing it to the data while penalizing the number of parameters used:
 $$AIC = - 2\ln L + 2k$$
where L is the maximum likelihood and k the number of parameters. Models with the lowest values of AIC were retained as good candidate models and ΔAIC was calculated as the difference in value of AIC between a particular model and the one with the lowest AIC. Akaike weights (w i =exp(−Δ AIC /2), normalized to 1) were used to evaluate the relative support of various tested models (Burnham & Anderson, Reference Burnham and Anderson1998). Akaike weights can be directly interpreted as conditional probabilities for each model. Ideally, the model with the lowest AIC was kept for further testing. When two or more models possessed similar Akaike weights the model with the lowest number of parameters was selected. When several of these models had the same number of parameters, the model with the lowest AIC among them was selected.
Standard error of parameters and nest numbers
The inverse of the Fisherian matrix was used to estimate the variance of parameters. Matrix inversion was performed using the Gauss–Jordan method and the partial derivative of −ln L was estimated by numerical approximation (Press et al., Reference Press, Teukolshy, Vetterling and Flannery1992). The total number of nests expected for each nesting season and nesting site was calculated by summing the observed number of nests laid per night, when available, with the estimated number. When no nests were found on a beach the model could not be used because max = 0 would maximize likelihood. In such a situation we searched for the monitored day that was the closest to the peak. The nest count for that day was changed to 1 and the Max parameter for the time series were fitted. Then, the total number of nests minus one was used as an upper bound for the number of nests on the beach.
Trend analysis
Hawksbill turtles at Trois Ilets beach were monitored for > 2 years and thus their temporal trend could be analysed. Exponential growth was used to describe the annual nest number time series:
 $$N(t) = N_{2000}. e^{rt} $$
The annual nest number is large enough to suppose a Gaussian distribution. Growth parameters were adjusted by the maximum likelihood method. Standard deviation was modelled using two additive components: error of annual estimation and an adjusted component describing interannual fluctuation.
Results
Hawksbill turtle
Of the 113 time series available for the Guadeloupe archipelago only 67 could be used to fit a model to the nesting season of hawksbill turtles (Supplementary Table S1). For the remaining 46 time series no nests were observed. This does not mean that hawksbill turtles do not nest on these beaches but that there was no monitoring for at least one night on which one hawksbill turtle nested. For example, on Bois Jolan beach on Sainte Anne no nests were recorded in 2008 on the 12 nights monitored although a track of a nest deposited on a previous night was recorded on 9 July.
Four models of nesting season were tested (Table 1). The preferred one in terms of AIC had F, %MinB and %MinE fitted. However, the %MinE value was too high (33%) to represent a marine turtle nesting season because the number of nests out of the nesting season is generally very low. Of the two remaining models that with lowest AIC and the highest P value (0.73) was retained. In this model the parameters F, %minB and %minE were fixed at 0.
Table 1 Comparison of four models (see text for further details) for the nesting seasons of the hawksbill Eretmochelys imbricata, green Chelonia mydas and leatherback Dermochelys coriacea marine turtles on the beaches of the Guadeloupe archipelago (Figs 1–3). The index i for Max indicates that this parameter is series-specific.

1 L, Maximum likelihood; 2Akaiki information criterion
3 The shape of the nesting season is not sufficiently constrained (e.g. %MinE = 33%) and therefore these two models were discarded.
The estimated annual number of nests for a single beach is 0–851 (95% confidence interval 731–971). The estimates for beaches where no nests were observed range from 0–6 to 0–651 nests (Supplementary Table S1). The estimate of 0–6 nests was obtained for a beach that was monitored in 2008 for 90 days around the peak of the nesting season. The estimate of 0–651 nests was obtained for a beach monitored only once in 2007, 2 months after the peak of the nesting season. Results for the 2007 and 2008 nesting seasons are presented in Table 2.
Table 2 Summary of the dates of the nesting season and number of recorded nesting tracks of the hawksbill, green and leatherback marine turtles in the Guadeloupe archipelago (Figs 1–3). The data are means with 95% confidence intervals in parentheses.

In 2007 and 2008 the same 34 beaches were monitored and 20 had at least one nest observed in both seasons. The number of nests on the same beaches is significantly correlated between years (r = 0.88, P < 0.0001), indicating stability in the use of these beaches during these 2 years (Fig. 4).
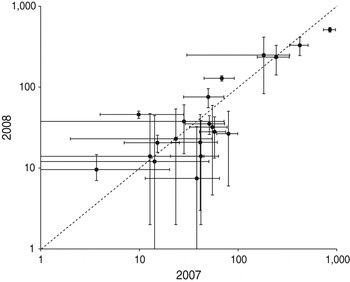
Fig. 4 Nesting effort on the monitored beaches in 2007 and 2008 (the error bars are the 95% confidence interval). The line indicates equality.
The trend for Trois Ilets beach in Marie Galante for 2000–2008 is positive (Fig. 5), with an instantaneous growth rate of r = 0.27 (95% confidence interval 0.25–0.29). This beach has the largest number of nests in the Guadeloupe archipelago but this was only 22 and 19% of the total number of nests in 2007 and 2008, respectively.

Fig. 5 The estimated number of nests of hawksbill turtles on Trois Ilets beach from 2000 to 2008 (the envelope of dotted lines is the 95% confidence interval of the exponential growth model); the trend line is the fitted exponential curve.
The coefficient of variation (CV) is the estimated mean number of nests divided by the standard error of the estimate. It was 0.02–12.67 with a mean of 0.77. The value of 12.67 was obtained for a time series with only four nest counts and the nights with zero counts were not reported (cf. Folle Anse beach in 2004; Supplementary Table S1). The CV is negatively correlated with the mean (r = −0.21, P = 0.04), indicating that the lower the nesting effort on a beach the more difficult it is to obtain a good estimate of this nesting (Zar, Reference Zar1999). When CV is plotted against mean number of nests, the best fit is obtained with a power regression. CV was not significantly correlated with the number of monitoring days (r = −0.19, P = 0.15). However, when the number of monitoring days is included as covariate of the parameters of the regression, the fit is significantly enhanced (P = 1, Table 3). This model explains 98% of the variance of the CV.
Table 3 Model selection based on maximum likelihood for the relationship between coefficient of variation of the estimates and N, the estimated mean number of nests for this beach, and D, the number of monitored days. The tested model is CV=(a+b·D)·N (p+q·D).

1 L, Maximum likelihood; 2Akaike information criterion
Green turtle
Of the 113 time series in which tracks of green turtles were recorded only 23 could be used to fit the nesting season (Supplementary Table S2). Of the four models tested (Table 1) the one preferred in terms of AIC has F fixed at 0 but %MinB and %MinE fitted. Taking into consideration their standard error, the fitted %MinB and %MinE are not significantly different. The model with lowest AIC and highest P value (0.73) was retained.
The beach with the highest number of tracks in 2007 was Pointe Allègre on Guadeloupe's main island, on which 636 tracks were estimated. However, this beach was monitored for only 6 of 121 days during the 2007 nesting season. The resulting 95% confidence interval (CI) is huge (2–1,745). The same beach was monitored for 20 days in 2008 and the estimate was of only 10 tracks (95% CI 1–32). In 2008 the beach with the highest estimated number of tracks was Les Galets on Marie-Gallante, with 501 estimated tracks (95% CI 447–555). In 2007 there were an estimated 250 tracks on this beach (95% CI 116–384).
Results for the 2007 and 2008 nesting seasons are shown in Table 2, considering only beaches where at least one track was observed. If all beaches are used the CI is huge (2007: 452–34,094; 2008: 922–22,576). Only four beaches have data in common for 2007 and 2008, which is too few to compare the relative use of these beaches in these 2 years.
Leatherback turtle
Of the 113 time series in which tracks of leatherback turtles were recorded only 18 could be used to fit the nesting season (Supplementary Table S3). Of the four models tested (Table 1) the one preferred in terms of AIC has F, %MinB and %MinE fixed at 0. When these parameters are fitted they fall very close to 0. This explains why the likelihood is unchanged with or without these parameters. The model with lowest AIC and highest P value (0.64) was retained.
Nests of leatherback turtles were observed mainly on Guadeloupe's main island. The beach with the highest estimated number of tracks in 2007 was La Chapelle, on which 124 tracks were estimated (95% CI 56–191). However, this beach was monitored for only 1 day. In 2008 this beach was monitored for 41 days and activity by leatherback turtles was not recorded. On Cluny and Nogent beaches in Sainte-Rose town in 2007 there were an estimated 47 (95% CI 35–62) and 41 (95% CI 28–55) tracks. In 2008 no nests were recorded on Cluny beach and 17 tracks (95% CI 1–57) were estimated on Nogent beach.
Results for the 2007 and 2008 nesting seasons are shown in Table 2, considering only beaches where at least one track was observed. If all beaches are used the CI of nesting number is huge (2007: 386–8,780; 2008: 210–3,913). Only five beaches have data in common for 2007 and 2008, which is too few to compare the relative use of these beaches in these 2 years.
Discussion
Monitoring design in Guadeloupe
Quantification of the nesting of marine turtles is poor on most of the Caribbean Islands. With appropriate monitoring of nesting beaches and using a new statistical tool we have been able to quantify nesting for three marine turtle species during the whole nesting season for up to 38% of the 157 beaches of the Guadeloupe archipelago. Using this methodology we have been able to enhance the precision of the estimate of the number of marine turtles nesting and to perform a trend analysis. Without the monitoring design that we implemented it would have been impossible to perform such a task with only 6–8 field workers.
The analysis of all the data in a single step is the key to this statistical design and all time series enrich each other in parameter estimation. A time series with low monitoring effort will gain information for the B, P, E and F parameters from the other time series. Only the Max parameter is series-specific and will suffer from any lack of data.
However, it is important to monitor beaches during the whole nesting period for all species. The emblematic species in Guadeloupe is the hawksbill turtle and monitoring was designed specifically to enhance the quality of data for this species. Thus most of the beaches that are important for the hawksbill turtle were not monitored during the nesting season of the green turtle. The leatherback nesting season is long and encompasses that of the hawksbill. However, some tracks of green turtles were observed occasionally on these beaches. As they were not monitored during the nesting season of the green turtle it is not possible to reject the possibility that these beaches were used by them. The large confidence interval reflects this uncertainty. We could force a zero count for the beaches that are probably not used by green turtles but it would be preferable to have at least some night counts during the nesting season. Forcing a zero count could mask any future change in use of these beaches.
Rationale for monitoring of nesting beaches
In prioritizing research to obtain an improved understanding of the nesting of marine turtles (Seminoff & Shanker, Reference Seminoff and Shanker2008) several matters need to be considered. The CV of the estimated number of nests measures the quality of the estimate. It varies considerably in Guadeloupe, and the number of days the beach is monitored and turtle nesting effort explains 98% of its variation. The fit of the CV as a function of these two parameters facilitates delimitation of the monitoring effort required for a defined level of CV, depending on the overall nesting effort by turtles on the beach (Fig. 6). At least 50 days of monitoring are required to obtain a CV < 0.25 when the total number of nests is c. 10. When the total number of nests is > 100, 20 monitoring days can be sufficient to obtain a CV of < 0.05.

Fig. 6 Coefficient of variation (CV) of the estimated annual number of nests based on the actual annual number of nests and the number of monitored days used to calculate the estimate.
Monitoring of the beginning and end of the nesting season is often neglected. However, it is important to have data for these periods and also for before and after the nesting season. This permits the delimitation of the nesting season and constrains the B and E parameters. This was a problem with the data analysis for the green and leatherback turtles.
Beaches without nests should not be omitted from the sampling design. Several arguments justify the monitoring of beaches where turtles are not currently nesting. Firstly, nesting effort could be low and therefore overlooked by light monitoring. Secondly, even if turtles are not using a beach it does not mean they will never use it. Change of nesting beach or colonization of new beaches can occur. If there are no data for a particular beach it will be impossible to show that any colonization has occurred.
Status of marine turtles in Guadeloupe
Hawksbill turtles are categorized as Critically Endangered on the IUCN Red List (Meylan & Donnelly, Reference Meylan and Donnelly1999; Mortimer & Donnelly, Reference Mortimer and Donnelly2008) but there has been a debate about the suitability of the IUCN Red List criteria for marine turtles (Mrosovsky, Reference Mrosovsky2004; Seminoff & Shanker, Reference Seminoff and Shanker2008). In particular, the status of hawksbill turtles in the Caribbean has been controversial (Meylan, Reference Meylan1999) in the context of Cuba requesting a declassification of the hawksbill turtle from CITES Annexe 1 to permit trade in its shell (Mrosovsky, Reference Mrosovsky2004). Killing a marine turtle for human use is a taboo for many marine turtle specialists (Mrosovsky, Reference Mrosovsky2000).
The estimate of the number of hawksbill turtles nesting in the Guadeloupe archipelago used for the IUCN Red List assessment was ‘higher than 200 nests per year’ (Mortimer & Donnelly, Reference Mortimer and Donnelly2008). However, the work cited (Chevalier et al., Reference Chevalier, Boitard, Bonbon, Boyer, Cuvillier, Deproft, Coyne and Clark2001) in the Red List assessment was not supposed to be used as an estimate for Guadeloupe (J. Chevalier, pers. comm.). We can now provide a corrected estimate of the number of hawksbill nests: on 45 beaches in 2007 the estimate is 3,823 (95% confidence interval 1,925–6,415) and for 59 beaches in 2008 the estimate is 2,300 (95% confidence interval 1,435–4,742). The beaches added in 2008 are beaches with low levels of nesting, which explains why the estimates are similar for the 2 years even though 14 beaches were added.
The trend for the most important nesting beach in the Guadeloupe archipelago, Trois Ilets, suggests that hawksbill nesting is increasing (Fig. 5). This is in agreement with the few other time series available for the Caribbean (Garduno-Andrade et al., Reference Garduno-Andrade, Guzman, Miranda, Briseno-Duenas and Abreu-Grobois1999; Kerr et al., Reference Kerr, Richardson and Richardson1999; Richardson et al., Reference Richardson, Bell and Richardson1999; Beggs et al., Reference Beggs, Horrocks and Krueger2007). Hawksbill turtles could therefore be recovering in this region after having been depleted through unsustainable use.
Considering the high rate of extraction of marine turtles over the last 100 years in other areas of the Caribbean (for a review see Groombridge & Luxmoore, Reference Groombridge and Luxmoore1989; Fleming, Reference Fleming2001) it is reasonable to assume that the size of the Tortuguero rookery and other extant Caribbean rookeries was markedly greater in the past (Seminoff, Reference Seminoff2004). The only Caribbean island included in the IUCN report for green turtles was Aves Island in the southern Caribbean, where green turtles have declined (Seminoff, Reference Seminoff2004). There are as yet no time series for a central Caribbean island such as Guadeloupe.
The IUCN Red List assessment for the leatherback turtle states that ‘some of the Caribbean nesting populations appear to be increasing’ (Sarti Martinez, Reference Sarti Martinez2000). This information comes mainly from the US Virgin Islands, where the activity of leatherback turtles appears to have increased exponentially since the 1990s (Dutton et al., Reference Dutton, Dutton, Chaloupka and Boulon2005). The activity of leatherback turtles also seems to have increased in Guadeloupe (Chevalier, Reference Chevalier2006) but we need quantitative data to support this claim.
Populations of marine turtles on Caribbean islands are interconnected by their use of common feeding areas and of several islands to nest. Therefore only analysis at the scale of the Caribbean will facilitate an objective assessment of the status of these species. The methodology developed here for marine turtles nesting on the beaches of the Guadeloupe archipelago could be used at the scale of the entire Caribbean.
Acknowledgements
We thank the Office National de la Chasse et de la Faune Sauvage, Association Le Gaiac, Association Kap'Natirel, Association AEVA, Association Eco-Lambda, Réserve Naturelle de Saint-Martin, Réserve Naturelle de Saint-Barthélemy, Office National des Forêts, Association Ti tè, and Association Evasion Tropical and all the volunteers and guards who assisted with fieldwork. Financial support was provided by DIREN Guadeloupe, Conseil Régional de la Guadeloupe, the EU (fund FEDER) and ONCFS. We thank Mrs Anna Han for correcting the English.
Biographical sketches
Eric Delcroix founded the NGO Kap'Natirel, which is devoted to marine turtle conservation in Guadeloupe. He is now the coordinator for marine turtle conservation in the French Governmental Agency for Environment. Sophie Bedel managed the fieldwork for Kap'Natirel. She now works as a freelance environmentalist with a special interest in cetaceans. Guilhem Santelli is the current coordinator of fieldwork for Kap'Natirel. Marc Girondot has worked on the conservation of marine turtles since 1985, using both molecular tools and modelling of population dynamics. His other research interests are the evolution of mineralized tissues and the evolution of temperature-dependent sex determination in reptiles.


