


Introduction
Local chicken breeds are preferred in certain regions of the world because of their leanness, pigmentation and taste, and consumers are willing to pay a higher retail for the tasty local chickens (Chin, Reference Chin2003; El-Gendy, Reference El-Gendy2009a, Reference El-Gendy2009b). Also, local breeds have the genetic compositions that enabled them to adapt the local environmental conditions (El-Gendy et al., Reference El-Gendy, Atallah, Mohamed and Atta1995; Helal, Reference Helal2019), whereas the performance of exotic or commercial strains is reduced when birds are environmentally stressed. Although native chicken breeds have further significance for sustainable development and increasing meat production (El-Gendy et al., Reference El-Gendy, Helal, Goher and Mostageer2005; Van Marle-Köster et al., Reference Van Marle-Köster, Hefer, Nel and Groenen2008), they have not been commercially used.
El-Gendy (Reference El-Gendy2009a, Reference El-Gendy2009b) reported that local chicken breeds show unexploited genetic variation. Such variation could be exploited by practicing breeding programmes aiming to improve the production of local breeds (Vergara et al., Reference Vergara, Landi, Bermejo, Martínez, Acosta, Barro, Bigi, Sponenberg, Helal, Banabazi and Vallejo2019). Furthermore, improving, conservation and commodification of local breeds will advance sustainability efforts and contribute to rural development and livelihoods particularly in the developing countries (Ovaska and Soini, Reference Ovaska and Soini2017; Agossou and Koluman, Reference Agossou, Koluman, Simões and Gutiérrez2018).
Several genes in different breeds contribute to the adaptation process to certain environmental conditions. The naked neck gene reduces the feather mass over the body surface and total loss of feathers in the neck region (Sharifi et al., Reference Sharifi, Horst and Simianer2010). As shown in Fig. 1, the reduction of feather mass reached 20 and 40% in the heterozygous (Na/na) and homozygous (Na/Na) birds respectively, compared with their normally feathered (na/na) birds (Merat, Reference Merat1990; Yunis and Cahaner, Reference Yunis and Cahaner1999; Cahaner et al., Reference Cahaner, Ajuh, Siegmund-Schultze, Azoulay, Druyan and Zárate2008). The naked-neck birds may therefore be able to withstand the high ambient temperatures (Helal and El-Gendy, Reference Helal and El-Gendy2014). This gene is located at 13 cM interval in the distal region of chromosome 3 (Mou et al., Reference Mou, Pitel, Gourichon, Vignoles, Tzika, Tato, Yu, Burt, Bed'Hom and Tixier-Boichard2011).

Fig. 1. Different genotypes of NA gene, homozygous naked-neck (NA/NA), heterozygous naked-neck (NA/na) and fully feathered homozygous na (na/na).
Quantitative genetics play a significant role in the improvement of chickens. Approximately 85–90% of the overall change in chickens have been attributed to selection for increased body weight (BW) (Havenstein et al., Reference Havenstein, Ferket and Qureshi2003). Because the molecular techniques allow for the assessment of the individuals at genotypic rather than the phenotypic level (Siegel et al., Reference Siegel, Haberfeld, Mukherjee, Stallard, Marks, Anthony and Dunnington1992), they have been integrated with the techniques of classical breeding to obtain the maximum improvement of different traits. These techniques would also allow us to overcome the limitations in classical breeding. Recently, the molecular genetics emphasis has shifted from identifying quantitative trait loci (QTL) to marker-assisted breeding using dense maps covering the entire genome (Bijma and Bovenhuis, Reference Bijma, Bovenhuis and Hocking2009). The use of modern techniques of molecular genetics in selection programmes rests on the ability to determine the genotype of individuals using DNA analysis. Such information can be then used to assess the breeding values of the individuals that can be used for selection (Dekkers and Hospital, Reference Dekkers and Hospital2002). For this, marker-assisted selection (MAS) has been developed, where genetic markers linked with QTL allow for the direct selection on genotype (Lamont et al., Reference Lamont, Lakshmanan, Plotsky, Kaiser, Kuhn, Arthur, Beck and O'Sullivan1996). Uemoto et al. (Reference Uemoto, Sato, Odawara, Nokata, Oyamada, Taguchi, Yanai, Sasaki, Takahashi, Nirasawa and Kobayashi2009) denoted the potential to accelerate the genetic improvement in chicken populations by MAS of QTL in immature chickens. MAS was used to produce high BW chickens with low amounts of abdominal fat (Tatsuda, Reference Tatsuda2016), and to produce chickens exhibiting blue-eggshell and dwarf traits (Cui et al., Reference Cui, Shen, Zheng, Su, Cai, Yu, Yang, Chen, Wen and Zhao2019). Li et al. (Reference Li, Deeb, Zhou, Ashwell and Lamont2005) reported the significance of MAS to increase selection efficiency and make further improvements in production performance. Also, the significance of MAS to increase selection efficiency and make further improvements in production performance was reported (Li et al., Reference Li, Deeb, Zhou, Ashwell and Lamont2005). Van Der Beek and Van Arendonk (Reference Van Der Beek and Van Arendonk1996) indicated additional selection responses of 6–13% using MAS by the incorporation of marker-linked QTL into a simulation study after five generations of selection. Similar findings were obtained by Gomez-Raya and Klemetsdal (Reference Gomez-Raya and Klemetsdal1999). Among the markers that can be used for MAS are microsatellite markers (Guimarães et al., Reference Guimaraes, Ruane, Scherf, Sonnino and Dargie2007; Canales Vergara et al., Reference Canales Vergara, Landi, Delgado Bermejo, Martínez, Cervantes Acosta, Pons Barros, Bigi, Sponenberg, Helal, Banabazi and Camacho Vallejo2020).
Therefore, the objective of this study was to use the data of growth patterns of two local chicken lines in Egypt selected for high 6-week BW accompanied by their molecular data to develop a strategy for marker-assisted selection for growth in local chickens in the developing countries.
Materials and methods
Breeding stock and management
The current study was part of a selection scheme for a rapid growth rate in a naturally heat-resistant native breed in Egypt (El-Gendy, Reference El-Gendy2009a, Reference El-Gendy2009b). The prenatal stock was established crossing between commercial male line grandparents and two lines of the local chickens (Baladi), a naked-neck line and a normally feathered line. Selection was practiced and four lines were obtained, line CE1, which exhibits normal feathering, line CE3, which exhibits homozygous naked-necks and two randomly bred control lines CE2 and CE4, which serve as control lines for lines CE1 and CE3, respectively. In the current study, we consider the 6th generation as the base generation for marker-assisted selection study. Two subsequent selected generations were obtained from the base generation.
At hatch, the chicks of each line were pedigreed by wing banding and weighed. Chicks of all lines were reared together in floor brooding chambers to 6 weeks and in floor pens to 16 weeks of age, in a conventional-housing system. The selected lines were thereafter housed in individual caging system for sexual maturation and laying eggs, whereas the two control lines were remained on the floor pens. The Na/Na and Na/na chickens were differentiated by examination of the tuft of feathers on the ventral side of the neck (Fig. 1) as suggested previously (Scott and Crawford, Reference Scott and Crawford1977). Upon maturation, the selected birds within line were arranged in cages, so that artificial insemination was practiced where each selected male was mated to three to five females. The chickens of each control line were naturally and randomly mated, with a sexual ratio of one male to five to six females. The chicks were fed ad libitum a broiler starter ration (22–23% CP and 2800 kcal ME/kg) during 0–4 weeks of age, and a broiler finisher ration (19–20% CP and 3100 kcal ME/kg) during 4–8 weeks of age. Birds received a growing ration (15% CP and 2700 kcal ME/kg, 120 g/bird/day) during 8–18 weeks. The parental chicks were fed a pre-laying ration (17% CP and 2800–2850 kcal ME/kg, 140 g/bird/day) until 20 weeks. By 20 weeks of age, birds received a laying ration (16% CP and 2800–2850 kcal ME/kg, 150 g/bird/day). Drinking water was provided ad libitum. Birds were subjected to continuous lighting from hatch to 8 weeks of age, and then the birds were subjected to 14–15 h of light per day using natural and supplemental light. By week 17 of age, the lighting period was increased to 16–17 h per day.
DNA fingerprinting procedures
Blood samples were collected based on the BW records, using a two-tail method. Samples were collected at random from the two selected lines in the base generation, where 3–5 ml blood were drawn from the wing vein of ten randomly assigned individuals in each line. In the second and third generations, three sire families for each tail of the selected lines were assigned and 3–5 ml blood were individually collected. In each generation, blood samples were drawn from ten randomly assigned individuals in each control line. All blood samples were collected in 5 ml tubes containing EDTA as an anticoagulant. Blood samples were immediately stored at −20°C until use.
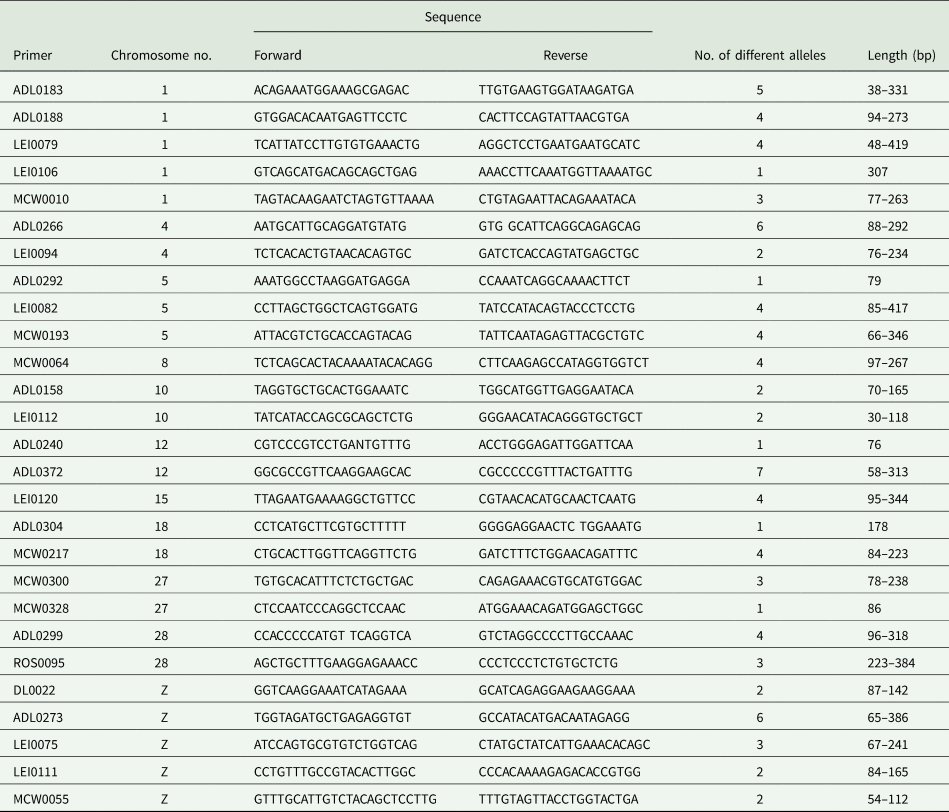
The stored blood samples were thawed and 300 μl of each sample were used to extract genomic DNA according to the Wizard Genomic DNA Purification Kit (Promega Corporation, Madison, USA). DNA concentrations in the samples were determined by using a spectrophotometer (OPTIMA, Germany). Samples of each line in the base generation were divided into two groups. The samples of each group were mixed together based on their concentrations to form one pooled sample. So, two pooled samples were formed for each of the four lines. In the first and seconded generations, the individual DNA samples, within family, line and generation, were mixed together, according to the concentrations, to form one pooled sample per family. For the control lines, all individual DNA samples were divided into two groups, to produce two pooled samples. The total number of pooled DNA samples, over all families, lines and generations were 39 samples. Twenty-seven microsatellite markers (Metabion International, Germany) were chosen carefully to cover different regions of the chicken genome and were used for DNA genotyping by polymerase chain reaction (PCR). Number of microsatellite markers, the chromosomes on which they detect regions and their forward and reverse sequences are presented in Table 1. All markers were chosen carefully based on their association with growth traits in chickens. More information about markers and genomic measurements resulted from the molecular analysis were documented by El-Gendy and Helal (Reference El-Gendy and Helal2014).
Table 1. Microsatellite primers used, the chromosome numbers on which microsatellite markers can be recognized and their forward and reverse sequences
The PCR analysis was carried out using a Master Mix solution (Bio Basic, Canada), to prepare a mixture with a total volume of 25 μl. The composition of the mixture included 12.5 μl of PCR master mix, 2.5 μl of DNA sample, forward and reverse primers and 5 μl of sdH2O. The PCR programme included initial denaturation temperature of 95°C for 5 min, followed by 35 cycles of denaturation at 94°C for 45 s. The annealing was for 45 s using an annealing temperature varied according to the microsatellite markers and ranged between 53 and 56°C. The extension was at 72°C for 1 min, then the final extension was at 72°C for 10 min. PCR products were then separated using electrophoresis and DNA bands were visualized and photographed by a gel documentation system.
Measurements, parameters and statistical analysis
BWs were obtained at hatch and then biweekly until 20 weeks of age on individual basis. The frequencies of different alleles were calculated for all detected alleles. A general linear model of the statistical analysis system (SAS, 1999) was applied to the data set of growth parameters. The model considered line and sex and their interactions as main effects. Least square means were obtained and mean comparisons were assessed previously (Duncan, Reference Duncan1955). The molecular data set was conjugated to the growth performance data set, and then multivariate analysis was applied to the data. Principal component analysis (PCA) was used to reveal major patterns of genetic variability based on the allele frequencies, banding patterns and 6-week BW data using SAS software (SAS, 1999).
Results
Growth performance
The effect of line on the growth of chicks in the subsequent generations was highly significant (P < 0.001). Line differences were eventually attributed to the breeding scheme by which each line has been derived. The effect of sex on the chick growth was significant in the base and first generations. In the second generation, the effect of sex on the growth of chicks was significant (P < 0.01) only during the early ages; however, the growth differences in both sexes during the 6–12 and 12–18 week periods were insignificant. The effect of line-by-sex interaction on growth performance was obviously significant (P < 0.05) at the early ages in the subsequent generations. The effect of line-by-sex interaction seemed to have a similar pattern to the sex effect. These significances for the effects of the genetic background, sex and their interactions on growth performance were earlier reported in the establishment of the genetic lines under this study (El-Gendy, Reference El-Gendy2009a, Reference El-Gendy2009b).
BWs of the selected lines and their corresponding control lines in the base generation are presented in Table 2. The normally feathered selected line (CE1) was significantly heavier than its control line (CE2) by 4.78% at hatch. The significant increases in BWs during the growing period of line CE1, compared to line CE2, were consistent and tended to be gradual and reached 54.70% at 20 weeks of age. The naked-neck selected line (CE3) also showed a significant difference from line CE4 by 12.43% at hatch and consistently increased to 70.84% at 20 weeks of age.
Table 2. BWs (LSM ± s.e., g) with age of the different lines in the base generation

CE1, CE2, CE3 and CE4 indicate normally feathered selected, normally feathered control, naked-neck selected and naked-neck control lines, respectively.
* Indicates significant differences between selected and control lines at 5%.
Similar to the results obtained in the base generation, BWs of both selected lines responded to the selection throughout the growing period in the subsequent generations. In the first selected generation, line CE1 was significantly heavier than line CE2 by 12.13% at hatch (Table 3). A gradual and significant increase in BW of line CE1 compared to line CE2 was associated with age and reached 52.32% at 8 weeks of age, then the increase in BW remained significant, but declined to 24.66% at 20 weeks of age. A similar trend was shown in line CE3 that was significantly heavier than line CE4 by 12.13% at hatch and fluctuated in a significant upward trend to reach 55.60% at 14 weeks of age and declined to 29.16% at 20 weeks of age. In the second selected generation (Table 4), both selected lines tended to grow in similar patterns, and were significantly heavier than their corresponding control lines over all the growing period. The absolute values of BWs for all lines were apparently less than BWs obtained in the base and first selected generations. This was due to the shortage in feedstuff supplies during the growing period, so the amounts of feed available to the chicks were very limited. In spite, both selected lines showed significant and satisfactory selection progress compared to their progress in the base and first selected generations over all the growing period. The selection progress in both selected lines obviously fluctuated up and down throughout the growing period and reached to 51.33 and 34.48% at 6 weeks of age and 49.28 and 28.72% at 18 weeks of age for lines CE1 and CE3, respectively.
Table 3. BWs (LSM ± s.e., g) with age of the different lines in the first selected generation

CE1, CE2, CE3 and CE4 indicate normally feathered selected, normally feathered control, naked-neck selected and naked-neck control lines, respectively.
* Indicates significant differences between selected and control lines at 5%.
Table 4. BWs (LSM ± s.e., g) with age of the different lines in the second selected generation

CE1, CE2, CE3 and CE4 indicate normally feathered selected, normally feathered control, naked-neck selected and naked-neck control lines, respectively.
* Indicates significant differences between selected and control lines at 5%.
Marker-assisted selection
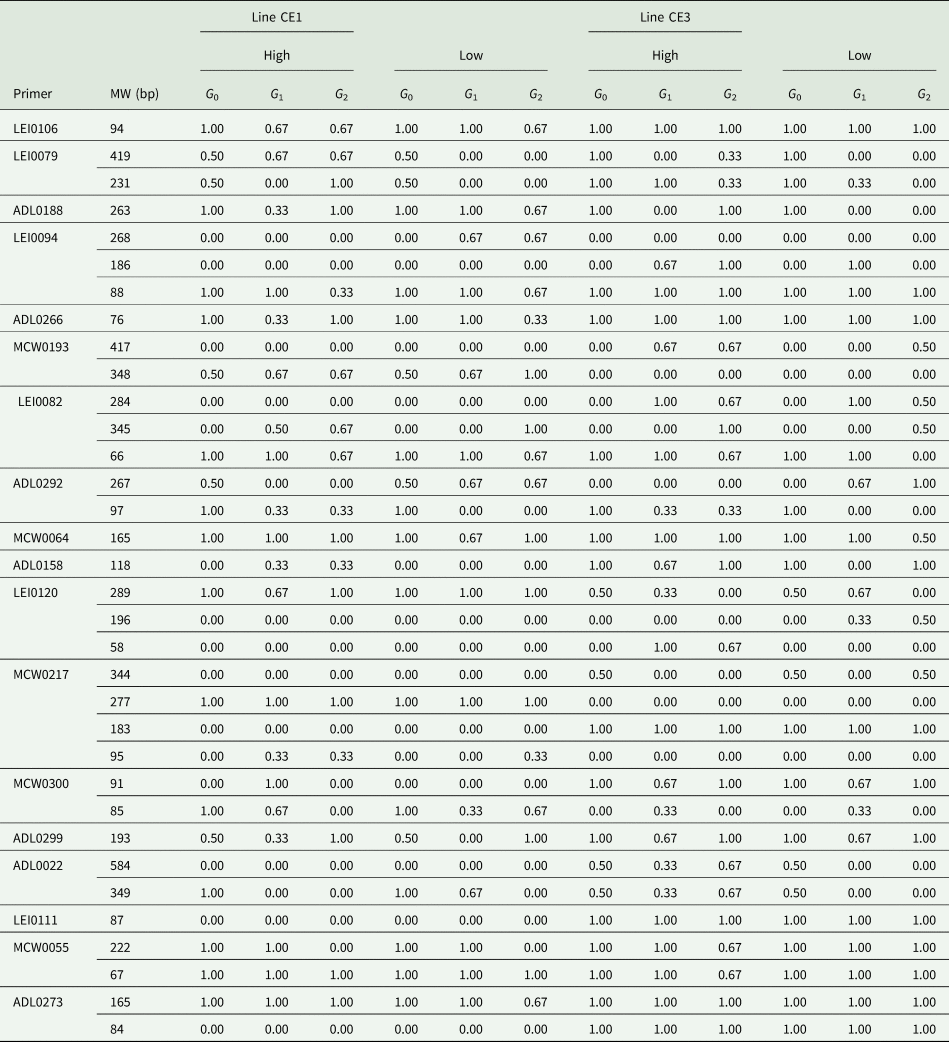
The molecular information about the different loci, including variability, distance indices and markers informativeness were described previously (El-Gendy and Helal, Reference El-Gendy and Helal2014). The allele frequency differed in different lines, where lines had high frequencies for many alleles and low to rare frequencies for many other alleles. Many alleles were lowly frequent and many other alleles were highly frequent in all lines. The families forming both selected lines were relatively classified according to the two tails of each line into sire families with high (H) or with low (L) average 6 weeks. Many allelic bands were differed in their frequencies among H and L families within the selected lines. So, families H and L can also be distinguished by the allelic bands appeared in their banding patterns as well as the phenotypic performance. The alleles were tracked for their flow over subsequent generations, and those flown differently in different lines were mapped and their frequencies were calculated (Table 5).
Table 5. Frequencies of the allelic bands flown over subsequent generations in different trends of both selected lines
CE1 and CE3 indicate normally feathered selected and naked-neck selected lines, respectively.
A total of 34 alleles in 19 loci were flown over generations and the flow trends were different in different lines and families within lines. In this concern, the allelic band of 94 bp detected by LEI0106 was found in all lines, but it was in a decreasing frequency of 1.00–0.67 over generations in both H and L families of line CE1. The allelic bands of 419 and 231 bp detected by LEI0079 were flown with a high frequency over subsequent generations in H families in both selected lines CE1 and CE3. Also, the allele detected by ADL0188 at 263 bp tended to flow with increasing frequency in H families and with decreasing frequency in L families of both lines CE1 and CE3. In contrast, the allele detected at 268 bp LEI0094 was only found in L families line CE1 with an increasing flow trend to a frequency of 0.67. The allele of 76 bp detected by ADL0266 was increasingly flown in H families and decreasingly flown in L families of normally feathered selected line CE1; however, it was flown with high frequency in both H and L families of the naked-neck selected line CE3. Also, two alleles detected by LEI0094 were increasingly flown in line CE3 (186 bp) and decreasingly flown in line CE1 (88 bp). The allele of 76 bp amplified by marker ADL0266 was increasingly flown in H families and decreasingly flown in L families of line CE1. The DNA allele of 417 bp recognized by MCE0193 was increasingly associated with H families of the naked-neck selected line CE3. However, MCW0193 detected two alleles at 348 bp and specific for line CE1 with increasing frequency over generations in L families and at 284 bp specific for line CE3 but in a decreasing flow trend. The microsatellite marker ADL0292 detected an allelic band of 267 bp only in L families of both selected lines; however, the allelic band of 97 bp was only flown among H families to a frequency of 0.33 in both lines. Also, ADl0158 amplified an allele at 118 bp in H families of line CE1 and in both H and L families of line CE3 but with higher frequencies over generations. The allelic band of 196 bp detected by LEI0120 was only found in the L families of line CE3, but with frequencies of 0.33 and 0.50 in the first and second selected generations. Also, LEI0120 detected an allelic band of 58 bp in H families of line CE3 with frequencies of 1.00 and 0.67 in the first and second selected generations, respectively. The primer MCW0217 detected an allele at 277 bp specific for the normally feathered selected and control lines CE1 and CE2 v. an allele at 183 bp specific for the naked-neck selected and control lines CE3 and CE4. The allelic band of 95 bp amplified by MCW0217 was specific for line CE1, but with a frequency of 0.33 in H families over generations. The marker MCW0300 amplified an allele at 85 bp that was decreasingly flown in H families of line CE1. Primer ADL0022 recognized two alleles at 584 and 349 bp that were flown in an increasing trend in H families of line CE3. The allele of 84 bp detected by ADL0273 was recognized only in the lines CE3 and CE4.
In line CE1 (Table 6), seven components were derived. There were two relatively large eigenvalues (2.022 and 1.456). The first component explained 40.44% of the common variance in the line and the second component explained 29.13% of the variation. There were two other components shared by 19.12 and 11.32%. The first three components explained 89% of the common variation. These results indicate that the genome analysis across generations is suitable enough to explain the variation within line. However, the analysis has accounted most of the variation into only two main components. The first component had a positive and large contribution of 6-week BW in generations 1 and 2 with high correlation of 0.99571 with each. However, the contribution of DNA banding and gene frequency in generation 2 were only 0.03780 and 0.04535 with a negative contribution of gene frequency in generation 1. The second component was concentrated on the large and positive contribution of gene frequencies in generations 1 and 2 with high correlation of 0.81575 and 0.74869; however, the contributions of 6-week BW in generations 1 and 2 were little with a correlation of 0.06910 with each. It is concluded that all the variables contributed to the variability in the line among generations with final estimates of as high as 0.9962 for 6-week BW in generations 1 and 2 and as low as 0.2225 for DNA banding. However, the contribution of the data of the base generation by either gene frequency or 6-week BW was totally absent. In line CE3 (Table 6), also four of seven components totally explained the standardized variation in the line. The first two components explained 77.42% of the variation and three components explained 91.17%, which could be adequate to figure out the variation of the line. The contribution of fourth component was low, but was still required to figure out the line variation. Two components were considered significant to explore the causes of variation within the line. The first component consisted of positively high correlation of 0.84676 for 6-week BW in each of generations 1 and 2, and moderate effect of gene frequencies in generations 1 and 2; however, the effect of DNA banding was negative and fairly low (−0.33990). The second component had highly medium correlation of 0.64751 with DNA banding and medium correlation with 6-week BW in generations 1 and 2 against negative effects of gene frequencies in generations 1 and 2.
Table 6. PCA for the banding patterns and 6-week BWa in the subsequent generations in lines CE1 and CE3

CE1 and CE3 indicate fully feathered and naked-neck selected line; G 0, G 1 and G 2 indicate base, first and second generations, respectively.
a 6-week BW was calculated as the deviation from the corresponding control lines.
The summary of this analysis confirms the contribution of the variables in figuring the line variation with high final estimates of 0.9939 for 6-week BW in each of generations 1 and 2, and moderately high estimates of 0.7206 and 0.6228 for gene frequencies in generations 1 and 2 and final medium contribution of 0.5349 for DNA banding. Similar to line CE1, no contribution was shown for the gene frequency and 6-week BW of the base generation. It is worthy to note that more variation is found in line CE3 compared to line CE1, which was obviously accounted for the contribution of DNA banding and gene frequencies over subsequent generations.
The results of the standardized variance in line CE1 are presented in Table 7. Four of seven components were appeared to explain the variation within the line. However, the first three components with eigenvalues of 2.1127, 1.8013 and 0.9501 provided an interpretation of 97.28% of the variation, which is much bigger than the explanation given by the first three components (88.68%) for the line when all detected alleles were considered. This result strongly supports the screened alleles to better explain the variation. The contribution of the fourth component was neglected since it was only 2.72%. Two major components were derived. The first component was mainly attributed to the variation in 6-week BW in generations 1 and 2 mainly attributed to the variation in 6-week BW in generations 1 and 2 with coefficient of 0.95331 in each, against negative and moderate contribution of gene frequency in generations 1 and 2. The second main component attributed the variation to the highly positive effects of gene frequency in generations 1 and 2 with correlations of 0.95111 and 0.76576 v. low contribution of 6-week BW during the same generations. The effect of DNA banding pattern was negative but valuable (−0.37252). Except for the data obtained in the base generation and the final low estimate of DNA banding of 0.14315, the data obtained in generations 1 and 2 indicated high final estimates ranging from 0.85677 to 0.99459.
Table 7. PCA for the banding patterns of the bands associated with lines CE1 and CE3 in the subsequent generations

CE1 and CE3 indicate fully feathered and naked-neck selected line; G 0, G 1 and G 2 indicate base, first and second generations, respectively.
a 6-week BW was calculated as the deviation from the corresponding control lines.
The results of PCA in line CE3 (Table 7) revealed three components explained 93.41% of the variation, therefore the fourth component was also valuably considered although its contribution was of 6.59%. The first main component consisted of approximately equal contributions of all variables with moderate to high moderate coefficients, however the effect of DNA banding was negative and the data of the base generation were totally absent. The second main component attributed the variance mainly to approximately equal contributions of DNA banding and 6-week BW in generations 1 and 2 against negative contribution of gene frequency in generations 1 and 2. The final estimates ranged from 0.6949 to 0.9958. The results in general indicate more variation in line CE3 than in line CE1. High contribution was almost shown for all variables, except for the variable derived by the data of the base generation. Also, the alleles associated with each line were strongly recommended.
Because the assigned DNA alleles associated with each selected line were of significance, so the canonical correlations with 6-week BW in the subsequent generations were obtained overall selected lines. Three canonical correlations were obtained. The largest correlation estimate was 0.4513, which majorly showed the relationship between the molecular and phenotypic data among generations by 81.34%. The second correlation was 0.2354, and showed the remaining part (16.66%) to observe the relationship. Therefore, the third correlation was neglected.
As shown in Fig. 2, four and five polymorphic alleles were persistently concomitant with the highly performed families in lines CE1 and CE3, respectively. These alleles would have brought 6-week BW into higher levels of performance if they would have been considered in the selection for 6-week BW in lines CE1 and CE3 as shown in Table 8 and Fig. 3. The results indicate that 6-week BW of line CE1 would have possibly increased by 37.5 and 25.1% in the base and second selected generations. The increase that would have possibly achieved in 6-week BW in line CE3 is 20.0 and 16.6% in the base and second selected generations.
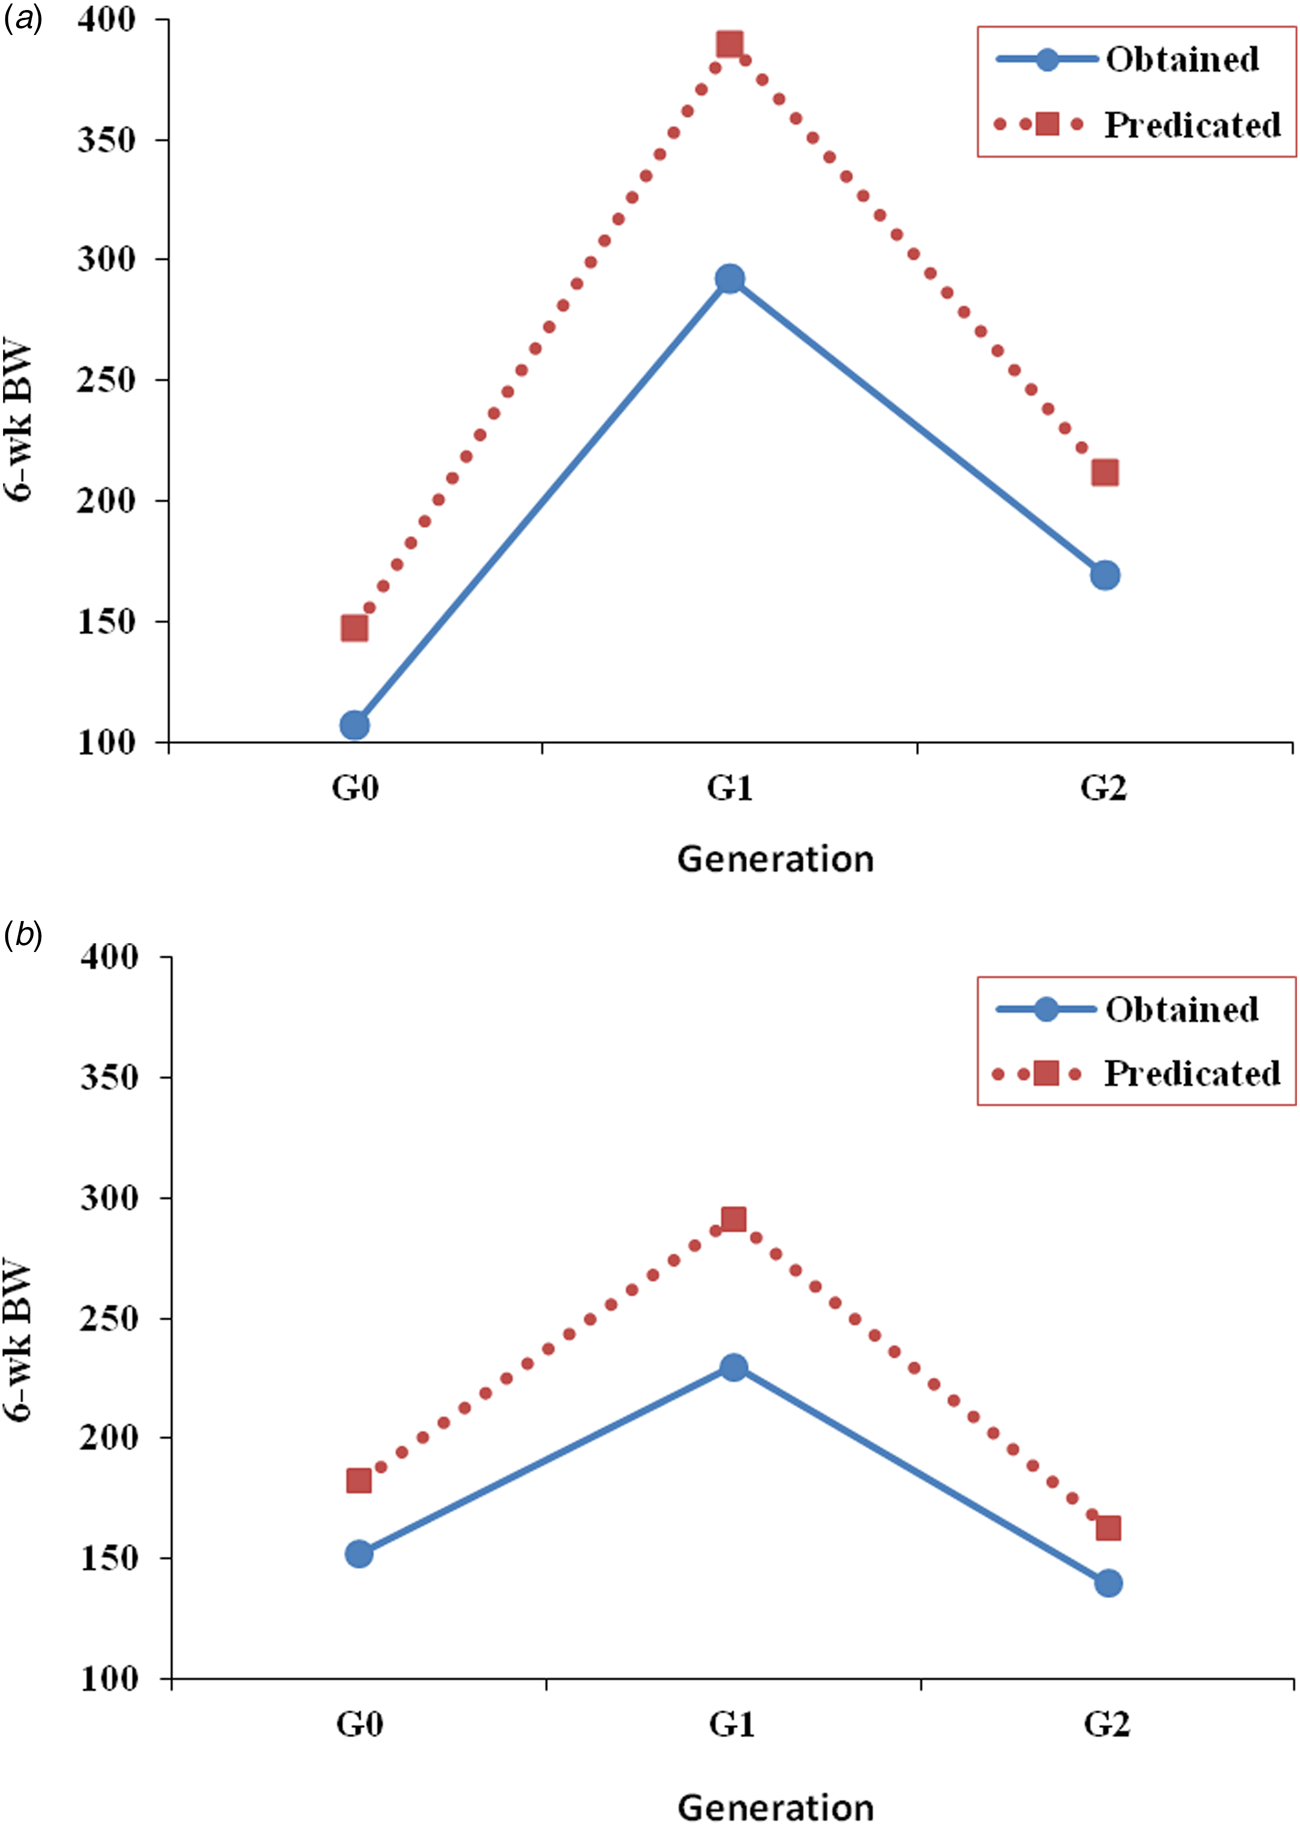
Fig. 2. Differential changes in the allelic frequency of the selected alleles over generations in low- and high BW families.

Fig. 3. Obtained and predicted 6-week BW (g), as a deviation from the corresponding control of line CE1 (a) and line CE3 (b) in the subsequent generation.
Table 8. Predicted mean 6-week BW (g) of the selected lines CE1 and CE3

Six-week BW is calculated as a deviation from the control; CE1 and CE3 indicate normally feathered and naked-neck selected lines; G 0, G 1 and G 2 indicate base, first and second generations, respectively.
* Significant at 5%.
Discussion
The results of body weighs over the subsequent generations indicate that the normally feathered selected line was significantly heavier than the naked-neck selected line throughout the growing period, and this was shown mostly in the second generation. These results were in agreement with the results obtained previously by El-Henfnawy et al. (Reference El-Henfnawy, El-Gendy, El-Kaiaty and Helal2022). This indicates that the naked-neck chickens grew at a slower rate compared to the normally feathered birds under limited feeding. The differences in BWs between both control lines were significant, line CE2 was heavier than line CE4 in the base and first generations, but the differences were insignificant in the second generation. Such results indicate that local chickens are well adapted to the environmental conditions, and the naked-necks tend to have lighter weights. El-Gendy et al. (Reference El-Gendy, El-Komy, El-Far, El-Gamry and El-Mallah2011) and Yahav et al. (Reference Yahav, Straschnow, Plavnik and Hurwitz1996) attributed the ability of naked-neck birds to withstand the high environmental temperature to the reduction of feather mass by 20 and 40% over the body surface that leads to an efficient heat dissipation. It is worth to note that most of the differences in BWs between the selected lines or between the control lines at later ages were mostly insignificant. The results denote that selection progress was shown throughout the entire growing period, although the selection was focused on 6-week BW in both selected lines. Also, the selection progress in both normally feathered and naked-neck lines were mostly similar. The fluctuation, in decreasing rate, in the response to selection over subsequent selected generations is expected and attributed to the population size, the genetic variation existed and the rate of inbreeding (Leitch et al., Reference Leitch, Smith, Burnside and Quinton1994; Havenstein et al., Reference Havenstein, Ferket and Qureshi2003). Deeb and Cahaner (Reference Deeb and Cahaner2002) reported that the chickens selected for high BW at fixed age tended to have higher BWs than the controls at all ages. The responses to divergent selection for exponential growth rate at 14 or 24 days of age were different and confirmed the alteration of juvenile growth patterns due to selection (Barbato, Reference Barbato1992). The alteration of growth pattern due to selection was also confirmed by (Liu et al., Reference Liu, Dunnington and Siegel1994; Anthony et al., Reference Anthony, Nestor and Marks1996; Mignon-Grasteau et al., Reference Mignon-Grasteau, Beaumont and Ricard2001; Reference Mignon-Grasteau, Piles, Varona, De Rochambeau, Poivey, Blasco and Beaumont2000).
The tracking of the inheritance of different allele indicates that many allelic bands were flown over subsequent generations in either an increasing or decreasing frequency trend in the sleeted lines CE1 and CE3. The change in allelic frequency over subsequent generations was clearly expressed in the two tails of each selected lines, where H and L families were associated with such changes. In fact, the increases of the frequencies of specific alleles in H families reflect the accumulation of these alleles in the selected line. Hoeschele and VanRaden (Reference Hoeschele and VanRaden1993) and Lamont (Reference Lamont2003) denoted that the appropriate statistical analysis of the phenotypic and genotypic data would be the key to detect the DNA markers that can be used in MAS. When sire families in each selected line were ranked according to the performance in any of the growth parameters, it was found that the ranks were almost similar for BWs at 4, 6, 8 10 and 12 weeks of age and BW gains and growth rates measured between 4 and 12 weeks of age, and were somewhat different at older ages. Therefore, these traits received much concern in response to the frequency change of almost the same alleles over the subsequent generations. (El-Gendy, Reference El-Gendy2009a, Reference El-Gendy2009b) evaluated the change in allele frequency over three selected generations in two local Egyptian chicken lines. It was concluded that genomic alleles may be employed to monitor the change in allele frequency over subsequent generations. In mice, selection was practiced for 6-week BW for 21 generations (Keightley et al., Reference Keightley, Hardge, May and Bulfield1996). Sharp peaks of frequency change at linked markers were detected indicating the presence of single genes of moderate effect.
Because of the medium to moderately high and significant contribution of the molecular data in the account for the variation within lines CE1 and CE3, the alleles that have been shown to associate each line in the subsequent generations were statistically analysed with the contribution of 6-week BW data. Eleven polymorphic alleles were associated with line CE1 and 13 polymorphic alleles were associated with line CE3. These alleles were found in many chromosomes as presented. The alleles were detected by the microsatellite primers that have amplified alleles associated with growth traits (Carlborg et al., Reference Carlborg, Kerje, Schütz, Jacobsson, Jensen and Andersson2003; Ikeobi et al., Reference Ikeobi, Woolliams, Morrice, Law, Windsor, Burt and Hocking2004; Uemoto et al., Reference Uemoto, Sato, Odawara, Nokata, Oyamada, Taguchi, Yanai, Sasaki, Takahashi, Nirasawa and Kobayashi2009; Podisi et al., Reference Podisi, Knott, Dunn, Law, Burt and Hocking2011; Tatsuda, Reference Tatsuda2016). These alleles have been flown in different frequencies among the subsequent generations in each line. Many of the alleles were shared in both lines, and some were specific to either line.
The tendency of allelic alleles to flow over generations led to reduce the number of screened and associated alleles for each line, and this would make using DNA markers more efficient in selection programme. Dekkers (Reference Dekkers2004) identified three types of MAS of observable polymorphic genetic loci that can be distinguished and are currently being used in the livestock industries. The allelic bands that have shown polymorphism and continuous flow over generations and concomitant with the high 6-week BW were screened, and alleles that showed an accumulation trend in high-BW families along with a constant or a decreasing tendency in low-BW families were subjected to further analysis to estimate the response of selection if they were included as a selection criterion. The response to MAS is expected to increase in many cases such as the high frequency of heterozygote at the relevant genes (Wang et al., Reference Wang, Gu, Feng, Song, Hu and Li2012) and the short distance between marker and QTL with a large effect (Spelman and Bovenhuis, Reference Spelman and Bovenhuis1998). Van Der Beek and Van Arendonk (Reference Van Der Beek and Van Arendonk1996) indicated additional selection responses of 6–13% using MAS by the incorporation of marker-linked QTL into a simulation study after five generations of selection. Meuwissen and Goddard (Reference Meuwissen and Goddard1996) evaluated possible increases of 30–64% in the genetic response to selection of different characteristics obtained in the first five generations. Pongpisantham (Reference Pongpisantham1994) found that the inclusion of markers could increase up to 15% of the genetic response to selection for growth rate in a chicken population, compared with the responses to family selection. Lahav et al. (Reference Lahav, Atzmon, Blum, Ben-Ari, Weigend, Cahaner, Lavi and Hillel2006) reported that larger number of density markers yielded higher genetic response. However, Helal et al. (Reference Helal, Hany, Maged, Abdelaziz, Osama, Younan, Ismail, Abdelrahman and Ragab2022) denoted the possibility of using low dense markers for accelerating the genetic changes in local rabbit breeds.
The obtained results proved the successful application of low-density marker-assisted selection in improving the BW of local chickens. In our study, four and five polymorphic alleles were found to be persistently concomitant with the highly performed families in lines CE1 and CE3, respectively. These alleles would have brought 6-week BW into higher levels of performance if they would have been considered in the selection for 6-week BW. Finally, we recommend adopting the methodology by searching for more candidate alleles for MAS in local chickens.
Author contributions
EAE conceived and designed the study. MMH conducted data gathering. EAE and MMH performed statistical analyses. EAE and MMH wrote the article.
Financial support
This research did not receive any specific grant from funding agencies in the public, commercial or not-for-profit sectors.
Conflict of interest
The authors have no conflicts of interest to declare.
Ethical standards
Ethical approval was not needed for this study, where blood samples were collected from the different chicken lines by qualified veterinarians without injuring the animals several years ago.


