


Due to the high prevalence of paediatric obesity worldwide, despite a trend towards a stabilisation of this epidemic(Reference Rokholm, Baker and Sørensen1), early clinical screening must be improved in a preventive perspective. Amongst other factors, the detection of an adiposity rebound (AR), defined as ‘the point at which the BMI increases after its nadir’(Reference Rolland-Cachera, Deheeger and Maillot2,Reference Dietz3) , before the age of 5·5 years, named ‘early AR’(Reference Rolland-Cachera, Deheeger and Maillot2,Reference Rolland-Cachera, Deheeger and Bellisle4) (EAR), has been defined as a reliable indicator for future obesity(Reference Rolland-Cachera, Deheeger and Maillot2,Reference Rolland-Cachera, Deheeger and Bellisle4–Reference Whitaker, Pepe and Wright6) .
Adipose tissue undergoes physiological changes during the early years of life, with a rapid increase during the first year due to the growing size of the adipocytes and then a decrease during the following years, to remain stable until the age of 6 years. Thereafter, body fat shows a second phase of rapid growth, named ‘AR’, which was first reported and documented by Rolland-Cachera et al. (Reference Rolland-Cachera, Deheeger and Bellisle4). According to these and other authors, there is an association between the age at which AR occurs and adiposity at age 16 years(Reference Rolland-Cachera, Deheeger and Bellisle4,Reference Williams and Goulding7) . Later studies also documented the importance of EAR, highlighting its association not only with cardiometabolic health development(Reference Di Gravio, Krishnaveni and Somashekara8) but also with maturation disorders, among others(Reference Sun, Fang and Yang9,Reference Marakaki, Karapanou and Gryparis10) . Several studies have investigated the potential risk factors associated with the occurrence of this EAR, particularly focusing on antenatal and postnatal factors(Reference Reilly, Armstrong and Dorosty11,Reference Ip, Marshall and Saldana12) . For instance, maternal and paternal obesity are now recognised as strong risk factors for accelerated weight growth trajectory(Reference Toschke, von Kries and Beyerlein13,Reference Dorosty, Emmett and Cowin14) .
Undeniably, the description of EAR and its associated antenatal and postnatal risk factors constituted a major step for the understanding and management of childhood overweight, whose prevalence is still dramatically increasing worldwide(Reference Han, Lawlor and Kimm15). In France, 17 % of children and adolescents aged 6–17 years are overweight, including 4 % who are obese(Reference Verdot, Torres and Salavane16). However, the current definition of the EAR does not seem to be sufficiently discriminating. Accordingly, although Hughes et al. reported that 58 % of children identified as having an EAR before the age of 3·6 years were actually overweight at 15 years old, only 22 % of those identified with an EAR by the age of 5 years actually became overweight at 15 years old(Reference Hughes, Sherriff and Ness17).
In 2006, Rolland-Cachera et al. (Reference Rolland-Cachera, Deheeger and Maillot2) described two profiles of early rebounders, namely ‘fat children’, who start their EAR at the top of their corpulence chart, and ‘lean children’, who start their EAR at the bottom of their corpulence chart (using French curves(18)). On the other hand, Thibault et al., in 2010, identified in a French cohort of 1424 children aged 8–9 years that the combination of the criterion ‘overweight at 3–4 or 5–6 years’ and ‘increase in BMI > 1 kg/m2 between 3–4 and 5–6 years’ was a good predictor of the risk of overweight at 8–9 years(Reference Thibault, Meless and Carriere19). Based on these studies, and given that only a modest proportion of children identified with EAR actually become overweight/obese(Reference Hughes, Sherriff and Ness17), we aimed to refine the definition of EAR using French curves related to the International Obesity Task Force (IOTF) references(18). Thus, we considered both the BMI z-score at the starting point of the EAR (BMI nadir) and the BMI trajectory. Indeed, it remains unclear whether the velocity of the BMI curve during EAR systematically predicts future overweight/obesity or not. Therefore, in order to properly identify children most at risk for future overweight/obesity, we proposed a classification of EAR into two classes, based on both initial BMI and BMI trajectory, namely: type A-EAR and type B-EAR.
The objectives of the present study were: 1) to compare the clinical characteristics at birth, at age 3–5 years and at age 6–8 years of children, according to the presence or absence of EAR and, according to the type of EAR (type A and type B-EAR) and 2) to assess the childrenʼs odds of being classified as overweight/obese at age 6–8 years, according to the type of EAR as defined at age 3–5 years. We further hypothesised that children exhibiting a type A or type B-EAR would exhibit similar clinical characteristics at birth, and that exhibiting a type A-EAR at age 3–5 years would be associated with a greater risk of overweight/obesity at age 6–8 years when adjusting for antenatal and postnatal factors, compared with children from the non-EAR group.
Materials and methods
Design and population
This longitudinal, multicentre, observational study was conducted in the Department of Haute Saone, France, among children born between 1 January 2003 and 1 May 2005. As described below, two waves of evaluations were performed: the first at 3–5 years of age and the second at 6–8 years of age. Fig. 1 presents the flow chart of the study.

Fig. 1. Flow chart of the study population.
Wave 1: a total of 1159 French children were enrolled in public and private pre-schools, as part of the annual medical examination at school. Between March and July 2008, data collection including antenatal and postnatal information was collected from the childrenʼs health record and from interview with the parents. Anthropometric measurements were performed by health professionals (nurses from the Protection of Mother and Infant service).
Wave 2: 3 years later, between March and July 2011, we performed a second set of measurements similar to those of wave 1, as part of the annual medical examination. In total, 921 children from the initial overall sample completed the second wave of measurements.
During each wave, anthropometric measurements of the children were performed and antenatal and postnatal information were collected during an interview with at least one parent.
We excluded children with secondary obesity such as syndromic, iatrogenic or endocrine obesity and children whose parents failed to attend the initial medical exam.
This study was approved by the Ethics Committee of the University Hospital of Besançon, France (under the number 13/22), by the French national advisory committee for the processing of data in health research (number 14.705) and by the national commission for data protection (number 914632). Legal representatives of participating children were informed of the procedures and provided written informed consent before enrolment of their child in the study.
Antenatal and postnatal information
Data related to birth and the first years of life were retrospectively collected from the childrenʼs health record and during the interviews with parents in the first wave:
Gestational age (extremely preterm (<28 weeks), very preterm (28–31 weeks), moderate preterm (32–33 weeks), late preterm (34–36 weeks) and term babies (≥37 weeks)) and body weight status at birth (hypotrophy, eutrophy or macrosomia, respectively, defined as birth weight <10th percentile, 10th–90th percentile or >90th percentile of the reference values) were collected and classified according to French references(Reference Salomon, Bernard and de Stavola20,Reference Torchin, Ancel and Jarreau21) . The motherʼs smoking status during pregnancy was collected during the interview. Body weight and height of the father and the mother (apart from pregnancy) were self-reported by the parents and used to calculate their BMI. The presence or absence of gestational diabetes and pregnancy-induced hypertension was self-reported by the parents.
Postnatal data concerned how the infant was fed (infant formula feeding or maternal breast-feeding and, if yes, for how long). Body weight and height of the child, taken from the childʼs health record, at birth and at 3, 9, 12, 24, 36 and 48 months, were collected to establish a graph of BMI.
Anthropometric measurements and body weight determination
Anthropometric measurements were conducted by health professionals during wave 1 and wave 2, as part of the annual medical examination. Body weight was measured to the nearest 0·1 kg using a calibrated scale, and height was determined to the nearest 0·01 m using a standing stadiometer for each child. BMI was calculated as body weight divided by the square of the height in m (kg/m2). BMI z-score, specific for age and sex, was calculated by the LMS method(Reference Cole and Lobstein22). Gestational age at birth for birth weight was calculated according to French reference data(Reference Salomon, Bernard and de Stavola20). Body weight status was classified into one of the three categories according to the IOTF references(Reference Cole and Lobstein22): thinness (<IOTF-17), overweight (25 < IOTF ≤ 30) and obesity (>IOTF-30). A classification according to the WHO references(23) was also performed, and the corresponding data are presented in online Supplementary Tables S1–S3.
Determination of the early adiposity rebound
BMI generally peaks during the first year of life and subsequently declines, reaching a minimum around the age of 6 years(Reference Rolland-Cachera, Deheeger and Maillot2). The point of minimal BMI value is the start of the AR. Each AR starting before the age of 5·5 years is usually considered as EAR(Reference Rolland-Cachera, Deheeger and Bellisle4). EAR was evaluated by two investigators: one trained and one untrained, in a blinded fashion, using BMI z-scores and French curves which refer to the IOTF references(18).
Determination of early adiposity rebound type A and type B
EAR was sub-classified into two types, namely: type A-EAR and type B-EAR.
Type A-EAR was defined according to two situations relative to the position of the BMI nadir in relation to the median (corresponding to a BMI z-score = 0 or to the 50th percentile):
1) If the BMI nadir is equal to or above the median (BMI z-score ≥ 0), a type A-EAR is defined when there is an increase of at least 0·5 units in BMI z-score between the starting point of the AR (BMI nadir) and the last point.
2) If the BMI nadir is below the median (BMI z-score < 0), a type A-EAR is defined when there is an increase equal to or greater than 1 unit in BMI z-score between the starting point of the AR (BMI nadir) and the last point.
Type B-EAR was defined according to one situation: If the BMI nadir is below the median (BMI z-score < 0), a type B-EAR is defined when there is an increase greater than 0·5 but lower than 1 unit in BMI z-score between the starting point of the AR (BMI nadir) and the last point (see Fig. 2).
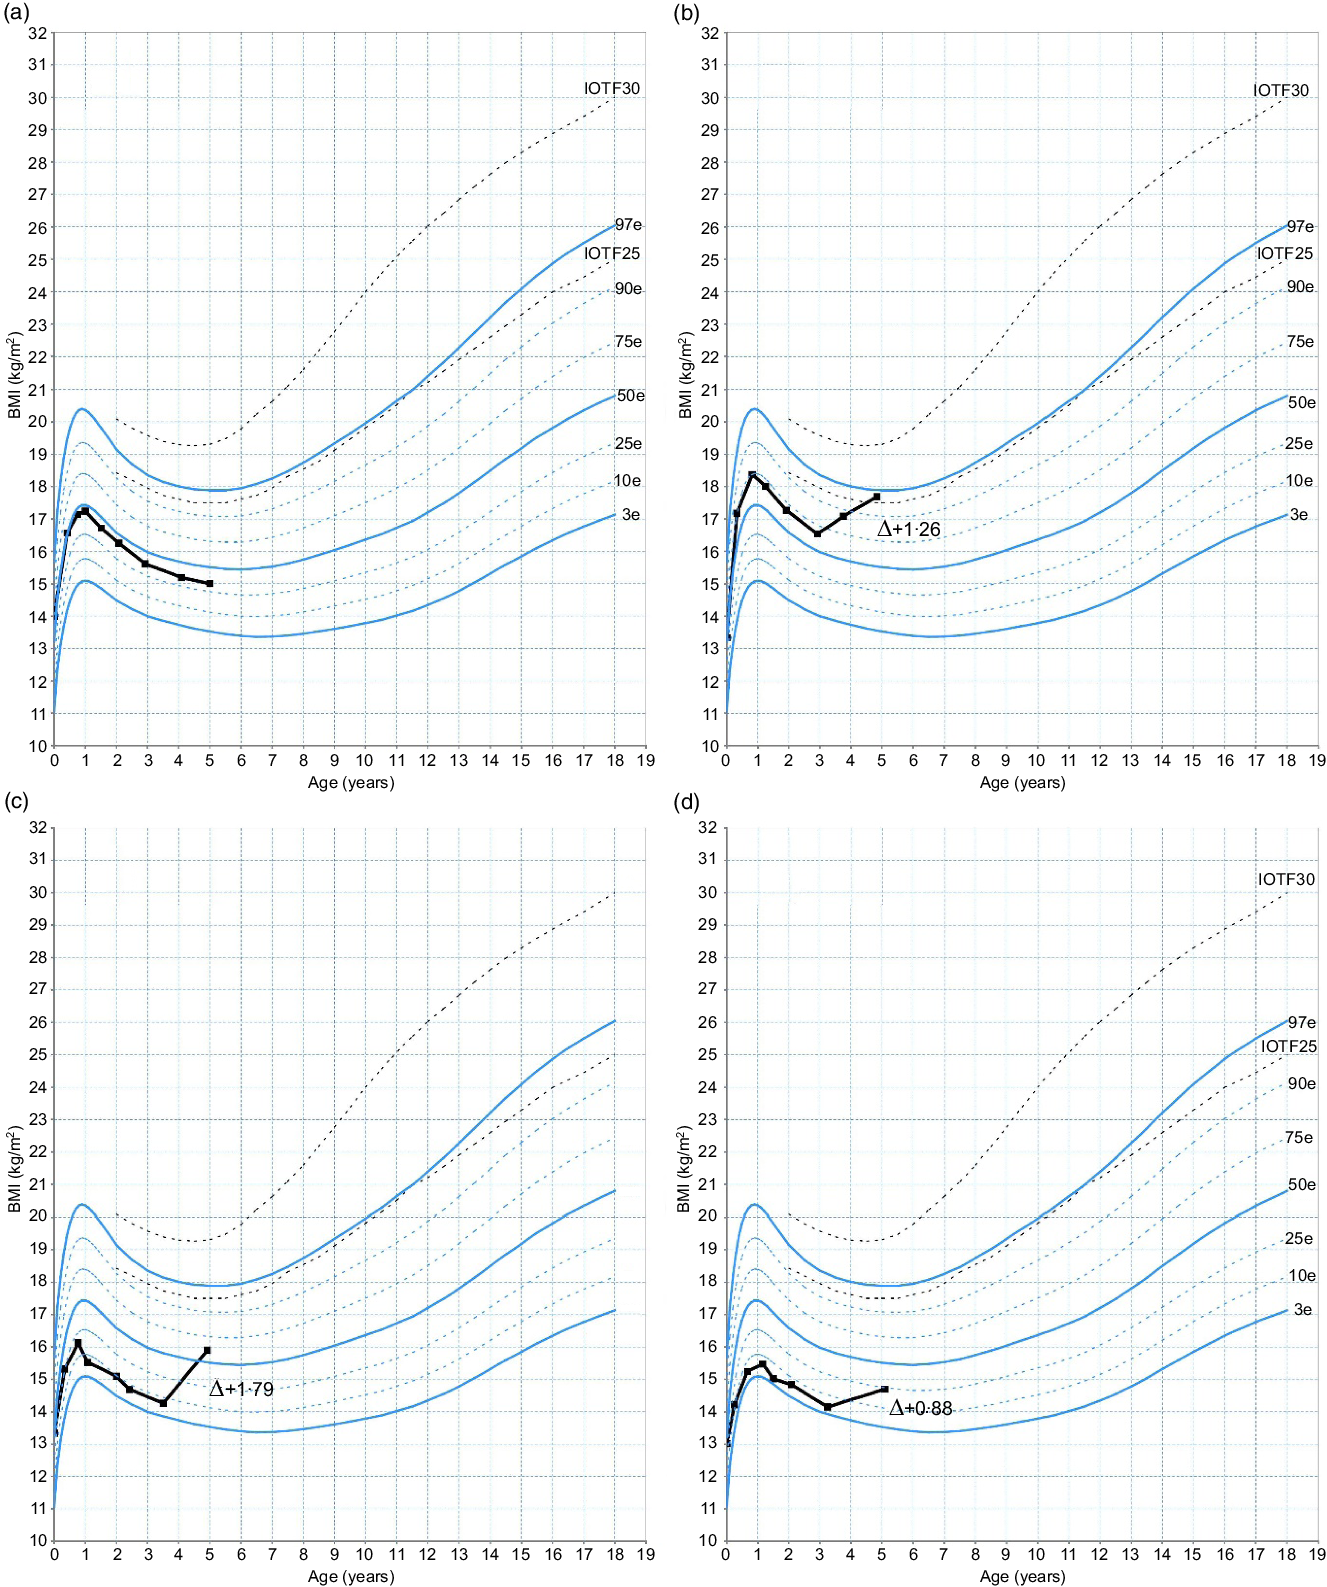
Fig. 2. Examples of non-early adiposity rebound (EAR) and EAR types presented on a French curve, according to the starting point of the EAR and the BMI trajectory. (a) No EAR; (b and c) type A-EAR; (d) type B-EAR. Δ, Difference in BMI z-score between last measure and starting point of the EAR; IOTF, International Obesity Task Force.
Subjects were thus classified as non-EAR group or EAR group. Within the EAR group, two subgroups were distinguished, namely type A-EAR group and type B-EAR group.
Determination of the catch-up growth
Catch-up growth (CUG) was defined at 2 years when a difference of >0·67 standard deviations was observed between the 24-month BMI z-score and the birth-BMI z-score (Reference Reilly, Armstrong and Dorosty11).
Statistical analysis
All statistical analyses were performed with SAS software, version 9.4 (SAS Institute, Inc.). Discrete variables are expressed as numbers and percentages, and continuous variables as mean values and standard deviations unless otherwise stated. Comparisons between non-EAR and EAR groups and between non-EAR, type A-EAR and type B-EAR groups were performed using the χ 2 or Fisherʼs exact test, Studentʼs t test or ANOVA according to the type of variable. Post hoc tests were performed as appropriate (Scheffeʼs test).
To determine the predictive factors of overweight and obesity in children, we first performed bivariate logistic analysis. Variables with a level of significance of ≤0·20 in the bivariate analysis were included in the multivariate model, which was analysed with stepwise logistic regression. Interaction effects were sought for all variables included in the model. Model discrimination was assessed by the C-index, which is equal to the AUC. Calibration was assessed by the Hosmer–Lemeshow goodness-of-fit statistic. All reported P values are two-sided. A P value < 0·05 was considered statistically significant.
Results
Characteristics of the population
In total, 1159 children were enrolled in the study; of these, 104 subjects were excluded from further analysis because of missing data or uninterpretable BMI trajectories. A total of 1055 children (509 girls and 546 boys) with a mean age of 4·4 (sd 0·4) years and a mean BMI of 15·7 (sd 1·5) kg/m2 were thus retained for analysis. At wave 2, a total of 921 subjects were seen. Fifty-four subjects were excluded, and 867 subjects (422 girls and 445 boys) were retained for final analysis, at a mean age of 7·5 (sd 0·4) years and a mean BMI of 16·5 (sd 2·3) kg/m2.
Among the 1055 interpreted BMI trajectories, agreement between the two investigators for EAR determination was found for 960 (91 %) children. A third observer was called on to resolve discrepancies for ninety-five subjects.
EAR, determined during the first wave, was observed in 426 children (40·4 % of the population; 225 girls, 201 boys) who constitute the EAR group, while 629 subjects (284 girls and 345 boys) did not exhibit an EAR (non-EAR group, Table 1).
Table 1. Characteristics of the non-early adiposity rebound (EAR) and EAR groups according to the International Obesity Task Force (IOTF) definition
(Mean values and standard deviations; numbers and percentages)

* Student’s t test for quantitative variables for comparison between non-EAR and EAR groups.
† χ 2 Test for qualitative data analysis, for comparison between non-EAR and EAR groups.
‡ Fisher’s exact test for qualitative data analysis, for comparison between non-EAR and EAR groups.
Among the EAR group, 172 children (40·4 %; 93 girls, 79 boys) were identified as presenting type A-EAR and 254 subjects (59·6 %; 132 girls, 122 boys) exhibited type B-EAR (Table 2).
Table 2. Characteristics of the non-early adiposity rebound (EAR), type A and type B-EAR groups according to the International Obesity Task Force (IOTF) definition
(Mean values and standard deviations; numbers and percentages)

* P < 0·05, ** P < 0·01, *** P < 0·001.
† ANOVA for quantitative data analysis and ‡ χ 2 test or § Fisherʼs exact test for qualitative data analysis for comparison between non-EAR, type A-EAR and type B-EAR groups. Post hoc (Scheffeʼs test) for comparison between groups.
Non-early adiposity rebound and early adiposity rebound groups
Antenatal and postnatal information
Gestational age, size at birth including height, body weight and body weight status at birth were not different between the two groups. Motherʼs smoking status during pregnancy, BMI of the parents, prevalence of pregnancy-induced hypertension, breast-feeding and gestational diabetes were also similar between groups (Table 1).
Characteristics at age 3–5 years
Children from the EAR group presented higher BMI (P < 0·0001) than children from the non-EAR group. A similar prevalence of CUG was observed in the two groups. In the EAR group, only two children were thin (0·5 %), v. 35 (5·6 %) in non-EAR children. Among those with EAR, 57 (13·4 %) children were already overweight and 22 (5·2 %) were obese. Regarding the non-EAR group, 27 (4·3 %) children were overweight with a BMI trajectory at the top of the chart since early infancy, but none was obese (Table 1). Data according to the WHO references are shown in online Supplementary Table S1.
Characteristics at age 6–8 years
Children from the EAR group presented higher BMI (P < 0·0001) than those from the non-EAR group. In the EAR group, no child was thin, while 5 (1·0 %) children from the non-EAR group were thin. In the EAR group, 77 (21·7 %) children were overweight and 35 (9·9 %) were obese. Among the non-EAR group, only 41 (8·0 %) children were overweight and 4 (0·8 %) were obese (Table 1). Data according to the WHO references are shown in online Supplementary Table S1.
Non-, type A- and type B-early adiposity rebound groups
Antenatal and postnatal information
Subjects with type A-EAR had a greater gestational age compared with children from the non-EAR group (P < 0·001) and compared with those from the type B-EAR group (P < 0·001).
At birth, height was greater in the type A-EAR group compared with the type B-EAR group (P < 0·001) and to the non-EAR group (P < 0·001). Birth weight was significantly higher in the type A-EAR group compared with the type B-EAR and non-EAR groups (P < 0·001, Table 2).
Characteristics at age 3–5 years
Age was similar between the three groups. BMI was significantly greater in the type A-EAR group compared with the type B-EAR and the non-EAR groups (P < 0·0001, Table 2).
Rates of CUG were 49 and 40·9 % in the type A-EAR and non-EAR groups, respectively, v. 28·5 % in the type B-EAR group (P < 0·0001).
Concerning body weight status, in the type A-EAR group, 57 (33·1 %) children presented overweight and 22 (12·8 %) presented obesity and no child presented thinness. In the type B-EAR group, 2 (0·8 %) children presented thinness and no child presented overweight or obesity (Table 2). Data according to the WHO references are shown in online Supplementary Table S2.
Characteristics at age 6–8 years
Age was similar between the three groups. BMI was higher in the type A-EAR group compared with the type B-EAR and non-EAR groups (P < 0·0001, Table 2).
Concerning body weight status, in the type A-EAR group, 56 (40·0 %) children were overweight and 33 (23·6 %) children presented obesity. In the type B-EAR group, 21 (9·8 %) children were overweight and 2 (0·9 %) children presented obesity. In both groups, no child presented thinness (Table 2). Data according to the WHO references are shown in online Supplementary Table S2.
When combining the type A and type B-EAR groups, 112 children were overweight/obese. 79·5 % of them (n 89) were from the type A-EAR group and 20·5 % (n 23) from the type B-EAR group.
Risk factors for overweight and obesity at age 6–8 years
Bivariate analysis
Gestational age, body weight status at birth (eutrophy, macrosomia and hypotrophy), gestational diabetes and pregnancy-induced hypertension were not associated with overweight/obesity at age 6–8 years.
Risk factors for overweight/obesity at age 6–8 years by bivariate analysis were exposure to prenatal smoking (OR 1·98; 95 % CI 1·22, 3·21), maternal obesity (OR 3·00; 95 % CI 1·82, 4·95), paternal overweight (OR 1·80; 95 % CI 1·20, 2·71), paternal obesity (OR 3·51; 95 % CI 1·99, 6·19) and CUG (OR 2·40; 95 % CI 1·65, 3·50). Risk of overweight/obesity was decreased by breast-feeding (duration of at least 6 months), compared with infants receiving infant formula (OR 0·42; 95 % CI 0·21, 0·84).
Concerning EAR, children in the EAR group had an increased risk of overweight/obesity at age 6–8 years (OR 4·81; 95 % CI 3·29, 7·03) compared with those in the non-EAR group. In subgroup analyses, compared with those in the non-EAR group, children in the type A-EAR group had an increased risk of overweight/obesity at age 6–8 years (OR 18·15; 95 % CI 11·45, 28·76), whereas those in the type B-EAR group did not have a significantly increased risk (OR 1·25; 95 % CI 0·74, 2·13) of overweight/obesity at age 6–8 years (Table 3).
Table 3. Association between risk factors and overweight and obesity at age 6–8 years*†
(Odds ratios and 95 % confidence intervals)

* C-index = 0·846, Hosmer–Lemeshow = 0·7109.
† The candidate variables for the multivariate model were those with a level of significance of ≤0·20 in the bivariate analysis.
Results of the bivariate analyses according to the WHO definitions are presented in online Supplementary Table S3.
Stepwise multivariate analysis
Risk factors for overweight/obesity at age 6–8 years by stepwise multivariate logistic regression analysis were motherʼs smoking status during pregnancy (OR 2·31; 95 % CI 1·15, 4·65), maternal obesity (OR 2·84; 95 % CI 1·33, 6·06), paternal overweight (OR 2·29; 95 % CI 1·12, 4·28), paternal obesity (OR 2·81; 95 % CI 1·12, 7·06) and CUG (OR 2·18; 95 % CI 1·23, 3·88) and type A-EAR (OR 21·35; 95 % CI 10·94, 41·66). The C-index for the model was 0·846 (Table 3). According to the WHO definitions, the risk factors for overweight/obesity at age 6–8 years by stepwise multivariate logistic regression analysis were macrosomia (OR 5·68; 95 % CI 2·33, 13·86), motherʼs smoking status during pregnancy (OR 2·73; 95 % CI 1·46, 5·12), maternal obesity (OR 2·59; 95 % CI 1·28, 5·24), paternal overweight (OR 2·14; 95 % CI 1·26, 3·63), type A-EAR (OR 13·96; 95 % CI 7·45, 26·18) and type B-EAR (OR 3·39; 95 % CI 1·94, 5·92). The C-index for the model was 0·831 (online Supplementary Table S3).
Discussion
The prevalence of paediatric overweight and obesity remains alarming worldwide(Reference Han, Lawlor and Kimm15), accompanied by early metabolic(Reference Gueugnon, Mougin and Simon-Rigaud24), sleep(Reference Roche, Gillet and Perret25,Reference Roche, Isacco and Perret26) and functional(Reference Chaplais, Thivel and Greene27) impairments, amongst others, calling for effective preventive and treatment strategies.
In the present study, 40·4 % of the children were classified as having an EAR. This prevalence is in line with other studies, such as Hughes et al. (Reference Hughes, Sherriff and Ness17), who reported that 27·2 % of British children experienced EAR, and Ip et al. (Reference Ip, Marshall and Saldana12), who found a prevalence of about 58·3 % in Latino children.
Although the occurrence of EAR is recognised as a predictive marker for future paediatric overweight and obesity, there is a need to reinforce our screening methods and to identify accurate and reliable predictors. In the present study, only 26·3 % of children identified as having an EAR actually became overweight/obese at age 6–8 years. This low prevalence highlights the need to refine the definition of EAR, in order to detect only children at high risk of later overweight/obesity.
Based on our clinical expertise, the present work proposes a sub-classification of EAR, considering not only early occurrence of EAR but mainly its velocity and the shape of its trajectory. Indeed, it seems important to differentiate between children whose BMI z-score is equal to or below 0 at the occurrence of the EAR and who show an alarming increase in their growth curve (type A); and those who have a lower BMI z-score with a low-to-moderate increase in their curve (type B). In this context, we aimed to compare the clinical characteristics at birth, age 3–5 and 6–8 years of children, according to the presence or absence of EAR, and according to the type of EAR (type A and type B-EAR), and to assess the childrenʼs odds of being classified as overweight/obesity at age 6–8 years, according to the type of EAR defined at age 3–5 years.
Regarding the clinical characteristics at birth, children with type B-EAR exhibited slightly lower height and body weight compared with children from the type A-EAR group and children from the non-EAR group, despite similar gestational age and maternal smoking status during pregnancy. Although these children could not be considered as small for gestational age, we could nonetheless expect to observe a substantial prevalence of CUG in this group, since 70–90 % of small for gestational age children usually experience this catch-up(Reference Karlberg and Albertsson-Wikland28–Reference Argente, Mehls and Barrios30). Surprisingly, only 28·5 % of children with type B-EAR experienced CUG, compared with almost half of the type A-EAR group. This is of particular importance since CUG is recognised as a risk factor for overweight/obesity in childhood, as previously reported(Reference Toschke, Grote and Koletzko31,Reference Eriksson32) . Regarding the antenatal and postnatal factors, we found that the prevalence of both maternal and paternal obesity was greater in children with type A-EAR compared with the other children, which confirms the strong relation between parental obesity, EAR and risk of later overweight/obesity of the offspring.
When assessing the childrenʼs risk factors of being classified with overweight/obesity at age 6–8 years, some of the previously reported early-life risk factors for obesity during childhood, such as gestational age, body weight status at birth, gestational diabetes and pregnancy-induced hypertension, were not found to be associated with weight gain in later childhood. Moreover, multivariate logistic regression analysis did not allow us to observe a protective effect of breast-feeding. However, we did not assess whether breast-feeding was exclusive or not, which can explain why we did not observe a protective effect of breast-feeding against overweight/obesity. While previous studies questioned the potential relationships between these factors and the development of paediatric obesity, results remain conflicting and further evidence is needed(Reference Giles, Whitrow and Davies33–Reference Wang, Gao and Wu36).
As expected(Reference Reilly, Armstrong and Dorosty11,Reference Weng, Redsell and Swift37) , parental body weight status represents a strong risk factor for paediatric overweight/obesity and children born to obese mothers or fathers, respectively, have a 2·84- or 2·81-fold increase in the risk of exhibiting overweight/obesity at the age of 6–8 years. Parental obesity may enhance the risk of obesity not only through genes involved in homoeostatic regulation, appetite suppression and the control of energy balance(Reference Lenard and Berthoud38) but also through shared familial characteristics such as food preferences(Reference Francis, Lee and Birch39) or physical inactivity(Reference Parsons, Power and Logan40).
We found that exposure to prenatal smoking was associated with an increased risk of overweight/obesity in children (adjusted OR 2·31; 95 % CI 1·15, 4·65). Other authors have reported that infants whose mothers smoked during pregnancy had not only a preserved ponderal index(Reference Miller, Hassanein and Hensleigh41) but also more fat mass and less fat-free mass than infants of non-smokers(Reference Cliver, Goldenberg and Cutter42,Reference Harvey, Poole and Javaid43) . Maternal smoking may also result in lower fetal growth which, in turn, is counterbalanced by faster postnatal weight gain(Reference Oken, Levitan and Gillman44). This quicker postnatal weight gain is associated with the development of overweight(Reference Oken and Gillman45) and, in accordance with the literature(Reference Reilly, Armstrong and Dorosty11,Reference Weng, Redsell and Swift37) , we found that CUG represents a risk factor for overweight/obesity at age 6–8 years.
Finally, we observed that children in the EAR group had a 4·8-fold increase in the risk of overweight/obesity at age 6–8 years compared with those in the non-EAR group. AR, which is the point at which the BMI increases after its nadir(Reference Rolland-Cachera, Deheeger and Maillot2,Reference Dietz3) , is considered ‘early’ in the French paediatric population when it occurs before the age of 5·5 years(Reference Rolland-Cachera, Deheeger and Maillot2,Reference Rolland-Cachera, Deheeger and Bellisle4) . Since its first definition in 1984 by Rolland-Cachera et al. (Reference Rolland-Cachera, Deheeger and Bellisle4), numerous studies have confirmed its strong relationship with later overweight/obesity(Reference Rolland-Cachera, Deheeger and Maillot2,Reference Rolland-Cachera, Deheeger and Bellisle4–Reference Whitaker, Pepe and Wright6) , as well as with cardiometabolic health(Reference González, Corvalán and Pereira46). Over the last decade, some authors(Reference Dietz47,Reference Cole48) have suggested that EAR was a risk factor for later fatness only because it identifies children whose BMI was already high at the occurrence of the rebound, without considering the shape and trajectories of the curve. However, as emphasised by Rolland-Cachera & Péneau(Reference Rolland-Cachera and Péneau49) and by Rolland-Cachera & Cole(Reference Rolland-Cachera and Cole50), BMI at the age of the AR is usually close to the 50th centile of the reference population (corresponding to a BMI z-score close to 0), showing that an EAR is not necessarily associated with high BMI values at rebound. Although its reliability to precisely determine later overweight and obesity remains to be confirmed, EAR is a major tool for physicians to target children at risk.
As such, by differentiating type A from type B-EAR according to the nadir of BMI and the trajectory of the childrenʼs BMI curves, we found that children found to have type A-EAR show a 21-fold increase in the risk of overweight and obesity at age 6–8 years compared with children from the non-EAR group, after adjusting for motherʼs smoking status during pregnancy, for CUG and for the body weight of the mother and father. In children defined with type B-EAR, the risk for overweight and obesity was not increased, compared with children from the non-EAR group. Additionally, overweight and obesity were diagnosed at age 6–8 years among 51·7 % children with type A-EAR, while only 9·1 % were found to be overweight/obese in the type B-EAR group.
In this way, among the 426 children initially identified with EAR, only 40·4 % of them (i.e. those who were classified as type A-EAR) were considered as being at high risk for future overweight/obesity. This supports the utility of this classification, which is more sensitive for the identification of children at risk of overweight and obesity, and provides physicians with an easier way to efficiently screen for and manage paediatric obesity. As a reminder, we observed 91 % agreement between the two investigators for EAR determination.
Importantly, it must be emphasised that while children presenting a type B-EAR did not exhibit a risk for overweight/obesity compared with children from the non-EAR group, we cannot ensure that they are metabolically healthier than children with type A-EAR. Rolland-Cachera & Péneau(Reference Rolland-Cachera and Péneau49) reported that the two main BMI trajectories, respectively, ‘lean’ and ‘fat’ children experiencing EAR may be associated with different health risks. Indeed, overweight children with high birth weight followed by high lean body mass may have lower health risks(Reference Rolland-Cachera and Péneau49,Reference Singhal, Wells and Cole51) , while rapid weight gain after AR in thin infants is associated with insulin resistance and CHD(Reference Rolland-Cachera and Péneau49,Reference Eriksson, Forsén and Tuomilehto52) .
This study has some limitations that deserve to be considered when interpreting our results. First, antenatal and postnatal factors were collected following interviews with at least one parent, which might limit the accuracy of the information collected (e.g. gestational diabetes, pregnancy-induced hypertension, BMI of the parents, etc.). Additionally, breast-feeding and smoking status during the pregnancy were also self-reported by the parents. Regarding breast-feeding, we cannot ensure that it was exclusive and this lack of information may explain why breast-feeding did not appear to be protective against overweight and obesity in multivariate analysis.
Second, assessment of fat mass and fat-free mass would have been relevant in order to refine the AR assessment(Reference Plachta-Danielzik, Bosy-Westphal and Kehden53), which was not possible due to the design of the study.
Third, we evaluated EAR at the age 3–5 years instead of at the exact age of 5·5 years. This study was run in the context of preventive medicine, in early childhood, at the time of pre-school, and data were collected as part of the annual medical examination performed in pre-school children. Consequently, we were unable to perform data collection at the exact age of 5·5 years. However, the 3–5 year age group is of particular interest, since evidence shows that the earlier the EAR, the more severe the obesity (Reference Ip, Marshall and Saldana12,Reference Rolland-Cachera, Deheeger and Guilloud-Bataille54) .
Finally, it would be relevant, in further studies, to transpose the present method to BMI curves by using percentiles to define type A and type B-EAR, in order to make it accessible to a wider public.
In the current context of high prevalence of paediatric obesity worldwide, effective strategies for early diagnosis of overweight/obesity are needed. Based on our clinical expertise, we propose a classification of EAR, using IOTF charts, including both the starting point of the EAR and the BMI trajectory, differentiating between children whose BMI z-score is ≥ 0 at the occurrence of the EAR and/or who show an alarming increase in their growth curve (type A-EAR), and children who have a lower initial BMI and who exhibit a low-to-moderate increase in their curve (type B-EAR). Following this approach, we were able to target almost 80 % of the children initially identified with EAR at 3–5 years, who became overweight/obese at 6–8 years. Differentiating type A from type B-EAR might represent a universal, easy and sensitive way for physicians to identify and improve the early screening of children at high risk of obesity.
Acknowledgements
The authors would like to thank Fiona Ecarnot, PhD for editorial assistance and Dr Karine Scheuermaier and Nicolas Coutarel for scientific output. The authors are grateful to Dr Laurence Guillaume and her staff of the school health service and to Dr Dominique Arnoud and the staff of the service of protection of mothers and infants for technical assistance. The authors would like to address particular thanks to the study participants and their parents.
This study was funded by the regional council of the Franche-Comté region (Conseil Régional de Franche-Comté) via intramural funding in the hospital (APICHU research grant).
J. R. and S. Q. wrote the paper with support from D. T. and V. N. M. P., S. Q., V. N., D. T. and J. R. designed the work and the analysis. M. R., F. M., S. Q. and S. G. collected the data. S. G., A.-M. B., S. P., S. Q. and V. N. contributed data or analysis tools. M. P. and F. Mauny performed the analysis. F. Mougin, D. T. and V. N. provided critical revision of the article and V. N. supervised the project. All authors provided final approval of the version to be published.
All authors have read and approved the manuscript. No author has any conflicts of interest to declare.
Supplementary material
For supplementary material referred to in this article, please visit https://doi.org/10.1017/S0007114520000987


