


Introduction
As an indicator of glacier wear processes this investigation compares relief, size, and shape of particles from supra-, en-, and subglacial locations of cold and of temperate ice.
The size range of rock fragments in glacial environments is large and is generally a function of rock type, and it varies considerably over short distances. When comparing distributions of size and shape, a limited class range must be chosen. Quartz silt particles were sampled on three glaciers, and boulders on one glacier.
Technique
The projected width and length of each particle were measured; the ratio of these is known as “elongation”, a measure of equidimensionality. The Cailleux index of roundness was used on part of each sample. This index is the ratio of the diameter of the smallest inscribed circle to the particle length. For small irregular particles the error is large in measurement of the circle diameter fitting the sharpest “corner” of the particle profile, so the ratio of the inscribed and circumscribed circles (Reference FolkFolk 1974), known as the Riley index of roundness, was measured for 100 particles in each sample.
Accuracy of field measurement of boulders was rarely better than± 10 mm (say 5%) and ± 1 mm for cobbles and pebbles (about 5%). Photographs of sand and silt, projected onto a screen, were readily obtained with a magnification of 300. Thus, an actual length of ± 3 μm was magnified to ± 1 mm, (again, about 5%).
Sites
Rock fragments were measured from the margin of an ice cap, from a temperate and from a cold valley glacier, and from the wear products of a laboratory experiment on sliding of sandstone on sandstone and sandstone on ice
Site 1
At Roslin Gletscher in Stauning Alper, east Greenland (71° 40' N, 24° 30' W), samples of apparently typical rock debris were taken from five locations. Numerous small supraglacial streams flowed into a near-central river on the glacier surface. For 5 km this river flowed in a meandering gorge 50 m deep and 30 m wide at the glacier surface. The river channel narrowed to 2 m wide at the bottom, with short terraces and occasional falls. At the sampling point, water depth ranged from 0.2 m at 02.00 h local mean time, to 0.5 m at 15.00 h. A 0.5 l depth-integrated sample was collected every hour. The sample was filtered through 0.5 μm acetate paper, a bicycle pump speeding the process. Stream discharge and sediment load are summed in Table I
Table I Glacial stream discharge and sediment load at roslin gletscher

Three englacial dirt bands within 1 km of the glacier snout were sampled, at 1 m intervals, by chipping ice debris, melting, and filtering. There were a few small pebbles but most of the filtrate was silt, sized as “Roslin englacial”.
The glacier, other than at the surface, was of cold ice, so it was not surprising to see an ice floor to the subglacial river, though covered by boulders. The glacier sole, a 1 to 2 m-thick dirt band merged with this river bed where it rose in short terraces. This band was also sampled; the volumetric rock content ranged from 8 to 28% with a mean of 19%. For size and shape measurement, the dirt-band samples were combined.
The exit of the river from a 30 m-high cave was in a channel, which was 8 m wide and 1.2 rn deep in the afternoon, but fell to 6 m wide and 0.8 m deep in the early morning (Fig. 2a). The glacier flanked one side of the river for nearly 1 km. The river was contained on the other side by long ice ridges, 10 to 20 m high and wide, extending for 0.5 km to a broad glacier snout of a recent surge. At the cave entrance 0.5 l, water samples were taken in midstream as in the supraglacial river; the sized silt particles are referred to as “Roslin subglacial”.

Fig.2 Ice-worn particles. The number with each identifying letter gives photograph width in μm except for K and L which are both 1.5 m. A - F: Roslin subglacial; G: cleaned rock surface for experiment on ice sliding; H and I; Roslin dirt band; J; particles embedded in ice after sliding; K: Roslin subglacial moraine; L: Roslin subglacial moraine overlain by ablation moraine.
Figures 1 shows the change in river level during 24 h and the very erratic change in silt load (Reference CollinsCollins 1979). Table I summarizes the discharge and silt load which, if averaged over the 100 days of summer melt, suggests a denudation rate of 0.4 mm a-1 from the whole of 43 km2 catchment, half of which was ice covered. Approximately 30% of the pro-glacial deposits were silt so, if bed-load transport is included! the denudation rate is approximately 1.2 mm a-1

Fig.1 Change of water level (shown as solid curve) and silt load through 24 h at Roslin subglacial river.
A pro-glacial melt stream, between some of the ridges of ice-cored moraine at the glacier snout, had a tributary from the lateral moraine at the glacier margin. 0.5 l, samples were taken hourly and filtered. The sized sample is referred to as “moraine” or “proglacial silt”.
Amongst the ice-cored ridges of the moraine at the glacier snout were collapsed basins with steep cliffs of coarse rock debris. Coarse ablation moraine had obviously been added over some of these scree slopes. Photographs, taken normal to the slope, of such “pro-glacial boulders” were used for later laboratory measurements. Slopes of more rounded, subglacially disgorged cobbles and boulders were obvious in some of these ice hollows, some of the cobbles still being partly enclosed by ice. Ablation moraine was very probably present too, but some of these steep scree slopes, apparently more free of ablation moraine, were photographed for measurement of “subglacial boulders”.
Site 2
On Eyjabakkajӧkull, flowing from east Vatnajӧkull, Iceland, surface material was sampled from dirt cones and from a supraglacial stream. Access to true subglacial material was not possible so particles were collected from two streams at the ice margin. A pro-glacial sample was collected from the ice-cored moraine
Site 3
From Findelengletscher at 1 900 m near Zermatt, Switzerland, a steep and crevassed ice rise showed pockets and lenses of sand and silt with a few cobbles and pebbles. These were samp 1ed as “Findelen englacial silt”. From the snout of the glacier a subglacial river was transporting a considerable concentration of silt which was sampled as “Findelen subg.lacial silt”
Site 4
In a rock wear experiment in the laboratory, a button of Carboniferous sandstone with an apparent load of 2 x 10⁵Pa was allowed to slide concentrically at 0.1 m d-1 over a 0.1 m diameter disc of the same rock. Both were ground, lapped, and cleaned (finally in a supersonic vibrator), and thoroughly dried. The wear products from 0.7 m of sliding in this experiment were measured to compare with the glacial silt.
A similarly prepared 10mm disc of rock with apparent load of 2 x 10⁵Pa was arranged to slide at 0.1 m d-1 round a cylinder of clean ice at -3°C. The path round the ice cylinder was in a helix to give a fresh ice surface and preclude any re-tracking over previously deposited wear products; only six rock particles were detached from the sandstone
Particle Relief
Figures 2Ashows a typical array of subglacial particles, angular and subangular with conchoidal fractures and stepped surfaces, typical of quartz grains. The upper surfaces shown have a rippled relief. The Roslin subglacial particle in Figures 2B has distinct asperities, a deep embayment in the front edge, and an upper surface with ridges and semicircular pits. Some of these pits, as in Figures 2C, have an irregularly raised edge with a partial collar of quartz.Figures 2d is a subrounded particle, also from the Roslin subglacial sample, and is similar to Figures 2B with a less sharp outline, except where intersecting conchoidal fracture surfaces have sharpened the surface relief. The nearly planar surface of the subglacial particle in Figures 2Ecould also be a fracture plane, but the enlargement inFigures 2F shows parallel scratches, too regular to be striae, but possibly ribbing on the fracture surface. A circular pit with a raised edge is seen in the mottled surface.
Figures 2H and its enlargement in Figures 2Ishow a dirt-band particle, which is very distinct in outline and has many cracks but none of the deep micro-pits seen in some of the subglacial particles.
Figures 2G shows the thoroughly cleaned surface of the sandstone button from which the particles in Figures 2J were obtained as the result of ice sliding over it in the laboratory. A single facet can be seen on one grain but the fresh surfaces of conchoidal fracture are dominant, with similar forms in the minute fragments. The wear products of rock sliding on rock were very similar
Reference Whalley and LangwayWhalley and Langway (1980), from analysis of particles beneath the Greenland ice sheet at Camp Century, found evidence of attrition at the sharp edges of some particles (seen here in part of Figures 2DandFigures 2H ), some rounded grains, and many with surfaces showi ng a “weathered appearance of silica precipitation” (seen here in Figures 2CandFigure 2F).Reference MayMay (1980) described quartz grains from a depth in excess of 3 m in till at Edmonton, Alberta, with marked embayment (here as in Figures 2B) where silica had apparently been removed by water of high pH produced by the evaporation of pore water and resultant concentration of dissolved solids. The presence of soda feldspars would also raise the pH. In the process of refreezing of pressure melt water, dissolution of silica can be expected at points of high loading. Similarly, concentrations of dissolved solids can be expected in pockets of fracture surfaces, which are also areas of high surface energy. Silica migration is less evident on the englacial particles.
Figure 2K shows sub-rounded cobbles and boulders of some of the Roslin subglacial moraine, which is overlain by angular ablation moraine in Figure 2L.
Particle Size
When the four silt samples from Roslin Gletscher are classed as angular, sub-angular, sub-round, and round, there is a decreasing number in each class. In the dirt-band and subglacial samples, the particles are increasingly equidimensional with decrease in size. The glacier-surface and moraine-stream samples have the largest particles in the subangular class and the elongation index change is less regular.
The frequency of the size of Roslin Gletscher silt, from 10 to 125 μm length, is shown in Figure 3. All are positively skewed though this decreases from high skewness for the supraglacial and dirt-band samples to a low skewness for the moraine sample. Kurtosis follows the same pattern, and both these statistics were corroborated by distribution curves of particle width. The striking feature in Figure 3 is the bimodal distribution, dominant in the supra- and pro-glacial silt, rather hidden in the dirt-band sample and becoming trimodal in the subglacial and moraine samples. Dotted lines have been added to suggest a simple interpretation of the frequency curves. Separation of the peaks measured on the length axis gives a ratio between 0.6 and 0.7 which, though surely a coincidence, is also the mean elongation index.
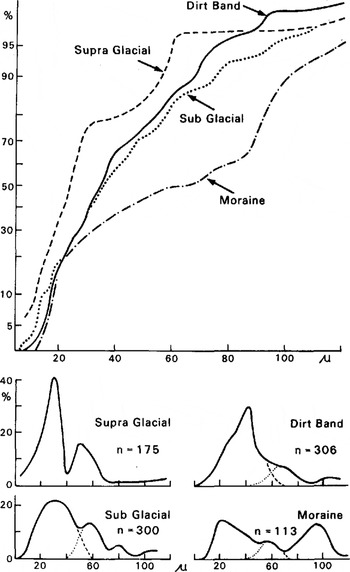
Fig.3 Frequency of silt sizes (length in μm) at four locations on Roslin Gletscher.
The wear products of the laboratory-ground sandstone have a frequency distribution that is very close to that of the supraglacial silt from Roslin Gletscher (Fig.3).Reference Dreimanis, Vagners and GoldthwaitDreimanis and Vagners (1971) found two peaks for crushed quartz: a rock-fragment peak at 6 mm and a mineral-grain peak at 20 μm (described as “terminal grade”). The sandstone used there is very homogeneous with quartz grains of 300 μm set in a silica cement, giving a total quartz content of 97%. All these constituents are much fragmented in the shearing of rock sliding on rock so that the peaks in the frequency curve at 20 and 60 μm bear no simple relation to the size of the initial materials, though a 20 μm “terminal grade” (?) occurs often.
The multimodal form of the frequency curves in Figure 4 of the boulders pnd cobbles of moraine from Roslin Gletscher is more accentuated than that of the moraine silt in Figure 3 but is similar to the form of the subglacial- silt curve in Figure 4 It is quite surprising that the frequency curves of glacial silt and of boulders should have this same form.

Fig.4 .Frequency of sizes (length) of Roslin glacial boulders, of Findelen silt and of sandstone fragments from laboratory experiment
The frequency curve of the pro-glacial moraine scree, comprising ablation moraine superimposed on subglacial moraine (the upper right curve in Figure 4), peaks at higher length values than the curve of the moraine scree that was seen to be more predominantly subglacial moraine (Figs.2K and Figs.2L).
Reduction of the particles would seem to be less by attrition than by fracturing into pieces. with approximately the same dimension ratio as the parent particle. Similar results by workers on crushing and its relation to glacial tills (e.g.Reference Boulton and GoldthwaitBoulton 1971) are summarized by Reference Sugden and JohnSugden and John (1976) as particle-size “curves for most tills are bimodal or even multimodal, suggesting that there is some inherent asymmetry in the process of rock breakdown during glacier transport“ and, further, in the size curves, the final product of glacial comminution can indicate a terminal grade as long as mechanical breakdown is dominant (Reference Dreimanis, Vagners and GoldthwaitDreimanis and Vagners 1971). In Figure 3 the dominant peaks range from 20 to 40 μm through the different glacier zones
Particle Elongation
The electron-scanning micrographs of Figure 2 show a typical range of particles. Some tiny fragments can be expected from the shearing of the quartz grains and, indeed, some were seen under the microscope. looking like shards of glass. The large number of these more irregular particles causes the steep rise from 5 to 20% in the distribution curves of elongation in Figure 5. The curve for the moraine is too close to the others to be shown.

Fig.5 Frequency of index of elongation of particles on Roslin Gletscher
The curves are very similar and have small negative skewness so are not normal. Therefore, the Kolmogorov-Smirnov test statistic for two samples of different size (Reference GibbonsGibbons 1976) has been applied to each pair. The only significant difference between the elongation curves of the four populations is at the probability level of 0.80 between the subglacial and the supraglacial silts. The peak in the supraglacial curve is at the elongation value of 0.70 but there are lesser peaks at 0.58 and 0.82. The dirt band peaks at 0.48, with a major peak at 0.72 and a lesser peak at 0.82. The subglacial curve has a major peak at 0.56 with lesser peaks at 0.68 and 0.95, and there are others. Since the rock is quartz, it is possible that these modes in the elongation curves are reflecting the abrasion process, with different combinations of crushing, rolling, and sliding.
The mean index of elongation for all particles shown is 0.66 ± 0.17. Such a particle is 2 units wide and 3 units long and, when halved, has an elongation index of 0.75 but, when halved again, reverts to 0.66. Any common shape, when 'halved' successively, gives a simple progression in the elongation index; the peak elongation values support this.
Particle Roundness
The particles are predominantly angular so the Cailleux index of roundness was found for a small sample (30 particles) from each population. The subglacial particles were most angular (0.154 ± 0.095) and the moraine particles the most round (0.264 ± 0.171). a difference significant at the 0.05 level. Dirt-band particles were significantly more rounded (0.241 ± 0.103) than the subglacial particles, which result was found also by Reference ReheisReheis (1975).
Silt from the five locations described on Eyjabakkajӧkull. east Iceland was of varied rock types. However, the order of increasing sphericity was the same as that for increasing roundness: dirt cone, surface stream, moraine, stream at edge of glacier. The greater angularity of the supraglacial silt compared with that of the moraine is thus the same as thatfound in east Greenland.
Values of the roundness index are shown in Figure 6 as frequency curves for each sample in Figure 4. The negative skewness is less impressive than the high kurtosis for the silt sizes, reducing from, the laboratory-produced wear products of the sandstone, through the englacial to the subglacial. The area under the curves increases at the higher values of roundness for the subglacial silt and for the subglacial moraine.

Fig.6 Frequency of the index of roundness of Roslin glacial boulders, of Findelen silt and of sandstone fragments from laboratory experiment
The sharp rise in the curves to peak at the roundness index of 0.5 and the steep fall to 0.7 is quite marked. Again considering the typical particle as indicated by the elongation index to be of 2 units width and 3 units length, it will be seen that such a rectangle has a roundness value of 2/√13= 0.55. A square has a roundness value of 1/√2 = 0.71. Removal of the corners will much increase the roundness values, but they persist within this range, which further supports the hypothesis of crushing rather than abrasion of asperities.
The Kolmogorov-Smirnov test was applied for the significance of differences between these roundness curves: the subglacial silt is different from the sandstone fragments and from the ablation moraine, both with probability at the 0.99 level, but it is different from the englacial silt at the 0.90 level and is not significantly different from the subglacial moraine. The sandstone particle roundness is different from that of the englacial silt at the 0.80 level but, surprisingly, is not significantly different from the two samples of moraine scree. The englacial silt roundness is different from the ablation moraine at the 0.80 level but not from the subglacial moraine. There is no significant difference between roundness of the two moraine samples
Using the elongation index for Roslin Gletscher silt showed a similar pattern with no significance in the differences between the samples, other than between the supraglacial and subglacial samples, with probability of 0.80.
Conclusion
The mean elongation index for the glacial particles, angular to rounded, ranges from 0.62 to 0.81; the respective mean roundness index is 0.52 to 0.82. In each specific environment (on the surface, within, under, and in front of the glacier), as the particle size is reduced, the mean form becomes more equidimensional and rounder. From supraglacial to pro-glacial the mean shape is more rounded. At similar locations of very different glaciers, the size and shape of small particles are remarkably similar. Equally remarkable is the similar roundness of subglacial silt and moraine boulders.
Rounding by removing asperities will have little effect on particle size, save its slow reduction. The form of the frequency-curve size (length) would be expected to be very similar through each location in the glacier whereas Figures 3 Figures 4 and show statistically significant different forms for different locations. Values of the elongation index and of the roundness index support the hypothesis of crushing rather than abrasion of asperities
Water transport of particles is well-known as a rounding process and accompanies almost all glacial erosion. Its effect on the samples analysed could not be separated from ice action alone
Acknowledgements
The visit to Findelengletscher was kindly arranged by Dr David Collins of Manchester University, and the visit to Roslin G1etscher by Professor Keith Miller of Sheffield University. John Allen and Neil Irvine co-operated with the silt sampling. Jim Hammett and fellow students collected the samples from Iceland. Norris Riley and Jim Milne generously helped with the computing and, with Bud Frank, made pertinent suggestions. Eric Boult and his assistant Grant Staines kindly produced the electron-scanning microscope photographs. Mrs Olive Teasdale drafted the diagrams and Mrs Sylvia Johnson typed the manuscript. To those named, and many anonymous friends, I am extremely grateful.


