


Introduction
Calorie restriction refers to reducing 10–40% reduction in calorie intake while ensuring that the nutritional level of the food remains the same. Calorie restriction is the most reported dietary intervention with multiple health benefits (Taormina and Mirisola Reference Taormina and Mirisola2014). It prevents cancer, hypertension, diabetes and other age-related diseases for primates (Colman et al. Reference Colman, Anderson and Johnson2009; Mattison et al. Reference Mattison, Roth and Beasley2012). Studies have shown that under the condition of ensuring nutritional supply, calorie restriction prolongs the lifespan of experimental animals and reduces or delays the occurrence of age-related diseases in short-lived organisms such as unicellular organisms and mice (Colman et al. Reference Colman, Beasley and Kemnitz2014). At present, it is generally believed that calorie restriction is an effective nutritional intervention, and it has been proved that calorie restriction can improve body health, prolong life and enhance the ability to cope with stress. The advantage of this nutritional model is that there are no side effects on human health (Aris et al. Reference Aris, Alvers and Ferraiuolo2013; Libert and Guarente Reference Libert and Guarente2013; Rickenbacher et al. Reference Rickenbacher, Jang and Limani2014).
At present, there are many studies on the 30% calorie restriction in animals showing a significant effect on health. For example, the onset of aging-related diseases in rhesus monkeys was delayed and their life expectancy was prolonged after a 30% calorie restriction (Colman et al. Reference Colman, Anderson and Johnson2009), which suggests that calorie restriction can improve the health and survival of rhesus monkeys (Colman et al. Reference Colman, Beasley and Kemnitz2014; Mattison et al. Reference Mattison, Colman and Beasley2017). Similarly, a 30% calorie restriction diet can prolong the lifespan of mouse lemurs by 50% and reduce the incidence of aging-related diseases (Colman and Anderson Reference Colman and Anderson2011).
Previous studies have shown that energy intake is affected by intestinal microbiota (Ley et al. Reference Ley, Backhed and Turnbaugh2005; Turnbaugh et al. Reference Turnbaugh, Ley and Mahowald2006). It has been found that calorie restriction can significantly change the intestinal microbiota in mice (Pan et al. Reference Pan, Zhang and Li2018). As popular dietary intervening patterns, both calorie restriction and intermittent fasting have a great impact on body metabolism. The effect of diet on metabolism depends on gut microbiota (Tremaroli and Backhed Reference Tremaroli and Backhed2012). Current studies have confirmed that food intake, food composition and diet improve metabolism by changing the gut microbiota (Zhang et al. Reference Zhang, Chen and Loh2021). Complex carbohydrates are taken up by intestinal microbiota and fermented into short-chain fatty acids (SCFAs) in the colon (Layden et al. Reference Layden, Angueira and Brodsky2013; Macfarlane and Macfarlane Reference Macfarlane and Macfarlane2003; Nicholson et al. Reference Nicholson, Holmes and Kinross2012). SCFAs are absorbed by the colon and play a role in its health (Hamer et al. Reference Hamer, Jonkers and Venema2008; Koh et al. Reference Koh, De Vadder and Kovatcheva-Datchary2016).
Calorie restriction has great influence on body composition and metabolic function. Studies on rhesus monkeys showed that the body fat of the calorie-restricted rhesus monkeys decreased and their body weight (BW) was significantly lower than that of the control group (Anderson and Weindruch Reference Anderson and Weindruch2007). Calorie restriction can significantly improve metabolic function, especially insulin sensitivity (Gresl et al. Reference Gresl, Colman and Roecker2001; Ramsey et al. Reference Ramsey, Colman and Binkley2000). Studies have found that calorie restriction can significantly improve glucose homeostasis and effectively prevent the occurrence of diabetes (Colman et al. Reference Colman, Anderson and Johnson2009). Of course, feed restriction also has its defects in animal production. The defect of feed restriction lies in the slow growth of animal weight, which is easy to cause animal restlessness. However, many physiological and metabolic studies of human body need animal models, pigs act as an excellent animal model for studying human nutrition and metabolism because they are closely related to humans in terms of genetics, anatomy and physiology (Dawson et al. Reference Dawson, Smith and Chen2017; Meurens et al. Reference Meurens, Summerfield and Nauwynck2012).
We hypothesized that calorie restriction would affect BW, serum indices, gut microbiota, metabolites and SCFAs of pigs as a model for human. The purpose of selecting fattening pigs as experimental animals is that the growth and development of pigs in the fattening stage is nearly complete, and the nutrition intake in the later stage is mainly used to deposit fat. In terms of this characteristic, fattening pigs are just similar to people at the obesity stage, so they can be used as experimental animals to study the effects of calorie restriction on obese people. At present, some articles have studied the effect of starvation or fasting on intestinal microbiota of mini pig or piglets; however, to our knowledge, there are no studies about the effect of specific degrees of calorie restriction on intestinal microbiota and metabolites of finishing pigs (Frias et al. Reference Frias, Valderrama and Durand2023; Ma et al. Reference Ma, Lu and Ji2022). The innovation of this article attributes to investigating the effect of calorie restriction at a degree of 70% of normal feeding on intestinal microbiota, metabolites and the correlation between them.
Materials and methods
Animals and experiment design
A total of 16 castrated male pigs (Landrace × Yorkshire) (86.13 ± 3.50 kg) were randomly assigned into two groups, the control (Con) and calorie restriction (CR) groups (eight pigs/group). All animal procedures were performed fully according to the“Regulation for the Use of Experimental Animals” of Zhejiang Province, China. This study was specifically approved by the Animal Care and Use Committee of Zhejiang University (ETHICS CODE Permit no. ZJU20170529). Pigs were housed individually throughout the experiment. Pigs in the Con group were provided with ad libitum access to basal diet, whereas pigs in the CR group were fed twice a day, at 09:00 and 15:00, with a total of 70% of the amount of feed that consumed by pigs in the Con group. In more detail, daily feed allowance was recalculated every 3 days to take into account the increase in BW and feed intake of the Con group. Therefore, the feed intake of CR group consists of two parts, one is 70% of the average daily feed intake of Con group in the first 3 days, and the other is 70% of the average daily feed intake gain of Con group in the first 3 days.
The basal diets were formulated to meet National Research Council (2012) recommendation (Table 1). The trial lasted for 38 days. All animals were maintained under standard conditions (25 ± 1°C) and were free to access water.
Table 1. Ingredient and chemical composition of the basal diet as fed basis
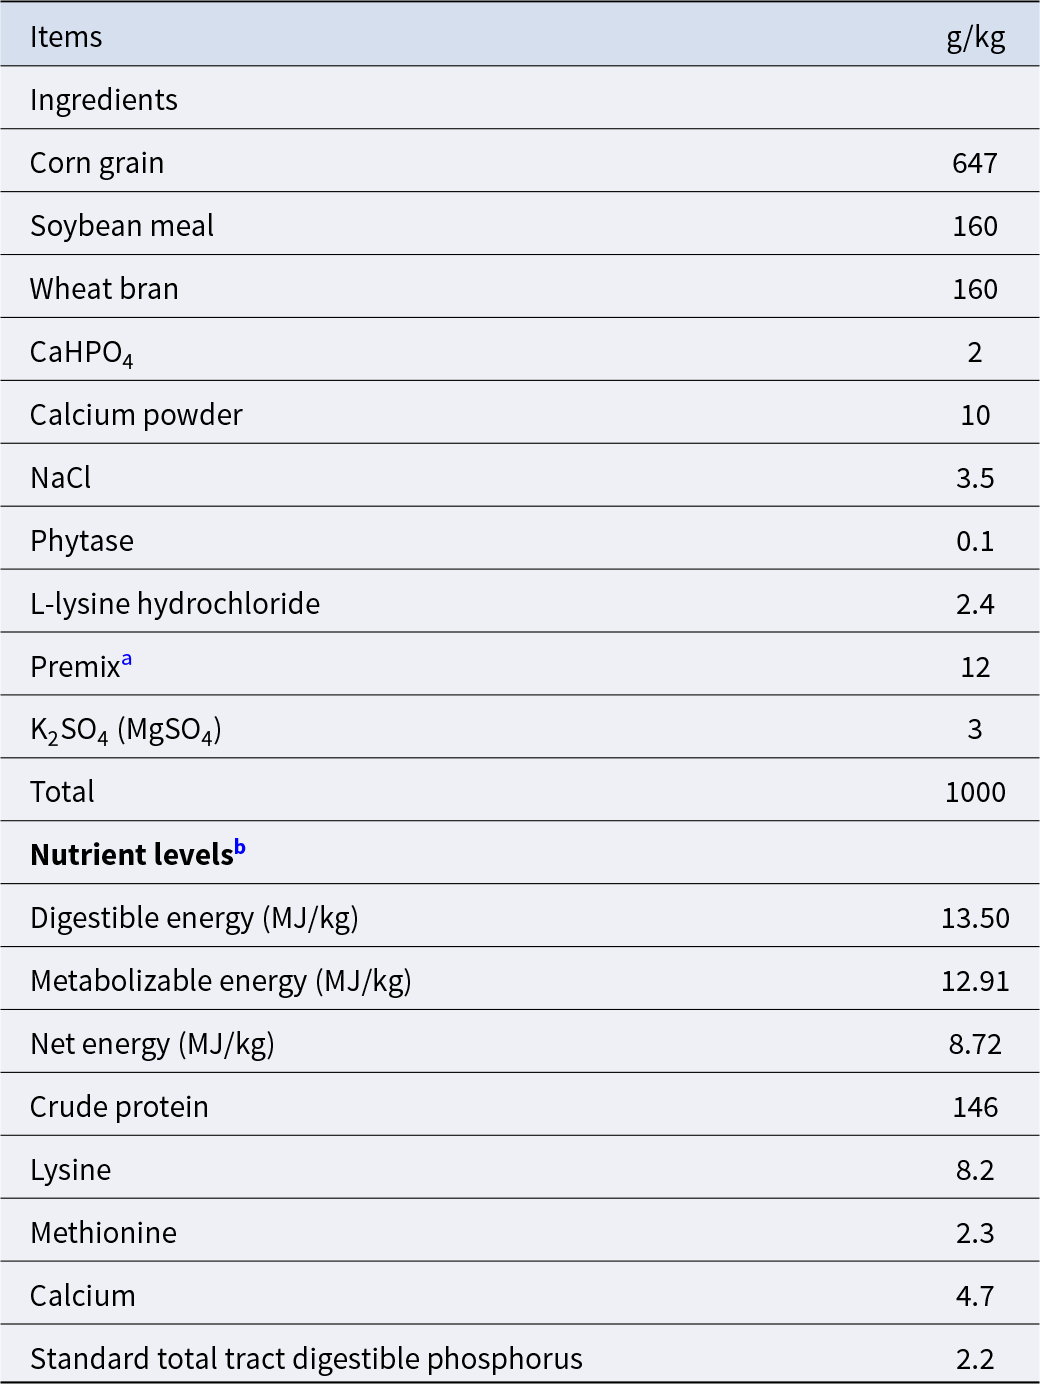
a Premix provided per kg of diets: retinyl acetate, 7420 IU; cholecalciferol, 1000 IU; rac-α-tocopheryl acetate, 25 IU; menadione, 2.5 mg; thiamin, 1.2 mg; riboflavin, 4.5 mg; pyridoxol, 3.0 mg; cobaltamine, 20 μg; nicotinic acid, 25 mg; pantothenic acid 15 mg; folic acid, 1.1 mg; biotin 0.425 mg; Fe, 130 mg; Mn, 42 mg; Zn, 100 mg; Cu, 24.8 mg; I, 0.4 mg; Se, 0.3 mg.
b Crude protein was determined value, others were calculated values.
After binding pigs, the BW was measured at 0, 10, 20, 30 and 38 days at 09:00. Blood was collected from the anterior vena cava on the 1st, 20th and 38th day of the experiment at 16:00, and feed was provided to pigs after blood collection. The serum was collected by centrifugation at 3000 × g for 10 min at 4℃ and stored in refrigerator at −20℃ for the determination of serum biochemical indices. After the 38th day of the trial, all pigs fasted overnight and were euthanized to measure the weight of internal organs (heart, liver and spleen) and collect the ileum tissue and the contents of the colon.
Serum biochemical and free amino acid analysis
The levels of triglyceride (TG), serum glucose, total cholesterol (TC), low-density lipoprotein cholesterol (LDL-C) and high-density lipoprotein cholesterol (HDL-C) were quantified using the corresponding ELISA kits (nos. A110-1, F006, A111-1, A113-1 and A112-1, respectively; Nanjing Jiancheng Bioengineering Institution, Nanjing, China). Serum levels of alanine aminotransferase (ALT) (no. C009) and aspartate aminotransferase (AST) (no. C010) were measured using kinetics-based assays with commercially available kits (Nanjing Jiancheng Bioengineering Institution, Nanjing, China) using an automatic biochemistry analyzer (Selecta XL; Vital Scientific, Newton, MA, USA) according to the manufacturer’s protocols.
The sample (serum on the 38th day) was precipitated with 5% sulfosalicylic acid (1:4), ultrasonically extracted for 30 min, and then further centrifuged at 18,000 rpm for 30 min. The supernatant was taken and filtered with 0.22-μm filter membrane before being analyzed on the machine. As mentioned earlier (Liao et al. Reference Liao, Zeng and Li2017), free amino acid content was detected using a High-Speed Amino Acid Analyzer (L-8900, Hitachi) with Na+ cation exchange column (4.6 mm × 60 mm, 3 μm particles). The chromogenic agent is ninhydrin/sodium acetate buffer and the buffer system is citric acid buffer B1 (pH = 3.2), B2 (pH = 3.0), B3 (pH = 4.0) and B4 (pH = 4.9). The flow rates were 0.4 mL/min for the mobile phase. Other parameters were: column temperature (55°C) and post-column reaction equipment (135°C). The detector was UV-Vis set to 570 and 440 nm.
Hematoxylin–eosin (H&E) staining
H&E staining was performed as previously described (Lin et al. Reference Lin, Chiu and Chen2015). Ileal samples were fixed, dehydrated and embedded in paraffin. The sections were prepared and subsequently stained with H&E. Photomicrographs were obtained using an optical microscopy system (Olympus Corporation, Tokyo, Japan). Quantitative measurement of ileal villi height and crypt depth were conducted with ImageJ (National Institutes of Health, Bethesda, MD, USA).
16S rRNA gene analysis
The colonic contents were collected for the bacterial 16S rRNA sequencing. High-resolution 16S rRNA gene analysis was performed according to the methods (Fadrosh et al. Reference Fadrosh, Ma and Gajer2014). DNA was extracted from the colonic contents using the Qiagen DNA Kit (51640, Germany) according to the instructions provided by the manufacturer. The selected region of 16S rRNA amplification was V3-V4 region, and the common primers used were 341 F and 806 R. The onboard sequencing was carried out using an Illumina NovaSeq PE250 (Illumina, San Diego, USA), followed by bioinformatics analysis. Chimeric sequence detection and de novo operational taxonomic units (OTUs) picked up with 0.97 identities were implemented using Usearch (version 7.0) and UPARSE (http://drive5.com/uparse/), respectively (Edgar Reference Edgar2013). OTU abundance tables were obtained, and QIIME1 (v1.9.1) was implemented for OTU profiling, alpha/beta diversity (principal coordinate analysis, PCoA) and rank abundance curve analyses. Linear discriminant analysis effect size and the rank sum test (R version 3.5.1) were used to screen differential bacteria between the two groups.
Metabolomic analysis
The whole intestinal contents were extracted and centrifuged at 13,300 × g for 15 min at 4℃. About 25 mg of sample was transferred into an EP tube using 500 μL extraction solvent (methanol: acetonitrile: water = 2:2:1, v/v, with isotopically labelled internal standard mixture). The solution was homogenized at the frequency of 35 Hz for 4 min, followed by ultrasonic for 5 min. Repeat the previous step for three times. The solution was incubated at −40℃ for 1 h and centrifuged at 12,000 rpmfor 15 min (4℃). The supernatant was absorbed for follow-up analysis.
LC-MS/MS analyses were conducted using an UHPLC system (Vanquish, Thermo Fisher Scientific) with a UPLC BEH Amide column (2.1 mm × 100 mm, 1.7 μm) coupled to Q Exactive HFX mass spectrometer (Orbitrap MS, Thermo) (Wang et al. Reference Wang, Zhang and Shen2016). The mobile phase was 25 mmoL/L ammonium acetate-25 mmoL/L ammonia hydroxide-water (pH = 9.75) (A) and acetonitrile (B). The parameters of the auto-sampler were 4 ℃, 3 μL. Colonic samples were measured in positive ionization modes. Finally, it was annotated with MS2 database (Biotree DB), with a cutoff value of 0.3 (Dunn et al. Reference Dunn, Broadhurst and Begley2011).
SCFA analysis
Colonic contents (0.4 g) were mixed and vortexed with 1.5 mL of phosphate-buffered saline. The sample was centrifuged at 15,000 × g for 15 min at 4℃. The supernatant was then taken into the new test tube and 25% metaphosphoric acid was added at 9:1 (v/v). Finally, the supernatant was passed through a 0.22-μm filter membrane, and the samples were used for SCFA analysis. The concentration of VFAs in thesupernatant was analyzed by gas chromatograph (GC-2010; Shimadzu Corp, Kyoto, Japan) equipped with a column (HP-INNOWAX 19091 N-133, 30 m × 0.25 mm × 0.25 µm) (Zhang et al. Reference Zhang, Yu and Yang2017).
Statistical analysis
Data were analyzed using SAS software (SAS9.04, Cary NC, USA). The method of analysis was Student’s t-test, and the data were presented as means ± SEMs. P< 0.05 was considered statistically significanct. The abundances of microbiota between the two groups were compared using the Kruskal–Wallis H-test. Spearman’s correlation was used to analyze the correlations of intestinal microbiota, metabolites and SCFAs.
Results
Growth performance
As expected, the calorie restriction significantly decreased the daily feed intake (Fig. 1A) and average daily gain (Fig. 1B) in the CR group than in the Con group (P < 0.05), while there was no significant difference in the feed-to-gain ratio (P > 0.05, Fig. 1C). Compared with the Con group, the cumulative food intake of the CR group decreased significantly since the third day of the experiment (Fig. 2A). Accordingly, the BW was significantly decreased in the CR group versus the Con group at 10, 20, 30 and 38 days at 09:00 (Fig. 2B).

Figure 1. Effects of calorie restriction on performance of pigs. (A) Average daily feed intake. (B) Average daily gain. (C) Feed-to-gain ratio. Calorie restriction significantly decreased the daily feed intake and average daily gain in the CR group than in the control group (P < 0.05), while there was no significantly difference in the feed-to-gain ratio (P > 0.05). Data are presented as mean ± SEM; **P < 0.01, n = 8. Con, control; CR, calorie restriction. The Con pigs were provided with ad libitum access to basal diet, and the amount of feed in the CR group was 70% of that in the Con group.
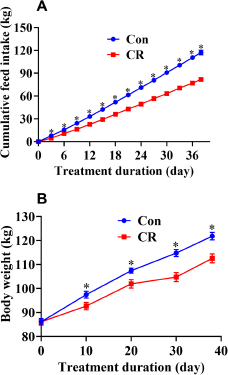
Figure 2. Change of cumulative feed intake and body weight of pigs with or without calorie restriction. (A) The cumulative food intake of average per pig. (B) The body weight of pig. Compared with the Con group, the cumulative food intake of the CR group decreased significantly since the third day of the experiment. Accordingly, the body weight was significantly decreased in the CR group versus the Con group at 10, 20, 30 and 38 days. Data are presented as mean ± SEM; *P < 0.05, n = 8. Con, control; CR, calorie restriction. The Con pigs were provided with ad libitum access to basal diet, and the amount of feed in the CR group was 70% of that in the Con group.
Serum biochemical indices and free amino acid
No significant difference was observed in serum biochemical indices between the two groups on the first day of the experiment (P > 0.05, Table 2). On the 20th day of the experiment, the contents of TC (16% lower, P < 0.05), TG (33% lower, P < 0.05), ALT (46% lower, P < 0.05) and AST (56% lower, P < 0.05) in serum were significantly lower in CR group than in the Con group. On the 38th day of the experiment, the CR group had significantly lower contents of TC (24% lower, P < 0.05), TG (34% lower, P < 0.05), LDL-C (20% lower, P < 0.05), HDL-C (19% lower, P < 0.05), ALT (23% lower, P < 0.05) and AST (20% lower, P < 0.05) in serum than the Con group (Table 2).
Table 2. Effects of calorie restriction on serum biochemical indices of pigs

Con: control; CR: calorie restriction. The amount of feed in the CR group was 70% of that in the Con group. TC, total cholesterol; TG, total triglyceride; LDL-C, low-density lipoprotein cholesterol; HDL-C, high-density lipoprotein cholesterol; ALT, alanine aminotransferase; AST, aspartate aminotransferase. Values are means ± SEMs, n = 8/group.
a,b in the same row, values with no letter superscripts mean no significant difference (P> 0.05), while with different small letter superscripts mean significant difference (P < 0.05).
There were no significant differences in the contents of total free amino acid, alanine, aspartic acid, cystine, threonine, serine, glutamic acid, glycine, valine, methionine, isoleucine, leucine, tyrosine, phenylalanine, lysine, histidine, arginine and proline in serum between the Con and CR groups on the 38th day (P> 0.05, Table S1).
Visceral organ indices and intestinal morphology
After calorie restriction, the CR group had a significantly lower heart weight (13% lower, P < 0.05) than the Con group (Table S2). There were no significant differences in heart, liver and spleen indices between the Con and CR groups (P > 0.05). There were no significant differences in ilea villus height, crypt depth and villus height-to-crypt depth ratio (P > 0.05, Fig. 3).
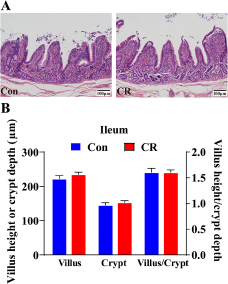
Figure 3. Villus height and crypt depth of the ilea in the Con group and CR group. (A) Representative H&E staining of ileum sections. Scale bar: 100 μm; (B) Villus height, crypt depth and villus-to-crypt ratio of ileum between the two groups. There were no significant differences in ilea villus height, crypt depth and villus height-to-crypt depth ratio between the Con and CR groups (P > 0.05). Data are presented as mean ± SEM; * P < 0.05, n = 8. Con, control; CR, calorie restriction. The Con pigs were provided with ad libitum access to basal diet, and the amount of feed in the CR group was 70% of that in the Con group.
Intestinal bacterial community
The results of gut microbiota sequencing showed that a total of 562,022 high-quality reads were acquired, and the average number of high-quality reads was 35,126. All the sequences were clustered into 1045 bacterial OTUs according to the threshold of 97% similarity. The rarefaction curve of observed species (Fig. S1A) and Chao 1 index (Fig. S1B) of gut microbiota plateaued with the increase of reads. The venn diagram showed that the OTUs were increased in the CR group than in the Con group (Fig. S1C).
Then, the α diversity and β diversity between the two groups were evaluated. In Chao 1 index, there was no significant difference between the two groups (P> 0.05, Fig. 4A). When shown by the PCoA diagram of weighted Unifrac distance, there was no significant difference in microbial structure between the two groups (P> 0.05, Fig. 4B).
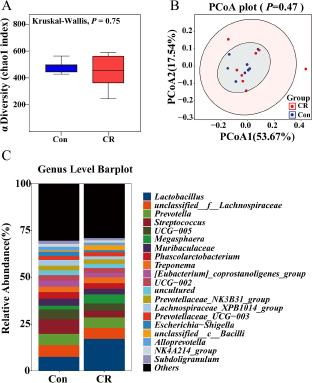
Figure 4. Alpha diversity of (A) Chao 1 index and beta diversity of (B) weighted Unifrac between the Con and CR groups. The relative abundance in colonic microbiota at genus level (C) between the two groups. The α diversity and β diversity between the two groups were evaluated. In Chao 1 index, there was no significant difference between the two groups (P> 0.05). When shown by the PCoA diagram of weighted Unifrac distance, there was no significant difference in microbial structure between the two groups (P> 0.05). The top 20 genus are shown in the composition of gut microbiota. Con, control; CR, calorie restriction. The Con pigs were provided with ad libitum access to basal diet, and the amount of feed in the CR group was 70% of that in the Con group.
At the genus level, the composition of gut microbiota (top 20) is shown in Fig. 4C. The differential genus is shown in Fig. 5. Compared with the Con group, the relative abundance of Lactobacillus in CR group was increased, although there was no significant difference (P> 0.05). Compared to the Con group, the CR group had significantly lower abundance of Lachnospiraceae_XPB1014_group (FC = 0.53, P < 0.05 Fig. 5A), Candidatus_Saccharimonas (FC = 0.33, P < 0.05 Fig. 5B), Escherichia–Shigella (FC = 0.46, Fig. 5C) and Gastranaerophilales (FC = 0.24, P < 0.05 Fig. 5D), whereas exhibited a significant increase in the abundance of Romboutsia (FC = 1.41, P < 0.05 Fig. 5E) and unclassified_c_Bacilli (FC = 4.29, P < 0.05 Fig. 5F).

Figure 5. The differences in colonic microbiota at genus level between the two groups. Compared to the Con group, the CR group had significantly lower abundance of Lachnospiraceae_XPB1014_group (FC = 0.53, P < 0.05), Candidatus_Saccharimonas (FC = 0.33, P < 0.05), Escherichia–Shigella (FC = 0.46) and Gastranaerophilales (FC = 0.24, P < 0.05), whereas exhibited a significant increase in the abundance of Romboutsia (FC = 1.41, P < 0.05) and unclassified_c_Bacilli (FC = 4.29, P < 0.05). Data are presented as mean ± SEM; * P < 0.05, n = 8. Con, control; CR, calorie restriction. The Con pigs were provided with ad libitum access to basal diet, and the amount of feed in the CR group was 70% of that in the Con group.
Metabolomic profile of the colonic contents
In the positive mode, we observed a significant separation between the two groups (OPLS-DA score plots, Fig. 6A). Hotelling’s T-squared ellipse showed that there were significant differences between the two groups, and both were within 95% confidence interval (Fig. 6B).

Figure 6. The OPLS-DA score plots comparing Con and CR pigs in (A) positive electrospray ionization mode metabolomics profiles of colonic contents. (B) The permutation test was evaluated based on the corresponding OPLS-DA model. A significant separation was found between the two groups (OPLS-DA score plots). Hotelling’s T-squared ellipse showed that there were significant differences between the two groups, and both were within 95% confidence interval. n = 8. Con, control; CR, calorie restriction. The Con pigs were provided with ad libitum access to basal diet, and the amount of feed in the CR group was 70% of that in the Con group.
We further analyzed the contents of the two groups of metabolites and showed the 20 metabolites with the most significant differences (Fig. 7A). The CR group was enriched with 16 metabolites (pi-methylimidazoleacetic acid, m-aminobenzoic acid, 3-methylguanine, tyramine, pyrrolidonecarboxylic acid, adenine, pantothenic acid, L-valine, L-phenylalanine, L-methionine, N-acetylhistamine, alanyl-leucine, N-alpha-acetyllysine, asymmetric dimethylarginine, 9-HODE, 6,10,14-trimethyl-5,9,13-pentadecatrien-2-one) (P < 0.05), whereas it had 4 lower metabolites (1H-indole-3-carboxaldehyde, pyricdoxine, duryl aldehyde, 28-norcyclomusalenone) (P< 0.05) compared with the Con group.

Figure 7. Hierarchical clustering heat map (A) and topology analysis of metabolic pathways (B) of significantly differential metabolites from colonic contents of pigs from CR and Con groups. The CR group was enriched with 16 metabolites (pi-methylimidazoleacetic acid, m-aminobenzoic acid, 3-methylguanine, tyramine, pyrrolidonecarboxylic acid, adenine, pantothenic acid, L-valine, L-phenylalanine, L-methionine, N-acetylhistamine, alanyl-leucine, N-alpha-acetyllysine, asymmetric dimethylarginine, 9-HODE, 6,10,14-trimethyl-5,9,13-pentadecatrien-2-one) (P < 0.05), whereas it had 4 lower metabolites (1H-indole-3-carboxaldehyde, pyricdoxine, duryl aldehyde, 28-norcyclomusalenone) (P< 0.05) compared with the Con group. The phenylalanine metabolism, linoleic acid metabolism, phenylalanine, tyrosine and tryptophan biosynthesis, valine, leucine and isoleucine biosynthesis pathway were most significantly affected by CR compared with the Con (P< 0.05). n = 8. Con, control; CR, calorie restriction. The Con pigs were provided with ad libitum access to basal diet, and the amount of feed in the CR group was 70% of that in the Con group.
In order to determine the metabolic pathway of differential metabolites enrichment in colon, KEGG pathway database was used to analyze them. The results of metabolic pathway analysis were shown by bubble chart.
The different metabolites were enriched in several biochemical pathways. Among them, the phenylalanine metabolism, linoleic acid metabolism, phenylalanine, tyrosine and tryptophan biosynthesis, valine, leucine and isoleucine biosynthesis pathway were most significantly affected by CR group compared with the Con group (P< 0.05, Fig. 7B).
SCFA in colonic content
The CR group had no significant difference in the content of total SCFAs compared with the Con group (P> 0.05, Table 3). The CR group had a significantly higher isobutyric acid (21% increase, P < 0.05), isovaleric acid (28% increase, P < 0.05) and valeric acid (29% increase, P < 0.05) content than the Con group (Table 3).
The Spearman’s correlation between differential bacteria (genus) and metabolites was explored in 16 individuals in two groups (Fig. S2A). It was found that the concentrations of L-Glutamic acid and gamma-aminobutyric acid were significantly negatively correlated with Lachnospiraceae_XPB1014_group. The concentrations of xanthine and 9,10-epoxyoctadecanoic acid were significantly negatively correlated with Romboutsia. We also analyzed the Spearman correlations between differential bacteria (genus) and SCFAs (Fig. S2B). Bacteria from genera Escherichia–Shigella, Romboutsia and Candidatus_Saccharimonas were positively correlated with the BW, whereas they were negatively correlated with the valeric acid.
Table 3. Effects of calorie restriction on short chain fatty acids in colon of pigs
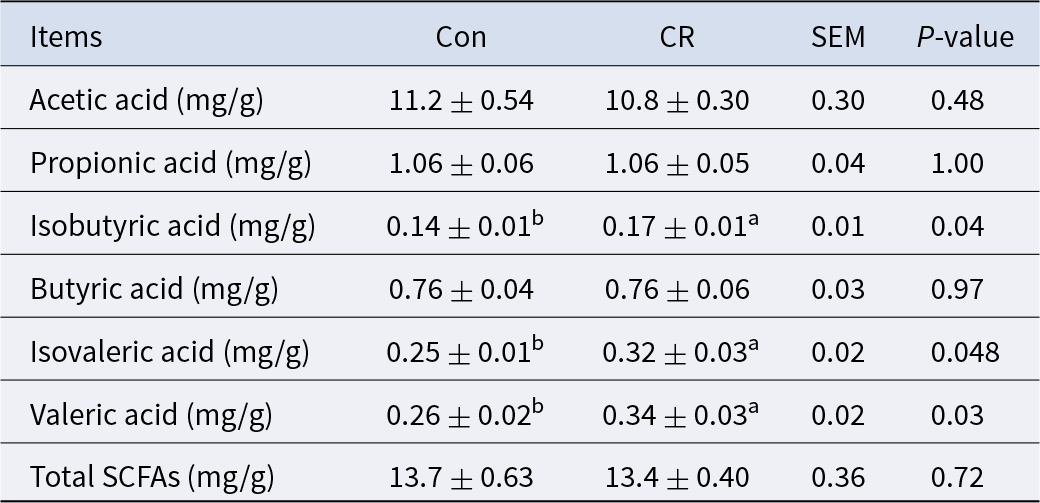
Con: control; CR: calorie restriction. The amount of feed in the CR group was 70% of that in the Con group. Values are means ± SEMs, n = 8/group. In the same row, values with no letter superscripts mean no significant difference (P> 0.05), while with different small letter superscripts mean significant difference (P< 0.05).
Discussion
Our hypothesis was confirmed that calorie restriction with 30% low intake significantly reduced BW gain, serum TC, TG, ALT and AST levels in pigs, and changed the abundance of genus such as Romboutsia, and also increased the concentration of isobutyric acid, isovaleric acid and valeric acid. It is suggested that calorie restriction may be a healthy diet treatment for improving metabolism and reducing obesity. Several studies on calorie restriction in pigs yielded the similar results (Batorek et al. Reference Batorek, Škrlep and Prunier2012; Chaosap et al. Reference Chaosap, Parr and Wiseman2011; Floc’h N et al. Reference Floc’h N, Knudsen and Gidenne2014). Weight loss was also observed in calorie restriction tests in mice (Palma et al. Reference Palma, La Rocca and Gigantino2021). A study of 40% calorie restriction in mice also resulted in a 25% weight loss (Bruens et al. Reference Bruens, Ellenbroek and Suijkerbuijk2020).
Studies have shown that moderate calorie restriction is associated with reducing cardiovascular disease (CVD) mortality (Willcox et al. Reference Willcox, Willcox and Todoriki2007) and improving metabolic risk factors (Stein et al. Reference Stein, Soare and Meyer2012). The level of serum cholesterol is related to the occurrence of CVD; lowering the level of cholesterol has been proven to reduce the mortality of CVD (Gotto and Grundy Reference Gotto and Grundy1999). In this study, the level of serum TC in the CR group decreased significantly, indicating that the calorie restriction reduced the risk of metabolic diseases. In the blood, LDL-C is the main carrier of cholesterol, and when LDL-C decreases, so does the TC in the blood (JAMA 1984). It is reported that there is a significant correlation between the changes of LDL-C and BW (Kelley et al. Reference Kelley, Kelley and Vu Tran2005). In addition, studies have shown that HDL decreases after calorie restriction, which is consistent with the results of this experiment (Son et al. Reference Son, Kwon and Lee2021).
It is well known that dietary changes can affect the composition and function of intestinal microbial community (Kau et al. Reference Kau, Ahern and Griffin2011). A large number of studies have shown that intestinal microbiota can be affected by food intake (Ruiz et al. Reference Ruiz, Cerdo and Jauregui2017; Santacruz et al. Reference Santacruz, Marcos and Wärnberg2009; Zhang et al. Reference Zhang, Li and Yang2013). The study of calorie restriction in obese people found that calorie restriction combined with physical exercise can significantly change the gut microbiota (Santacruz et al. Reference Santacruz, Marcos and Wärnberg2009). In this study, the structure of intestinal microbiota (α and β diversity) did not change significantly after a 38-day calorie restriction in finishing pigs.
However, calorie restriction significantly changed the relative abundance of Lachnospiraceae_XPB1014_group, Candidatus_Saccharimonas, Romboutsia, Escherichia–Shigella, Gastranaerophilales and unclassified_c_Bacilli. Previous studies have shown that Lachnospiraceae_XPB1014_group is negatively correlated with body fat weight (Zhou et al. Reference Zhou, Wang and Xie2018). In this study, the relative abundance of Lachnospiraceae_XPB1014_group decreased significantly in the CR group, which is corresponding with the low BW. In addition, the abundance of intestinal harmful bacteria decreased after calorie restriction in this study.
Research proves that the intestinal Escherichia–Shigella of rats fed with high-fat diet was significantly higher than that of rats fed with normal food, which may impair the gut barrier (Yin et al. Reference Yin, Peng and Zhao2013). Studies have found that the abundance of Escherichia–Shigella is closely related to the overgrowth of bacteria in the small intestine (Steffen et al. Reference Steffen, Berg and Deitch1988). In addition, low levels of Escherichia–Shigella may represent lower levels of antigens and improved inflammatory status (Ruiz et al. Reference Ruiz, Casafont and Crespo2007). Moreover, Escherichia–Shigella is reported to be positively correlated with nonalcoholic fatty liver disease (NAFLD) and involved in the conversion of primary bile acid to secondary bile acid (Hullar et al. Reference Hullar, Jenkins and Randolph2021). In this study, the abundance of Escherichia–Shigella decreased significantly in the CR group, indicating that the intestinal barrier function may be enhanced and inflammation decreased.
It was reported that Romboutsia is negatively correlated with obesity-related indicators (Zhu et al. Reference Zhu, Fu and Xiao2022). Similarly, in this study, the abundance of Romboutsia increased and BW gain decreased in CR group. Romboutsia sedimentorum can use glucose to produce acetic acid and isobutyric acid, which is beneficial for reducing obesity (Wang et al. Reference Wang, Song and Zhai2015). Romboutsia ilealis is abundant in the small intestine of animals and has the ability to break down carbohydrates (Gerritsen et al. Reference Gerritsen, Hornung and Renckens2017). Thus, Romboutsia may be used to predict and treat obesity.
Gut microbiota can produce SCFAs from food ingredients that have not been absorbed/digested by host (den Besten et al. Reference den Besten, van Eunen and Groen2013; Rios-Covian et al. Reference Rios-Covian, Ruas-Madiedo and Margolles2016). The most abundant SCFAs in the colon are acetic acid, propionic acid and butyric acid, accounting for 90% of the total SCFAs (Cummings et al. Reference Cummings, Pomare and Branch1987). SCFAs can activate the oxidation of fatty acids, inhibit the lipolysis and eventually lead to the reduction of free fatty acids in plasma and the decrease in BW (Ge et al. Reference Ge, Li and Weiszmann2008; Kondo et al. Reference Kondo, Kishi and Fushimi2009). Isobutyric acid and isovaleric acid are branched short-chain fatty acids (BSCFAs), which can be produced by valine and leucine fermentation, accounting for only 5% of the total SCFAs production (Wang et al. Reference Wang, Gao and Qian2021). In this study, the 30% calorie restriction had no significant effect on total SCFAs, but significantly increased the concentrations of isobutyric acid, isovaleric acid and valeric acid. According to the correlation analysis, the concentrations of isobutyric acid, valeric acid and isovaleric acid were significantly negatively correlated with Lachnospiraceae_XPB1014_group and Romboutsia.
In conclusion, calorie restriction reduced BW gain, serum TC, TG, LDL-C and HDL-C levels. It simultaneously changed the structure of intestinal metabolites and increased the concentration of isobutyric acid, isovaleric acid and valeric acid, but not the α and β diversity of microbiota. These results indicated that calorie restriction may affect metabolism, reduce obesity and improve intestinal microbiota. The above shows that calorie restriction may be a healthy diet treatment that can reduce obesity and improve metabolism.
Supplementary material
The supplementary material for this article can be found at https://doi.org/10.1017/anr.2024.16.
Acknowledgements
The authors have no acknowledgments to declare.
Author contributions
HFW designed the experiments. JLL, YSW, HQD and WDH performed the experiments. JLL, YFZ and HFW analyzed the data. HFW and JLL wrote and revised the main manuscript. All authors read and approved the final manuscript.
Financial support
This word was supported by grants from the Key R & D Projects of Zhejiang Province (2022C02015, 2023C02026) and National Key R&D Program of China (2022YFD1300602).
Competing interest
The authors declare no competing interests.


 Open access