


Consumption of dietary proteins at the expense of carbohydrates lowers blood pressure( Reference Tielemans, Altorf-van der Kuil and Engberink 1 , Reference Rebholz, Friedman and Powers 2 ), and mechanisms through which proteins affect blood pressure need to be clarified. Endothelial dysfunction (ED) and low-grade inflammation (LGI) are important factors in the progression of CVD( Reference Le Brocq, Leslie and Milliken 3 , Reference Watson, Goon and Lip 4 ), and they are associated with hypertension( Reference Watson, Goon and Lip 4 , Reference Wong, Wong and Tian 5 ). Both macronutrient and micronutrient intake have been found to affect the levels of biomarkers of ED and LGI( Reference Lee, Lee and Choue 6 , Reference Landberg, Naidoo and van Dam 7 ). However, thus far, no clear effects of long-term increased protein intake on levels of C-reactive protein (CRP)( Reference Lopez-Legarrea, de la Iglesia and Abete 8 – Reference Te Morenga, Levers and Williams 12 ), IL-6, TNFα ( Reference Lopez-Legarrea, de la Iglesia and Abete 8 – Reference Pal and Ellis 11 ), soluble E-selectin (sE-selectin), soluble intercellular adhesion molecule 1 (sICAM) and soluble vascular cell adhesion molecule 1 (sVCAM)( Reference Rebholz, Reynolds and Wofford 9 , Reference Ballard, Bruno and Seip 10 ) have been found.
Although the effects of high-energy high-fat meals on postprandial levels of markers of ED and LGI have been studied frequently( Reference Esser, Oosterink and op ’t Roodt 13 – Reference Peairs, Rankin and Lee 15 ), effects of protein and carbohydrate intake on postprandial changes in markers of ED and LGI have been investigated less often. In healthy volunteers, glucose intake was found to increase sICAM, sVCAM, sE-selectin, IL-6 and CRP postprandially compared with fasting values( Reference Derosa, D’Angelo and Salvadeo 16 ). Others found no effect of carbohydrate intake on postprandial levels of sICAM, sVCAM, IL-6( Reference Nappo, Esposito and Cioffi 17 , Reference Mah, Noh and Ballard 18 ), CRP and sE-selectin( Reference Mah, Noh and Ballard 18 ). With regard to dietary proteins, postprandial responses of markers of ED and LGI to protein intake did not differ from those after carbohydrate intake( Reference Pal and Ellis 19 ) or placebo( Reference Ballard, Bruno and Seip 10 ).
We previously reported a blood-pressure-lowering effect after a 4-week consumption of a protein mix compared with maltodextrin in the randomised clinical trial on the effects of PROteins on blood PRESsure (PROPRES)( Reference Teunissen-Beekman, Dopheide and Geleijnse 20 ). The present study aimed to explore chronic and postprandial effects of protein intake compared with carbohydrate intake on ED and LGI. We hypothesised that fasting levels of markers of ED and LGI would be lower after 4 weeks on the high-protein diet compared with the high-maltodextrin diet in the PROPRES study and thus might contribute to the lower blood pressure reported earlier( Reference Teunissen-Beekman, Dopheide and Geleijnse 20 ). To determine whether possible chronic effects of dietary protein on ED and LGI can also be observed acutely, we compared postprandial levels of markers of ED and LGI after ingestion of protein- and maltodextrin-supplemented meals on the first and last day of the intervention in the PROPRES trial. A second postprandial study was conducted to investigate whether different types of proteins or carbohydrates would differentially affect postprandial responses of ED and LGI.
Methods
Study population
The first study was conducted in the year 2009 in a subset of the study participants of the PROPRES study (n 52)( Reference Teunissen-Beekman, Dopheide and Geleijnse 21 ), and it consisted of a chronic, 4-week intervention, and postprandial studies with postprandial assessments on the first and last day of the intervention (online Supplementary Fig. S1). Participants in the chronic and postprandial parts of the PROPRES study were overweight and obese individuals with untreated elevated blood pressure (systolic blood pressure of 130–159 mmHg and/or diastolic blood pressure of 85–99 mmHg). More information of inclusion and exclusion criteria are described elsewhere( Reference Teunissen-Beekman, Dopheide and Geleijnse 20 ). The second study was conducted in the year 2011, and it consisted of a crossover evaluation of postprandial effects of dietary proteins and carbohydrates. Participants had similar characteristics as in the first study, and part of this study group had also participated in the PROPRES study( Reference Teunissen-Beekman, Dopheide and Geleijnse 22 ). Both the first and second studies were conducted according to the guidelines laid down in the Declaration of Helsinki, and all procedures involving human subjects were approved by the medical-ethical committee of Maastricht University Medical Center and Maastricht University (METC azM/UM). Written informed consent was obtained from all participants.
Chronic study
The chronic part of the PROPRES trial had a randomised parallel group design and compared the effects of 4 weeks of exchanging 3×20 g/d of dietary carbohydrates isoenergetically with a protein mixture (20 % pea protein, 20 % soya protein, 30 % egg-white protein, 30 % milk protein isolates) or with maltodextrin on ED and LGI. More details on the 4-week PROPRES trial can be found elsewhere( Reference Teunissen-Beekman, Dopheide and Geleijnse 20 ).
First postprandial study
This study was also part of the PROPRES trial. Twelve-hour postprandial responses to standard mixed meals isoenergetically supplemented with 20 g of the protein mixture or with 20 g of maltodextrin were compared during a 12 h test day at the start and a 12 h test day at the end of the 4-week PROPRES trial. More details on the postprandial part of the PROPRES study can be found elsewhere( Reference Teunissen-Beekman, Dopheide and Geleijnse 21 ).
Second postprandial study
The 4 h postprandial responses after single ingestion of three types of protein (pea, milk and egg-white protein isolate) and two types of carbohydrate (maltodextrin and sucrose) and the protein mix used in the PROPRES study were assessed in forty-eight overweight participants with untreated elevated blood pressure in the morning after an overnight fast. The six test meals in this study contained 0·6 g/kg body mass of one of the test products. Products were tested in a randomised order crossover design (online Supplementary Fig. S2). Comparisons were made between the three protein sources, and responses to the ingestion of maltodextrin were compared with those after the ingestion of sucrose and those after the protein mix. More details of this study are described elsewhere( Reference Teunissen-Beekman, Dopheide and Geleijnse 22 ).
Measurements
Because of their relationship with the risk for CVD( Reference Dower, Geleijnse and Gijsbers 23 ) and their responsiveness to nutritional interventions( Reference van Bussel, Henry and Schalkwijk 24 ), von Willebrand factor (vWf), sE-selectin, sICAM, sVCAM, CRP and serum amyloid A (SAA) were chosen as markers of ED (vWf, sE-selectin, sICAM and sVCAM) and LGI (CRP, SAA and sICAM) in these studies.
Chronic study
Venous blood for measurement of markers of ED and LGI was collected before breakfast in the fasting state on the first and last days of the 4-week intervention.
First postprandial study
Postprandial measurements of vWf and sE-selectin were taken at 1, 2 and 4 h after the protein- or maltodextrin-supplemented breakfast (Fig. 1(a)). sICAM, sVCAM, CRP and SAA were measured every 30 min for the first 2 h after breakfast (30, 60, 90, 120 min) and then hourly for the following 10 h (3, 4, 5, 6, 7, 8, 9, 10, 11 and 12 h) (Fig. 1(a)). Lunch and dinner were consumed 4 and 8 h after breakfast, respectively. These meals were also supplemented with the protein mix or maltodextrin. More details of the meals are described elsewhere( Reference Teunissen-Beekman, Dopheide and Geleijnse 21 ).
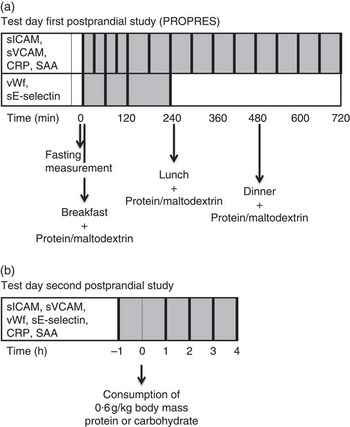
Fig. 1 Measurements on the test days in the first postprandial study (a) and second postprandial study (b). Thick vertical lines represent measurements of parameters mentioned in the same row. CRP, C-reactive protein; PROPRES, randomised clinical trial on the effects of PROteins on blood PRESsure; SAA, serum amyloid A; sE-selectin, soluble endothelial selectin; sICAM, soluble intercellular adhesion molecule 1; sVCAM, soluble vascular cell adhesion molecule 1; vWf, von Willebrand factor.
Second postprandial study
All markers were measured in the fasting state and hourly during 4 h after the test meal (60, 120, 180 and 240 min) (Fig. 1(b)).
Plasma sICAM, sVCAM, sE-selectin, CRP and SAA were assessed using a multi-array detection system based on electro-chemiluminescence technology (SECTOR Imager 2400; Meso Scale Discovery), as previously described( Reference van Bussel, Schouten and Henry 25 ). vWf was assessed in citrated plasma by means of an ELISA( Reference van Bussel, Schouten and Henry 25 ).
Statistical analyses
In addition to responses of individual biomarkers, overall Z-scores for ED and LGI were also analysed to cope with biological variability of each individual marker( Reference van Bussel, Schouten and Henry 25 ) and to ease the interpretation of findings for individual biomarkers. To calculate ED and LGI Z-scores, first a Z was calculated for each individual biomarker as follows: Z=(individual value−population mean)/population sd. Individual biomarker Z-scores were averaged into the overall Z-scores for ED and LGI. The overall ED Z-scores consisted of the biomarkers sICAM, sVCAM, sE-selectin and vWf. Overall LGI Z-scores consisted of CRP, SAA and sICAM. Overall ED Z-scores for the 12 h test day only included sICAM and sVCAM, because the other markers were not determined after lunch until the end of the test day. Further explanations on the calculation of overall Z-scores can be found elsewhere( Reference van Bussel, Schouten and Henry 25 ). The population mean and population standard deviation for each individual biomarker were calculated as follows in the different studies: for the chronic study the population mean (and standard deviation) was based on the average of the fasting levels on the first and last day of the intervention. For the first postprandial study, the population mean (and standard deviation) was based on the average of all measurements during one test day. For the second postprandial study, the population mean (and standard deviation) was based on the average of all measurements during all test days, because this was a crossover trial.
All statistical analyses were performed with the SPSS software (version 20; IBM). A P value of <0·05 was considered to be significant. CRP and SAA were ln-transformed because of their skewed distributions. Participants with CRP values >10 mg/l were excluded from analyses, because a CRP value this high indicates the presence of inflammation( Reference Ridker 26 ), which could confound the postprandial responses.
Chronic study
Differences in fasting values between groups on day 1 of supplementation were tested with an independent samples t test. Fasting values after 4 weeks were tested with a univariate ANCOVA with the fasting value on day 1 as a covariate.
First postprandial study
Postprandial data on each test day were analysed by a linear mixed model analysis using a random intercept model. Analyses started off with the full model including group, time, fasting measurement, BMI, age and sex. BMI, age and sex were removed from the model one-by-one starting with the least significant covariate to test whether they significantly contributed to the model with a −2 log-likelihood test. Significant covariates were kept in the final model. Incremental AUC (iAUC) were calculated in the PROPRES study and tested for deviance from 0 with a one-sample t test to see whether postprandial increases/decreases were significant.
Second postprandial study
Postprandial responses were analysed with a linear mixed model approach that took the crossover design and the correlation between repeated measures into account. The basic model consisted of a random intercept at the individual level. If significant, this model was extended with a random intercept at the meal within individual level (individual×meal) or with a serial correlation over time. The basic model always included the following variables: time, meal, fasting measurements and two variables controlling for the crossover design – meal order and test day number. The interaction term between meal and time (meal×time) and the covariates age, sex and BMI were kept in the model if significant. In case of significant meal×time or meal effect, five post hoc comparisons were made – that is, maltodextrin v. sucrose, maltodextrin v. protein mix, pea protein v. milk protein, pea protein v. egg-white protein and milk protein v. egg-white protein. The critical P value was corrected for these comparisons; therefore, post hoc differences were considered significant at P≤0·01( Reference Teunissen-Beekman, Dopheide and Geleijnse 22 ).
Results
From the fifty-two participants in the chronic study and first postprandial study (maltodextrin group n 27, protein group n 25), three participants in the maltodextrin group were excluded from the present analyses (online Supplementary Fig. S1). This was because two participants had CRP values >10 mg/l on one of the test days, and another participant had missing fasting values on one test day. In the second postprandial study, product test days were excluded from analyses when a participant had CRP levels >10 mg/l during that particular day. As a consequence, one test of sucrose, two tests of pea protein, two tests of milk protein, two tests of egg-white protein and three tests of the protein mix were excluded from analyses (online Supplementary Fig. S2). Baseline characteristics of participants in the first postprandial study and the second postprandial study have been published previously( Reference Teunissen-Beekman, Dopheide and Geleijnse 21 , Reference Teunissen-Beekman, Dopheide and Geleijnse 22 ).
Chronic study: effects of the 4 weeks increased protein intake on endothelial dysfunction and low-grade inflammation
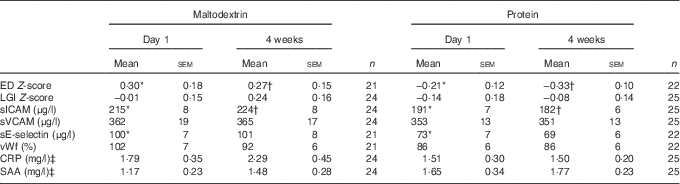
ED Z-scores, sICAM and sE-selectin were significantly lower in the protein group at the start of the intervention (P≤0·04, Table 1), whereas only baseline-corrected ED Z-scores and sICAM were significantly lower in the protein group after 4 weeks of supplementation (P≤0·02, Table 1).
Table 1 Baseline and 4-week levels of markers of endothelial dysfunction (ED) and low-grade inflammation (LGI) in the chronic study (Mean values with their standard errors)
CRP, C-reactive protein; SAA, serum amyloid A; sE-selectin, soluble endothelial selectin; sICAM, soluble intercellular adhesion molecule 1; sVCAM, soluble vascular cell adhesion molecule 1; vWf, von Willebrand factor.
* P<0·05 for between-group differences on day 1 tested with an independent samples t test.
† P<0·05 for between-group differences after 4 weeks tested with ANCOVA correcting for the fasting value on day 1.
‡ Statistical tests were performed with ln-transformed data.
First postprandial study: postprandial responses of endothelial dysfunction to protein- and maltodextrin-supplemented meals
Analyses of iAUC showed significant postprandial decreases on the first day of supplementation and after 4 weeks of supplementation for ED Z-scores, sICAM, sVCAM and sE-selectin (P≤0·05). Postprandial vWf decreased below fasting values on day 1 of supplementation (P≤0·05), but not after 4 weeks.
Twelve-hour postprandial levels of ED Z-scores (composed of sICAM and sVCAM) and sICAM tended to be lower after ingestion of the protein-supplemented meals than after ingestion of the maltodextrin-supplemented meals on day 1 (P=0·07, 0·08, respectively; Fig. 2(a) and (c)), but these did not differ significantly after 4 weeks (Fig. 2(b) and (d)). Postprandial sVCAM levels were significantly lower after ingestion of the protein-supplemented meals compared with the maltodextrin-supplemented meals after 4 weeks of supplementation (P=0·04, Fig. 2(f)), but not on the first day of supplementation (Fig. 2(e)). Four-hour postprandial responses of ED Z-scores (composed of sICAM, sVCAM, sE-selectin and vWf), sE-selectin and vWf did not differ between protein- and maltodextrin-supplemented meals on both test days (data not shown).

Fig. 2 12 h Postprandial responses of endothelium function to meals supplemented with protein or maltodextrin on day 1 of supplementation (left) and after 4 weeks of supplementation (right) in the first postprandial study. (a, b) Endothelial dysfunction (ED) Z-scores, (c, d) soluble intercellular adhesion molecule 1 (sICAM) and (e, f) soluble vascular cell adhesion molecule 1 (sVCAM). Participants included in analyses: maltodextrin group (![]() , n 24) and protein group (
, n 24) and protein group (![]() , n 25). Vertical lines indicate breakfast, lunch and dinner. Values are means with their standard errors. * P<0·05 for the difference between the maltodextrin group and the protein group over the whole 12 h period according to the mixed model.
, n 25). Vertical lines indicate breakfast, lunch and dinner. Values are means with their standard errors. * P<0·05 for the difference between the maltodextrin group and the protein group over the whole 12 h period according to the mixed model.
First postprandial study: postprandial responses of low-grade inflammation to protein- and maltodextrin-supplemented meals
Analyses of iAUC revealed significant postprandial decreases of LGI Z-scores (composed of CRP, SAA and sICAM) on both test days (iAUC P≤0·05, Fig. 3(a) and (b)), whereas postprandial CRP levels increased significantly on day 1 and postprandial SAA levels decreased significantly after 4 weeks (iAUC P≤0·05, Fig. 3(c) and (f), respectively). Postprandial responses of LGI Z-scores, CRP and SAA did not differ between protein- and maltodextrin-supplemented meals (Fig. 3(a)–(f)).

Fig. 3 12 h Postprandial responses of low-grade inflammation (LGI) to meals supplemented with protein or maltodextrin on day 1 of supplementation (left) and after 4 weeks of supplementation (right) in the first postprandial study. (a, b) LGI Z-scores, (c, d) C-reactive protein (CRP) and (e, f) serum amyloid A (SAA). Participants included in analyses: maltodextrin group (![]() , n 24) and protein group (
, n 24) and protein group (![]() , n 25). Vertical lines indicate breakfast, lunch and dinner. Values are means with their standard errors. Postprandial responses did not differ between groups according to the mixed model.
, n 25). Vertical lines indicate breakfast, lunch and dinner. Values are means with their standard errors. Postprandial responses did not differ between groups according to the mixed model.
Second postprandial study: postprandial responses of endothelial dysfunction after consumption of various protein and carbohydrate sources
Postprandial levels of ED Z-scores did not differ between protein sources or between maltodextrin v. sucrose or maltodextrin v. protein mix (Fig. 4(a) and (b)). Pea protein consumption induced lower postprandial levels of sICAM compared with egg-white protein consumption (P≤0·001). Ingestion of the protein mix resulted in lower postprandial levels of sICAM and sVCAM compared with ingestion of maltodextrin (P≤0·004, Fig. 4(c)–(f)). Postprandial responses of sE-selectin and vWf did not differ between test meals (Fig. 4(g)–(j)).

Fig. 4 4 h Postprandial responses of endothelium function to different protein sources (left) and maltodextrin, sucrose and a protein mix (right) in the second postprandial study. (a, b) Endothelial dysfunction (ED) Z-scores, (c, d) soluble intercellular adhesion molecule 1 (sICAM), (e, f) soluble vascular cell adhesion molecule 1 (sVCAM), (g, h) soluble endothelial selectin (sE-selectin) and (i, j) von Willebrand factor (vWf). Participants included in analyses: pea protein (![]() , n 45), milk protein (
, n 45), milk protein (![]() , n 46), egg-white protein (
, n 46), egg-white protein (![]() , n 45), maltodextrin (
, n 45), maltodextrin (![]() , n 47), sucrose (
, n 47), sucrose (![]() , n 45) and protein mix (
, n 45) and protein mix (![]() , n 45). Values are means with their standard errors. * Significant difference between protein mix and maltodextrin over the whole 4 h period shown by post hoc tests with Bonferroni correction (P≤0·01) if the meal was significant (P≤0·05). † Significant difference between pea protein and egg-white protein over the whole 4 h period shown by post hoc tests with Bonferroni correction (P≤0·01) if the meal was significant (P≤0·05).
, n 45). Values are means with their standard errors. * Significant difference between protein mix and maltodextrin over the whole 4 h period shown by post hoc tests with Bonferroni correction (P≤0·01) if the meal was significant (P≤0·05). † Significant difference between pea protein and egg-white protein over the whole 4 h period shown by post hoc tests with Bonferroni correction (P≤0·01) if the meal was significant (P≤0·05).
Second postprandial study: postprandial responses of LGI after consumption of various protein and carbohydrate sources
Postprandial responses in LGI Z-scores did not differ between protein sources or between maltodextrin and sucrose or maltodextrin and the protein mix (Fig. 5(a) and (b)). Ingestion of pea protein induced higher postprandial SAA levels than ingestion of milk and egg-white protein (P<0·001, Fig. 5(e) and (f)). Ingestion of the protein mix resulted in higher postprandial CRP levels than ingestion of maltodextrin (P<0·001, Fig. 5(c) and (d)).

Fig. 5 4 h Postprandial responses of low-grade inflammation (LGI) to different protein sources (left) and maltodextrin, sucrose and a protein mix (right) in the second postprandial study. (a, b) LGI Z-scores, (c, d) C-reactive protein (CRP) (e, f) and serum amyloid A (SAA). Participants included in analyses: pea protein (![]() , n 45), milk protein (
, n 45), milk protein (![]() , n 46), egg-white protein (
, n 46), egg-white protein (![]() , n 45), maltodextrin (
, n 45), maltodextrin (![]() , n 47), sucrose (
, n 47), sucrose (![]() , n 45) and protein mix (
, n 45) and protein mix (![]() , n 45). Values are means with their standard errors. * Significant difference between protein mix and maltodextrin over the whole 4 h period shown by post hoc tests with Bonferroni correction (P≤0·01) if a meal was significant (P≤0·05). † Significant difference between pea protein and egg-white protein over the whole 4 h period shown by post hoc tests with Bonferroni correction (P≤0·01) if meal was significant (P≤0·05). ‡ Significant difference between pea protein and milk protein over the whole 4 h period shown by post hoc tests with Bonferroni correction (P≤0·01) if meal was significant (P≤0·05).
, n 45). Values are means with their standard errors. * Significant difference between protein mix and maltodextrin over the whole 4 h period shown by post hoc tests with Bonferroni correction (P≤0·01) if a meal was significant (P≤0·05). † Significant difference between pea protein and egg-white protein over the whole 4 h period shown by post hoc tests with Bonferroni correction (P≤0·01) if meal was significant (P≤0·05). ‡ Significant difference between pea protein and milk protein over the whole 4 h period shown by post hoc tests with Bonferroni correction (P≤0·01) if meal was significant (P≤0·05).
Discussion
Chronic study
The most important findings in the studies reported here are the lower fasting levels of ED Z-scores and sICAM after 4 weeks on the protein diet compared with the maltodextrin diet in the PROPRES study. Literature data on the effects of protein-enriched diets on fasting levels of markers of ED are relatively scarce. Two-week consumption of a novel whey-derived peptide (5 g/d) did not affect fasting values of sE-selectin, sICAM, sVCAM and CRP compared with placebo in healthy individuals( Reference Ballard, Bruno and Seip 10 ). Eight-week consumption of 40 g/d soyabean protein (including isoflavones) lowered fasting levels of sE-selectin compared with intake of 40 g/d milk protein, but not compared with the intake of 40 g/d complex carbohydrate. No differences between supplements were found for fasting sICAM and sVCAM levels( Reference Rebholz, Reynolds and Wofford 9 ). In contrast to these two studies, we demonstrated a decrease of sICAM levels after the protein mix. One explanation for our finding could be the greater difference in protein intake (60 g/d) between groups in our study. In addition to soya and milk protein, our protein mix also consisted of pea protein and egg-white protein. Therefore, our results are consistent with the view that increased protein intake improves markers of ED within 4 weeks under fasting conditions. This may be related to the dose of protein and/or the mix of protein sources that were tested.
Fasting levels of markers of LGI did not differ between the protein and maltodextrin group after the 4-week intervention. This is consistent with a 12 week trial, which found no differences in fasting concentrations of TNFα, IL-6 and CRP between a whey-, casein- or glucose-supplemented diet (54 g/d)( Reference Pal and Ellis 11 ). In another study, fasting CRP levels did not significantly differ after 8 weeks of soyabean protein or milk protein consumption compared with complex carbohydrate( Reference Rebholz, Reynolds and Wofford 9 ). Eight weeks on a high-protein weight loss diet (30 % of energy intake) also did not affect fasting CRP levels compared with a high-carbohydrate/fibre weight loss diet (20 % of energy intake from protein)( Reference Te Morenga, Levers and Williams 12 ), nor did 1-week consumption of milk tripeptides v. placebo( Reference Hirota, Ohki and Kawagishi 27 ). However, two other studies found unfavourable effects of increased protein intake on LGI. The DIOGENES randomised controlled trial, comparing diets with higher/lower-protein content combined with higher/lower glycaemic index, found evidence that the lower-protein diets were associated with lower fasting CRP concentrations than the higher-protein diets( Reference Gogebakan, Kohl and Osterhoff 28 ). A recent weight loss trial found increased inflammation scores after a high-protein weight loss diet (30 % of energy intake) compared with a normal-protein weight loss diet (15 % of energy intake), whereas levels of individual markers CRP, TNFα, plasminogen activator inhibitor-1 (PAI-1) and IL-6 did not differ between groups. This increased inflammation score was found especially for high animal and meat protein intake and not for increased vegetable or fish protein intake( Reference Lopez-Legarrea, de la Iglesia and Abete 8 ). The protein supplement in our study was only partly composed of animal protein (60 %:30 % milk and 30 % egg-white protein) and not in the form of meat protein, which may explain why we did not find increased LGI in the protein group. In addition, the LGI Z-score in our study was composed of other markers (CRP, SAA and sICAM v. CRP, TNFα, PAI-1 and IL-6)( Reference Lopez-Legarrea, de la Iglesia and Abete 8 ). Thus, we may conclude that increased protein intake has no effect on the levels of markers of LGI under fasting conditions, which is in agreement with several studies( Reference Rebholz, Reynolds and Wofford 9 , Reference Te Morenga, Levers and Williams 12 , Reference Pal and Ellis 19 , Reference Hirota, Ohki and Kawagishi 27 ) but contrasts with findings of two food-based interventions( Reference Lopez-Legarrea, de la Iglesia and Abete 8 , Reference Gogebakan, Kohl and Osterhoff 28 ). This may be related to differences in the type of proteins included in the diets/supplements. Moreover, in food-based studies, the effects of other food constituents cannot be fully excluded.
First and second postprandial studies
Postprandial sVCAM levels were found to be lower after protein-supplemented meals compared with maltodextrin-supplemented meals after 4 weeks of intervention in the first postprandial study and after consumption of 0·6 g/kg of the protein mix compared with maltodextrin in the second postprandial study. Glucose and insulin might be involved in this difference. In a study investigating the effects of ingestion of 75 g glucose v. fructose, both carbohydrates induced similar 3 h postprandial responses of sVCAM despite different postprandial glucose and insulin responses( Reference Mah, Noh and Ballard 18 ), which suggests that glucose and insulin do not modulate postprandial sVCAM levels. We found that other markers of ED and the ED Z-scores did not differ consistently between the protein mix and maltodextrin. Taken together, we found no clear differences in postprandial responses of ED between a protein mix and maltodextrin.
Postprandial CRP levels were found to be significantly higher after ingestion of the protein mix than after ingestion of maltodextrin in the second postprandial study. However, this difference is unlikely to be detrimental, as baseline CRP levels were low and the difference in postprandial CRP was small. In addition, postprandial levels of LGI Z-scores, SAA and sICAM did not differ after ingestion of the protein mix compared with maltodextrin. In addition, in our first postprandial study, we did not find significant differences in postprandial levels of LGI markers between the protein- and maltodextrin-supplemented meals, which is in accordance with another study comparing postprandial effects of protein and carbohydrate-supplemented breakfasts( Reference Pal and Ellis 19 ). In conclusion, we found no clear evidence of differences in postprandial LGI between a protein mix and maltodextrin.
Postprandial responses of markers of ED and LGI were also compared between pea protein, milk protein and egg-white protein ingestion in the second postprandial study. Postprandial sICAM levels were lower after pea protein compared with egg-white protein. The higher arginine content in pea protein (8·7/100 g) compared with milk protein (3·7/100 g) and egg-white protein (6/100 g) might be involved in this, as arginine has been suggested to improve endothelial function because of its role in nitric oxide synthesis( Reference Gornik and Creager 29 ). Addition of arginine to amino acid meals( Reference Mariotti, Huneau and Szezepanski 30 ) or high-fat meals( Reference Lin, Tsai and Chen 31 ) was shown not to affect postprandial levels of sICAM( Reference Mariotti, Huneau and Szezepanski 30 ) or vWf( Reference Mariotti, Huneau and Szezepanski 30 , Reference Lin, Tsai and Chen 31 ). We found that pea protein induced higher postprandial SAA levels compared with egg-white protein and milk protein. Holmer-Jensen et al.( Reference Holmer-Jensen, Karhu and Mortensen 32 ) also found differences in postprandial inflammation between high-fat mixed meals supplemented with different protein sources. Whey protein consumption, which was the most insulinotropic protein source, resulted in lower postprandial CC chemokine ligand-5 concentrations but the highest postprandial levels of monocyte chemotactic protein 1. Both are markers of inflammation, and the authors could not explain the opposing effects of whey protein( Reference Holmer-Jensen, Karhu and Mortensen 32 ). In our study, the most insulinotropic protein (pea protein( Reference Teunissen-Beekman, Dopheide and Geleijnse 22 )) also showed opposing effects on postprandial responses of LGI markers (lower sICAM and higher SAA levels) compared with the other protein sources. Whether postprandial insulin levels have a role in postprandial levels of sICAM and SAA remains unclear.
Some limitations need to be considered when interpreting the results of the studies reported in this paper. One limitation is that measurements discussed in this paper were not the primary end points of these studies. Therefore, these studies could be underpowered for finding significant differences in ED and LGI between groups. In addition, only few of the currently available biomarkers of ED and LGI were measured in these studies. Therefore, the effects of dietary proteins on ED and LGI need to be explored further by studying other biomarkers of ED and LGI in addition to the biomarkers measured in our studies such as endothelin-1, nitric oxide metabolites, PG, TNFα and IL-6( Reference Le Brocq, Leslie and Milliken 3 ). Another limitation of our studies is the lack of a functional measurement of ED, such as flow-mediated dilation (FMD). This was not manageable because of the large number of measurements taken in both studies( Reference Teunissen-Beekman, Dopheide and Geleijnse 21 , Reference Teunissen-Beekman, Dopheide and Geleijnse 22 ). However, the addition of FMD does not improve the association of circulating biomarkers with carotid arterial stiffening( Reference Van Bussel, Henry and Schalkwijk 33 ). Finally, the role of isoflavones in the improvement of markers of ED in the chronic study cannot be fully excluded( Reference Colacurci, Chiantera and Fornaro 34 ), because isoflavones could have been present in the soya protein isolate in the protein mix. In conclusion, the present study found evidence that fasting ED Z-scores and sICAM levels are lower after 4 weeks on an increased protein diet compared with an increased maltodextrin diet, whereas fasting levels of biomarkers of LGI do not differ. Both of our postprandial studies indicate no clear evidence of a favourable effect of protein intake compared with maltodextrin intake on postprandial responses of ED and LGI. Postprandial responses of some biomarkers of ED and LGI differed between protein sources, but the importance of these differences is not clear, because overall ED and LGI Z-scores did not differ between protein sources. Postprandial responses of ED and LGI to the ingestion of maltodextrin did not differ from those after the ingestion of sucrose.
Acknowledgements
The authors thank Harrie Robins, Jeroen Smets, Sander Offermans, Frank Engel, Thijs Käfer, Floor van den Brand and Imco Janssen for their help with conducting the PROPRES study and second postprandial study. The authors also thank Bas van Bussel for his advice on calculation of the ED and LGI Z-scores.
This study was funded by the Top Institute (TI) Food and Nutrition (project number A-1003), Wageningen, The Netherlands. TI Food and Nutrition is a public private partnership of science, industry and government conducting strategic research in food and nutrition (www.tifn.nl).
The authors’ responsibilities were as follows – M. A. v. B., E. J. B., J. M. G., C. G. S., P. W. d. L. and S. J. L. B. designed the study; J. D., K. F. M. T.-B. and M. A. v. B. conducted the study; K. F. M. T.-B. and M. A. v. B.: analysed the data; K. F. M. T.-B., M. A. v. B., J. D., E. J. B., J. M. G., P. W. d. L., C. G. S. and S. J. L. B. wrote the manuscript; and M. A. v. B. assumed primary responsibility for the final content. All of the authors read and approved the final version of this manuscript.
None of the authors has any conflicts of interest to declare.
Supplementary material
For supplementary material/s referred to in this article, please visit http://dx.doi.org/doi:10.1017/S0007114515003530


