


Introduction
Understanding the thermodynamics of an alloy system is fundamental and a prerequisite for interpreting the properties of the materials. So, it is not a surprise that in most binary metallic systems, the phase diagrams are already well evaluated. Nevertheless, in some cases, required data are missing, since the very slow diffusion kinetics demands extremely long annealing times to reach the equilibrium state. One of these systems is the Pt–Pd binary system, an important alloy system essential for catalysis. In Reference Raub1959, Raub proposed the existence of a miscibility gap in the Pt–Pd system with a critical temperature of approximately ~1,043 K. The miscibility gap was extrapolated from the difference of the melting points of Pd and Pt in comparison to the other platinum group binary alloys. Beeskow (Raub, Reference Raub1959) and Bharadwaj et al. (Reference Bharadwaj, Kerkar, Tripathi and Dharwadkar1991) tried to prove the phase diagram, especially the phase separation in the miscibility gap, even though the alloying time takes more than a year, but it still remains as an unclear dashed line in the published phase diagrams (Villars & Okamoto, Reference Villars and Okamoto2012; Raykhtsaum, Reference Raykhtsaum2013).
On the other hand, the formation of intermetallic compounds has been postulated in theoretical works supported by indirect measurement. Kidron (Reference Kidron1967) initially claimed that the Pt–Pd alloy has a large degree of short-range-ordered (SRO) structures, based on “local order modulating functions” calculated from X-ray measurements. In Reference Alcock and Kubik1969, Alcock & Kubik determined the activities of Pd and Pt, which have shown very small deviations from ideality by measuring the vapor pressure of Pd via the Knudsen weight-loss technique. After that, Hayes & Kubaschewski (Reference Hayes and Kubaschewski1971) and Darby et al. (Reference Darby, And and Myles1972) measured the heat of formation using an adiabatic calorimeter, resulting in a negative enthalpy of formation. Since the 1990s, there were many efforts to access the Pt–Pd binary system using quantum mechanical calculations, for example, density functional theory (DFT), molecular dynamics (MD), or Monte Carlo (MC) simulations. The result proposed an exothermic enthalpy of mixing, supporting the existence of ordering structures (Lu et al., Reference Lu, Klein and Zunger1995; Park & Lee, Reference Park and Lee1999; Kolb et al., Reference Kolb, Müller, Botts and Hart2006; Turchi et al., Reference Turchi, Drchal and Kudrnovský2006; Luyten et al., Reference Luyten, De Keyzer, Wollants and Creemers2009; Seo et al., Reference Seo, Kim, Hiroi, Song, Kumara, Tayal and Sakata2018). But these ordered phases were predicted at a very low temperature of 422 K (149°C) (Turchi et al., Reference Turchi, Drchal and Kudrnovský2006) and 190 K (−83°C) (Kolb et al., Reference Kolb, Müller, Botts and Hart2006), the latter far lower than the actual application temperature.
Furthermore, Bindi et al. (Reference Bindi, Zaccarini, Garuti and Angeli2013) investigated the mixing behavior of Pt and Pd using geological samples. The observed compositions of a cubic structure were interpreted as intermediate stages toward complete miscibility.
Direct experimental data, which could prove the postulated phase transition, are absent. Thus, the Pt–Pd phase diagram remains an unresolved topic, despite the increasing usage of the Pt–Pd alloy as a catalyst. In this work, we try to overcome the lack of information by applying atom probe tomography (APT) to thin film structures demanding only short diffusion length, ~10 nm, to establish equilibrium. Pt and Pd multilayers are deposited via ion beam sputtering and annealed at different temperatures to approach equilibrium states. Three different sets of sample were prepared: (1) A multilayer stack made of pure layers of Pd and Pt to investigate the mixing process. (2) A multilayer stack made of individual alternating pre-alloyed layers of two distinct PtxPd1-x concentrations. (3) A single pre-alloyed PtxPd1-x phase. Type 2 and 3 samples were prepared to observe potential decomposition reactions.
Then, needle-shaped samples are prepared by annular milling using a focused ion beam (FIB) and subsequently measured in a custom-made APT instrument. The compositions of the measured volumes were characterized via composition profiles and the interdiffusion coefficients for all samples were calculated using the Fourier series solution of the diffusion equation.
Experimental Method
Sample Preparation
Multilayer structures have been produced consisting of thin alternating bilayers of Pd and Pt by ion beam sputtering as described in a previous article (Stender, Reference Stender2010) except that the original tungsten post was substituted by a Pt post. Initially, a platinum tip is produced by electrochemical polishing from a pure Pt wire (0.1 mm diameter, 99.9%, Chempur) using a solution of 15% CaCl2 in H2O + Aceton and a graphite electrode. Starting with an a.c. voltage of 15 V until necking of the wire was observed, the applied voltage was reduced to a.c. 5 V until breakage and subsequent finalization with a.c. 1 V. For the subsequent layer deposition, the tips were blunted using a focused Ga ion beam (Scios DualBeam, FEI) preparing a planar area with a radius of approximately 1−2 μm. In the next step, the desired layer structure was deposited using a custom-made ion beam sputtering system equipped with a 3 cm beam diameter Kaufmann type ion source from Veeco inc. in an ultra high vacuum (UHV) chamber. The residual pressure before deposition was 2.0 × 10⁻⁸ mbar and the Ar working pressure was set to (~2 × 10⁻⁴ mbar). The applied beam voltage, beam current, and accelerator voltage were adjusted to 600 V, 20 mA, and 200 V, respectively.
For the pure multilayer structure, pure Pt and pure Pd targets (99.95%, Wieland Edelmetalle GmbH) were used. In the case of the alloyed system, special targets were produced by gluing Pt and Pd foil (99.9% Chempur) onto the Pd and Pt targets, respectively. In total, 40 multilayers were deposited. The single layer thicknesses were adjusted to 8–12 nm by using a quartz balance located close to the substrate as displayed in Figure 1a. The pre-alloyed single layer with the composition of 50 at% PtPd was deposited on the post with the thickness of 350–400 nm.
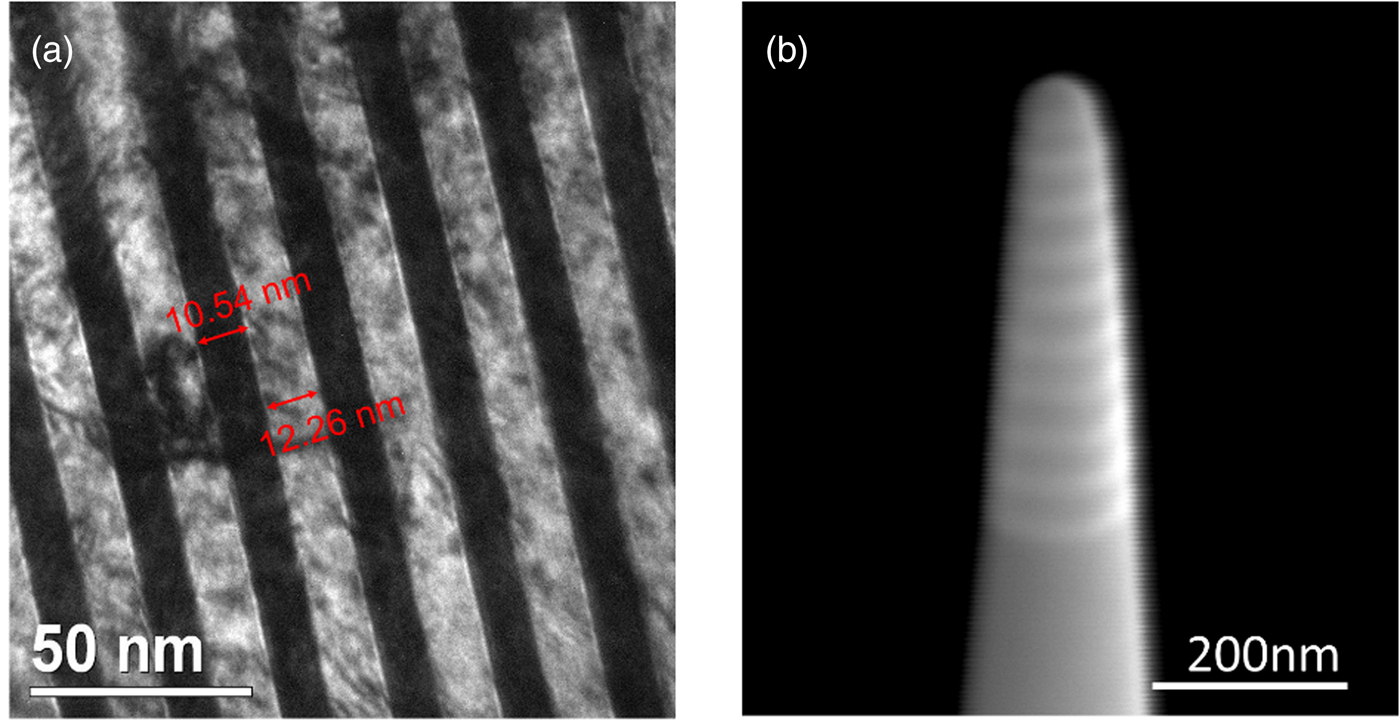
Fig. 1. Pure multilayer sample (as-deposited sample): (a) cross-section TEM image of the pure Pt (dark) and Pd (bright) multilayer structure: thickness of individual layer is 8–12 nm and (b) SEM of tip ready for APT measurement after annular milling by FIB.
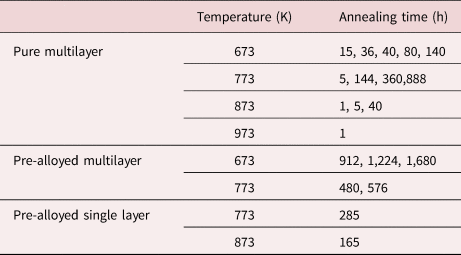
Subsequent isothermal annealing sequences were carried out at various temperatures (673, 773, 873, and 973 K) in a UHV furnace with a residual gas pressure of 10−8 mbar. The annealing times for the respective samples are listed in Table 1.
Table 1. Annealing Temperature and the Annealing Time for Observed Samples.
Finally, tips were sharpened by FIB annular milling (Larson et al., Reference Larson, Petford-Long, Ma and Cerezo2004). Starting with an acceleration voltage of 30 kV and a current of 0.1 nA, the current was reduced stepwise until an apex radius of 50 nm was reached as shown in Figure 1b. Final polishing was carried out at 5 kV 48 pA to remove amorphous layers caused by Ga bombardment.
APT Measurement and Data Analysis
For atom probe analysis, a noncommercial laser-assisted tomographic atom probe (Stender et al., Reference Stender, Oberdorfer, Artmeier, Pelka, Spaleck and Schmitz2007) was used. The base temperature was set to 63 K and a wavelength of the 355 nm (UV) was chosen for the 250 fs laser pulses. The frequency of the laser was set to 200 kHz at an average power of 30 mW equal to 150 nJ pulse energy with a spot size of 50 μm.
The datasets were reconstructed using the SCITO software package (Inspico) (Stender & Balla, Reference Stender and Balla2018). The main task for this work was the determination of the Pt concentration in the individual layers of the samples to plot the composition change upon time. However, this only can give reliable results when the layer thicknesses are the same for all samples because the final concentration is highly dependent on the initial thickness of the layers. Avoiding any fluctuations is practically impossible in a real experiment and can only be limited to a minimum.
We, therefore, apply the well-known Fourier series solution of Fick's diffusion equation to interpret the measurement results. The diffusion coefficients are directly calculated from the initial concentration and the obtained diffusion distance in each sample. This approach can be applied to systems that show a periodic dependence of the measured concentration on the measurement position.
With the separation of variables, the solution of partial differential equations can be expressed with spatial and temporal functions (Mehrer Helmut, Reference Helmut2007). The used general solution for Fourier series analysis is
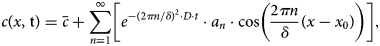 $$c( {x, \;{\rm t}} ) = \bar{c} + \mathop \sum \limits_{n = 1}^\infty \left[{e^{-{( {2\pi n/\delta } ) }^2\cdot D\cdot t}\cdot a_n\cdot \cos \left({\displaystyle{{2\pi n} \over \delta }( {x-x_0} ) } \right)} \right],$$
where  $\bar{c}$ is the mean composition, D is the interdiffusion coefficient, t is the annealing time, x is the distance variable, and x 0 is the offset of the profile. δ is the period of the initial layer stack, δ = δ 1 + δ 2, where δ 1 and δ 2 are the initial layer thickness for the Pt and Pd layer in the case of the pure multilayer sample, respectively.
The Fourier coefficients, a n, are obtained by integrating over a full period and results in
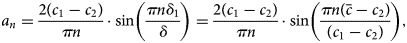 $$a_n = \displaystyle{{2( {c_1-c_2} ) } \over {\pi n}}\cdot \sin \left({\displaystyle{{\pi n\delta_1} \over \delta }} \right) = \displaystyle{{2( {c_1-c_2} ) } \over {\pi n}}\cdot \sin \left({\displaystyle{{\pi n( {\bar{c}-c_2} ) } \over {( {c_1-c_2} ) }}} \right),$$
where c 1 is the initial atomic fraction of Pt in the Pt-rich layer and c 2 is the initial atomic fraction of Pt in the Pd-rich layer which are given by the sample preparation. δ 1 is calculated from average composition,  $\;\bar{c}$, and period, δ, so the $\delta _1 = ( {\bar{c}-c_2} ) \ast \delta /( {c_1-c_2} )$.
The defined parameters and variables are depicted in Figure 2.
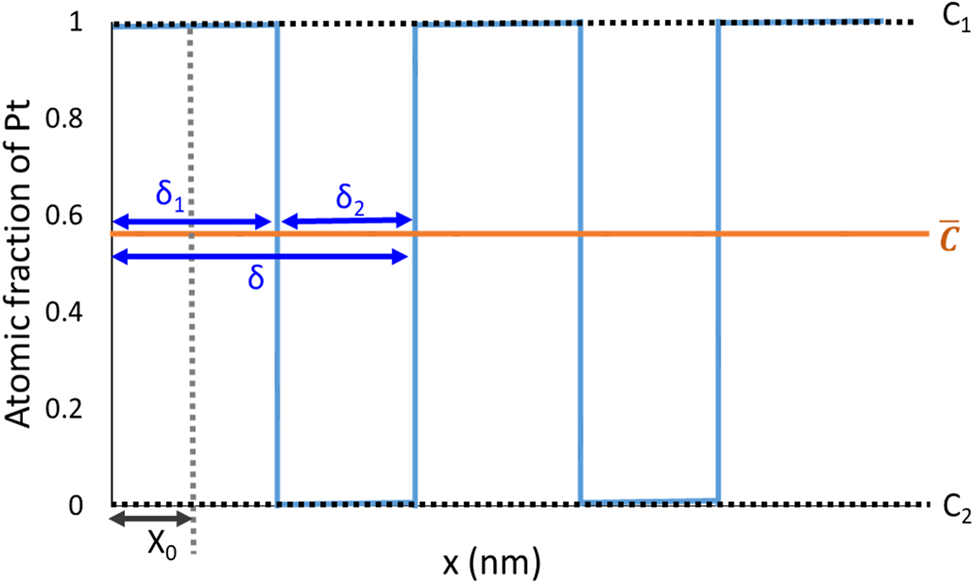
Fig. 2. Fitting parameters used for Fourier series analysis. Example of composition profile for the pure multilayer sample before annealing.
Figure 3 shows an example sample of a pure multilayer structure annealed at 773 K for 144 h. Despite the long annealing, the initial layer structure is maintained showing a periodic oscillation. 1D composition profiles were obtained by probing the reconstructed volume with small cylinder (diameter of 10 nm) perpendicular orientated with respect to the layer interface. The resulting concentration profiles were fitted using the Fourier series solution approach equation (1) with the aid of Mathematica software and the diffusion coefficients were calculated (Wolfram Mathematica). Since this is a binary system, only the resulting Pt curve was considered and fitted in the calculations. For the analysis, the annealing temperature, the time, t, and the initial compositions, c 1 and c 2, are required. From the Fourier series fitting, the interdiffusion coefficients were calculated as shown in Figure 3. At the end, the plot of calculated interdiffusion coefficients in dependence of the annealing time was obtained. In order to enhance the reliability of the fitting, only profiles with R 2 > 0.97 were further analyzed.
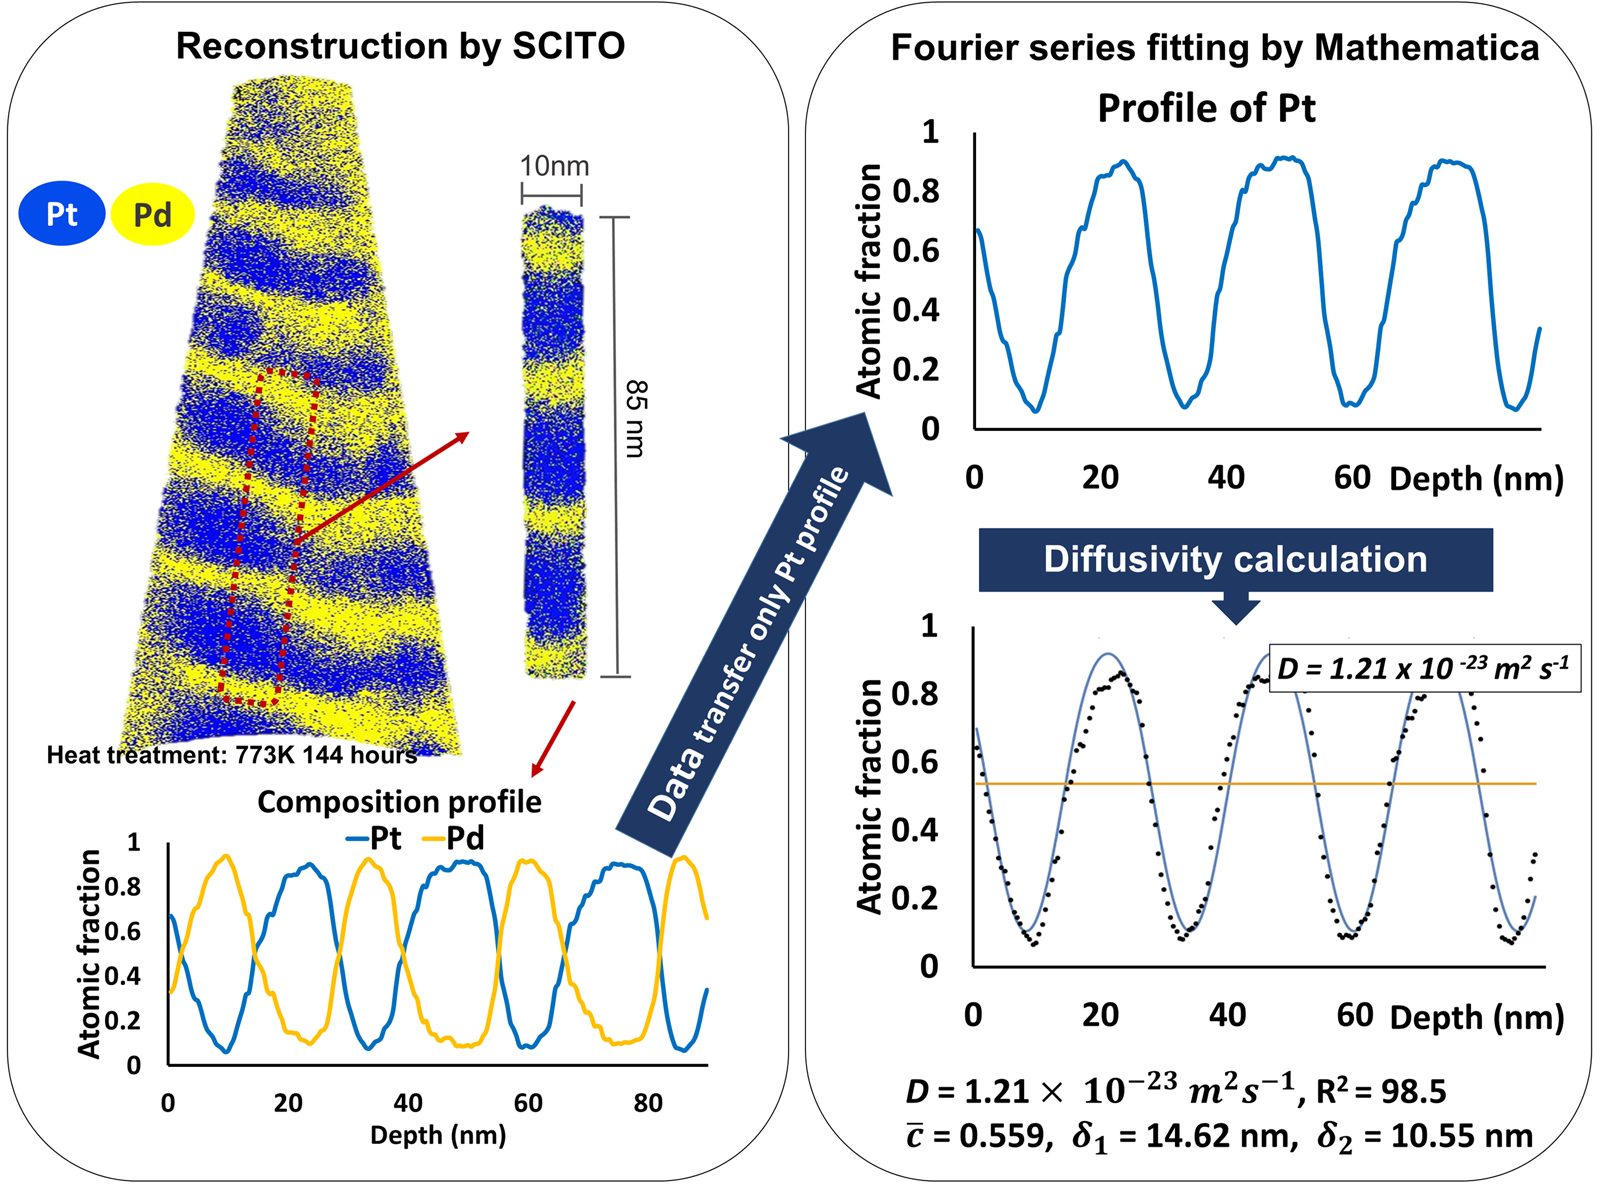
Fig. 3. Example of reconstruction by SCITO and Fourier series analysis by Mathematica for the pure multilayer sample annealed at 773 K for 144 h determining the interdiffusion coefficient, D.
Results
Pure Multilayer System
First, measurements of specimens with the initially pure multilayer system were carried out. An example for the measured as-prepared state is shown in Figure 4.
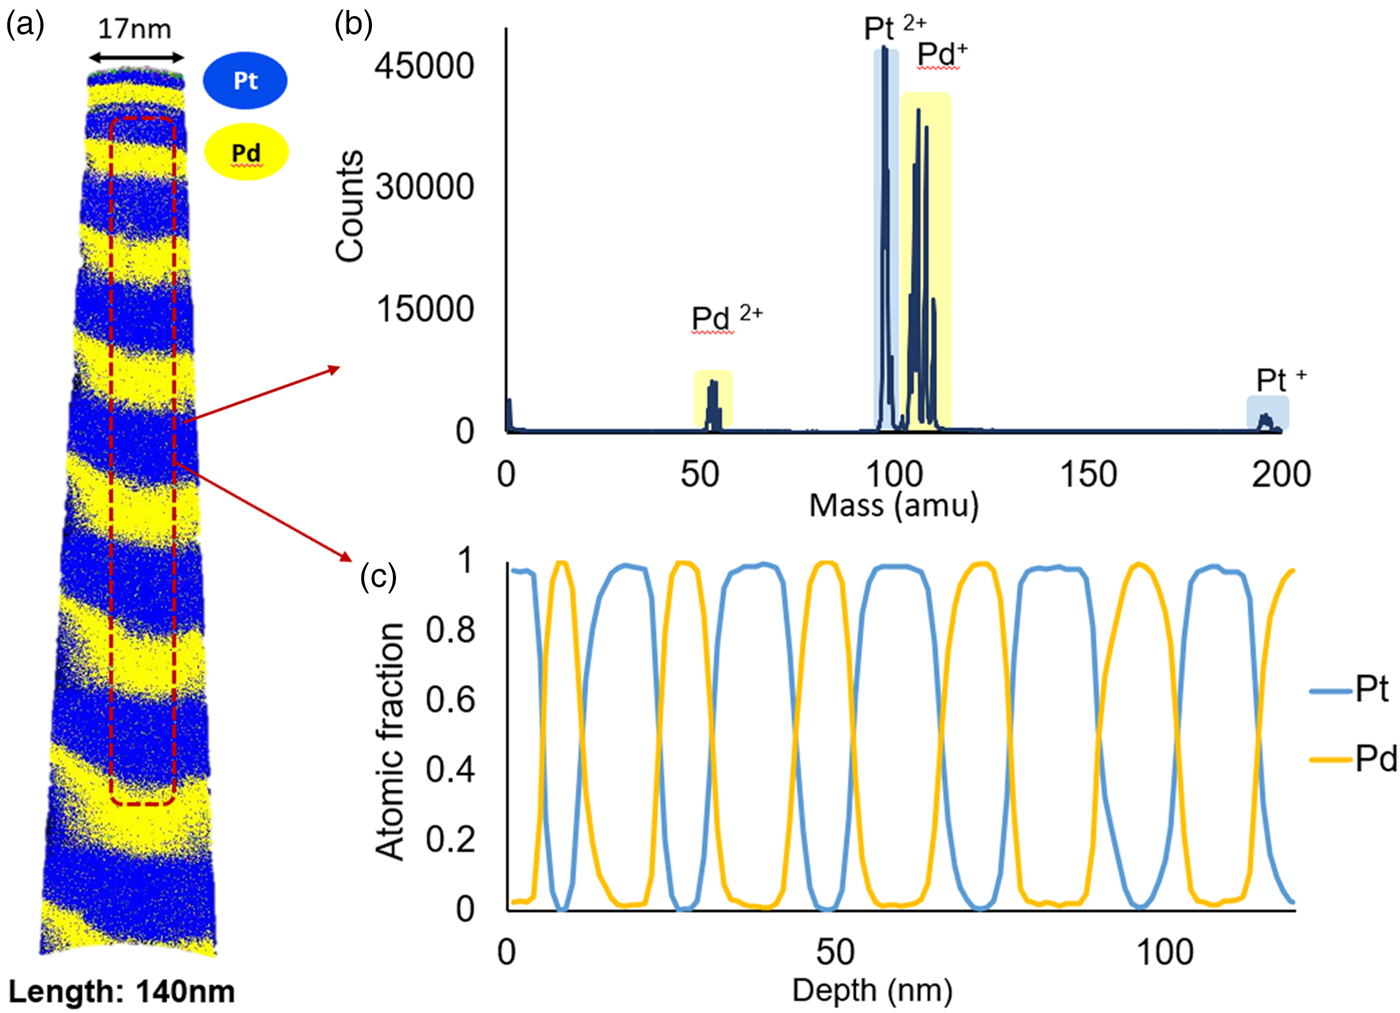
Fig. 4. As-deposited sample with the pure multilayer: (a) 3D reconstruction, (b) mass spectrum, and (c) composition profile.
As listed in Table 1, isothermal annealing sequences were carried out at four different temperatures 673, 773, 873, and 973 K.
Firstly, the samples, which experienced the highest heat treatment at 973 K for 1 h, reveal total mixing. The initial layer structure is lost. The determined composition profile reveals a homogeneous distribution of the constituents within the measured volume as depicted in Figure 5. Thus, it is safe to say that the critical temperature of the miscibility gap, if any exists, is certainly below 973 K, lower than Raub's (Reference Raub1959) expectation of 1,043 K.
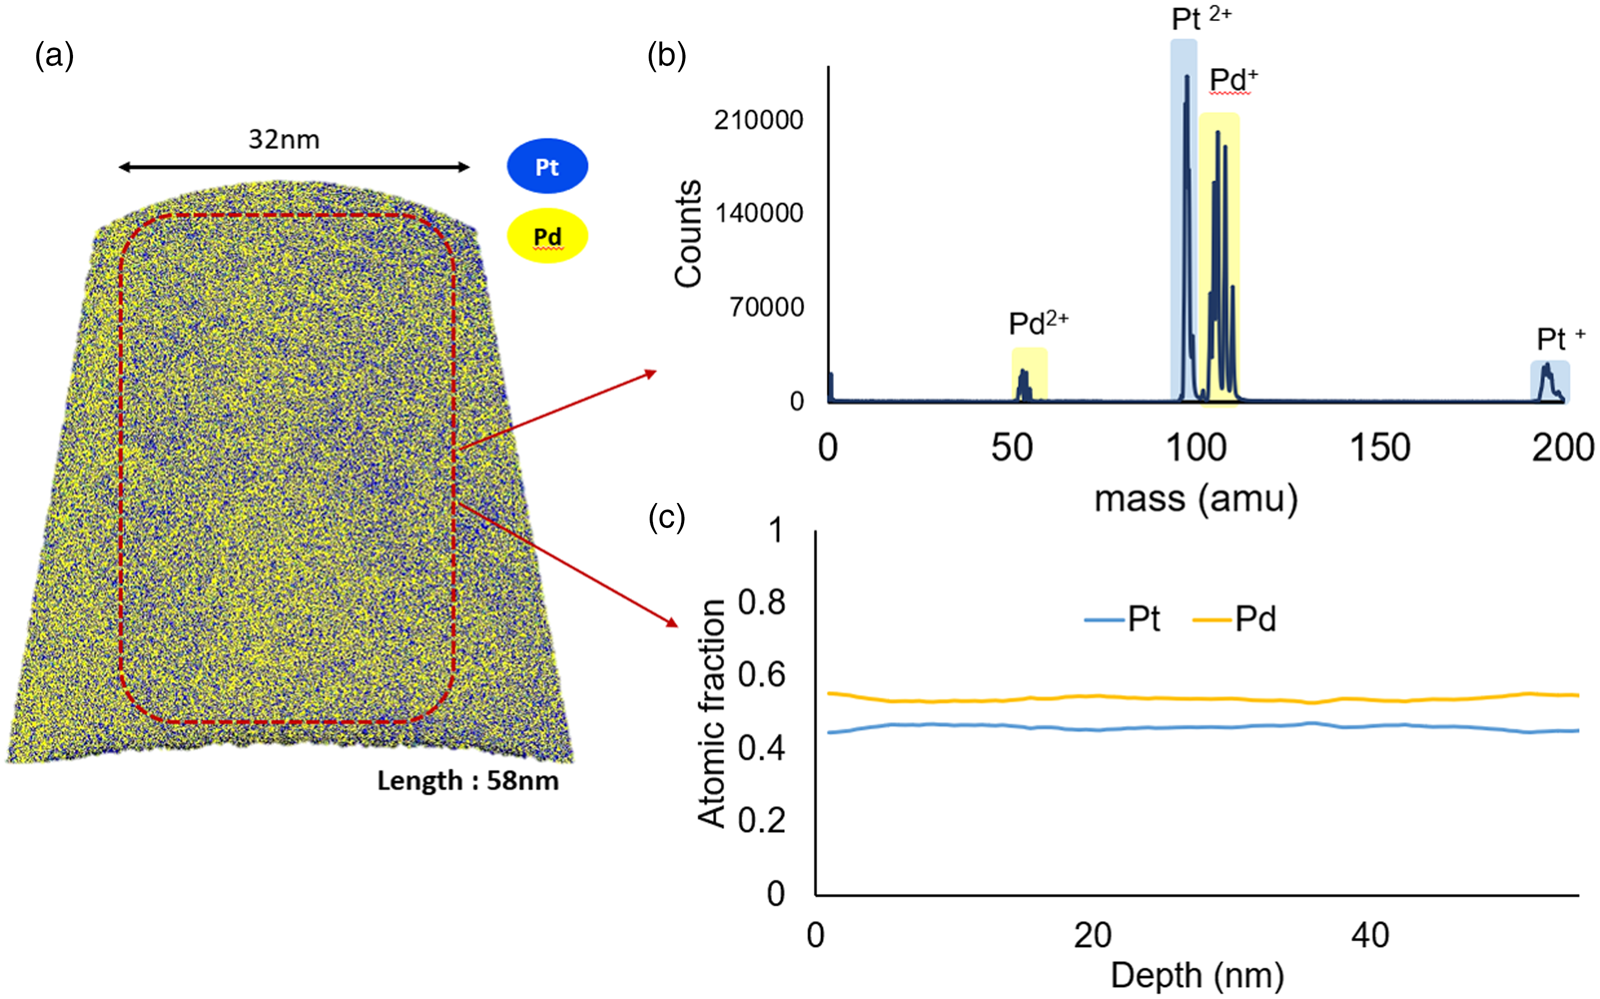
Fig. 5. Annealed sample at 973 K for 1 h. The multilayer structure is disappeared by mixing. (a) 3D reconstruction, (b) mass spectrum, and (c) composition profile.
On the other hand, the samples annealed at 673, 773, and 873 K maintained the multilayer structure, despite the exceedingly long annealing. The respective diffusion coefficients were calculated as described earlier.
More specifically, for the samples annealed at 873 K for 1 and 5 h, the both diffusion coefficients agree very well within the limits of measurement accuracy. Their values were determined to (2.35 ± 0.18) × 10−21 m2/s and (1.33 ± 0.04) × 10−21 m2/s, respectively. After 40 h of annealing, slight composition changes were observed and the diffusion coefficients dropped to the range of ~10−23 m2/s. Figure 6 shows the representative measurements after different times of annealing at 873 K.
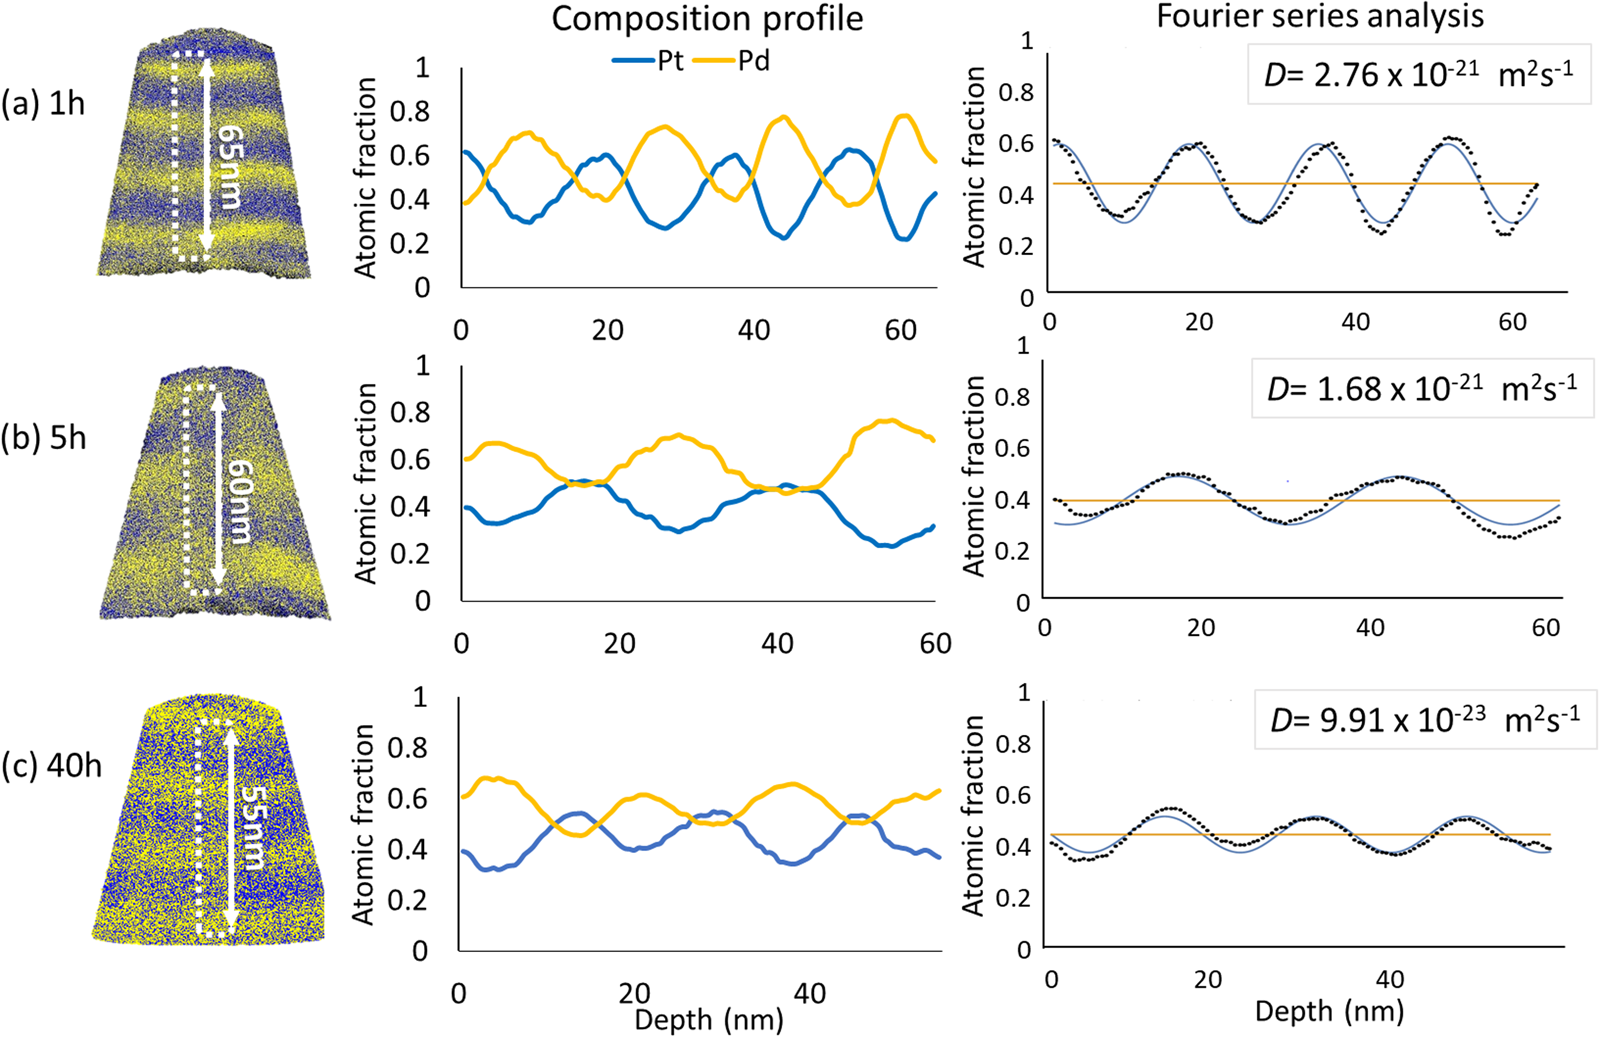
Fig. 6. The representative samples annealed at 873 K for (a) 1 h, (b) 5 h, and (c) 40 h.
In the case of 773 K, the average diffusion coefficient of the samples annealed for 5 h is determined to (1.03 ± 0.06) × 10−22 m2/s. Between 5 and 144 h, a significant reduction of the diffusion coefficient is observed to (1.11 ± 0.08) × 10−23 m2/s. After 888 h, the diffusivity is reduced to (3.46 ± 0.15) × 10−24 m2/s. The example results obtained from the samples heated at 773 K are displayed in Figure 7.
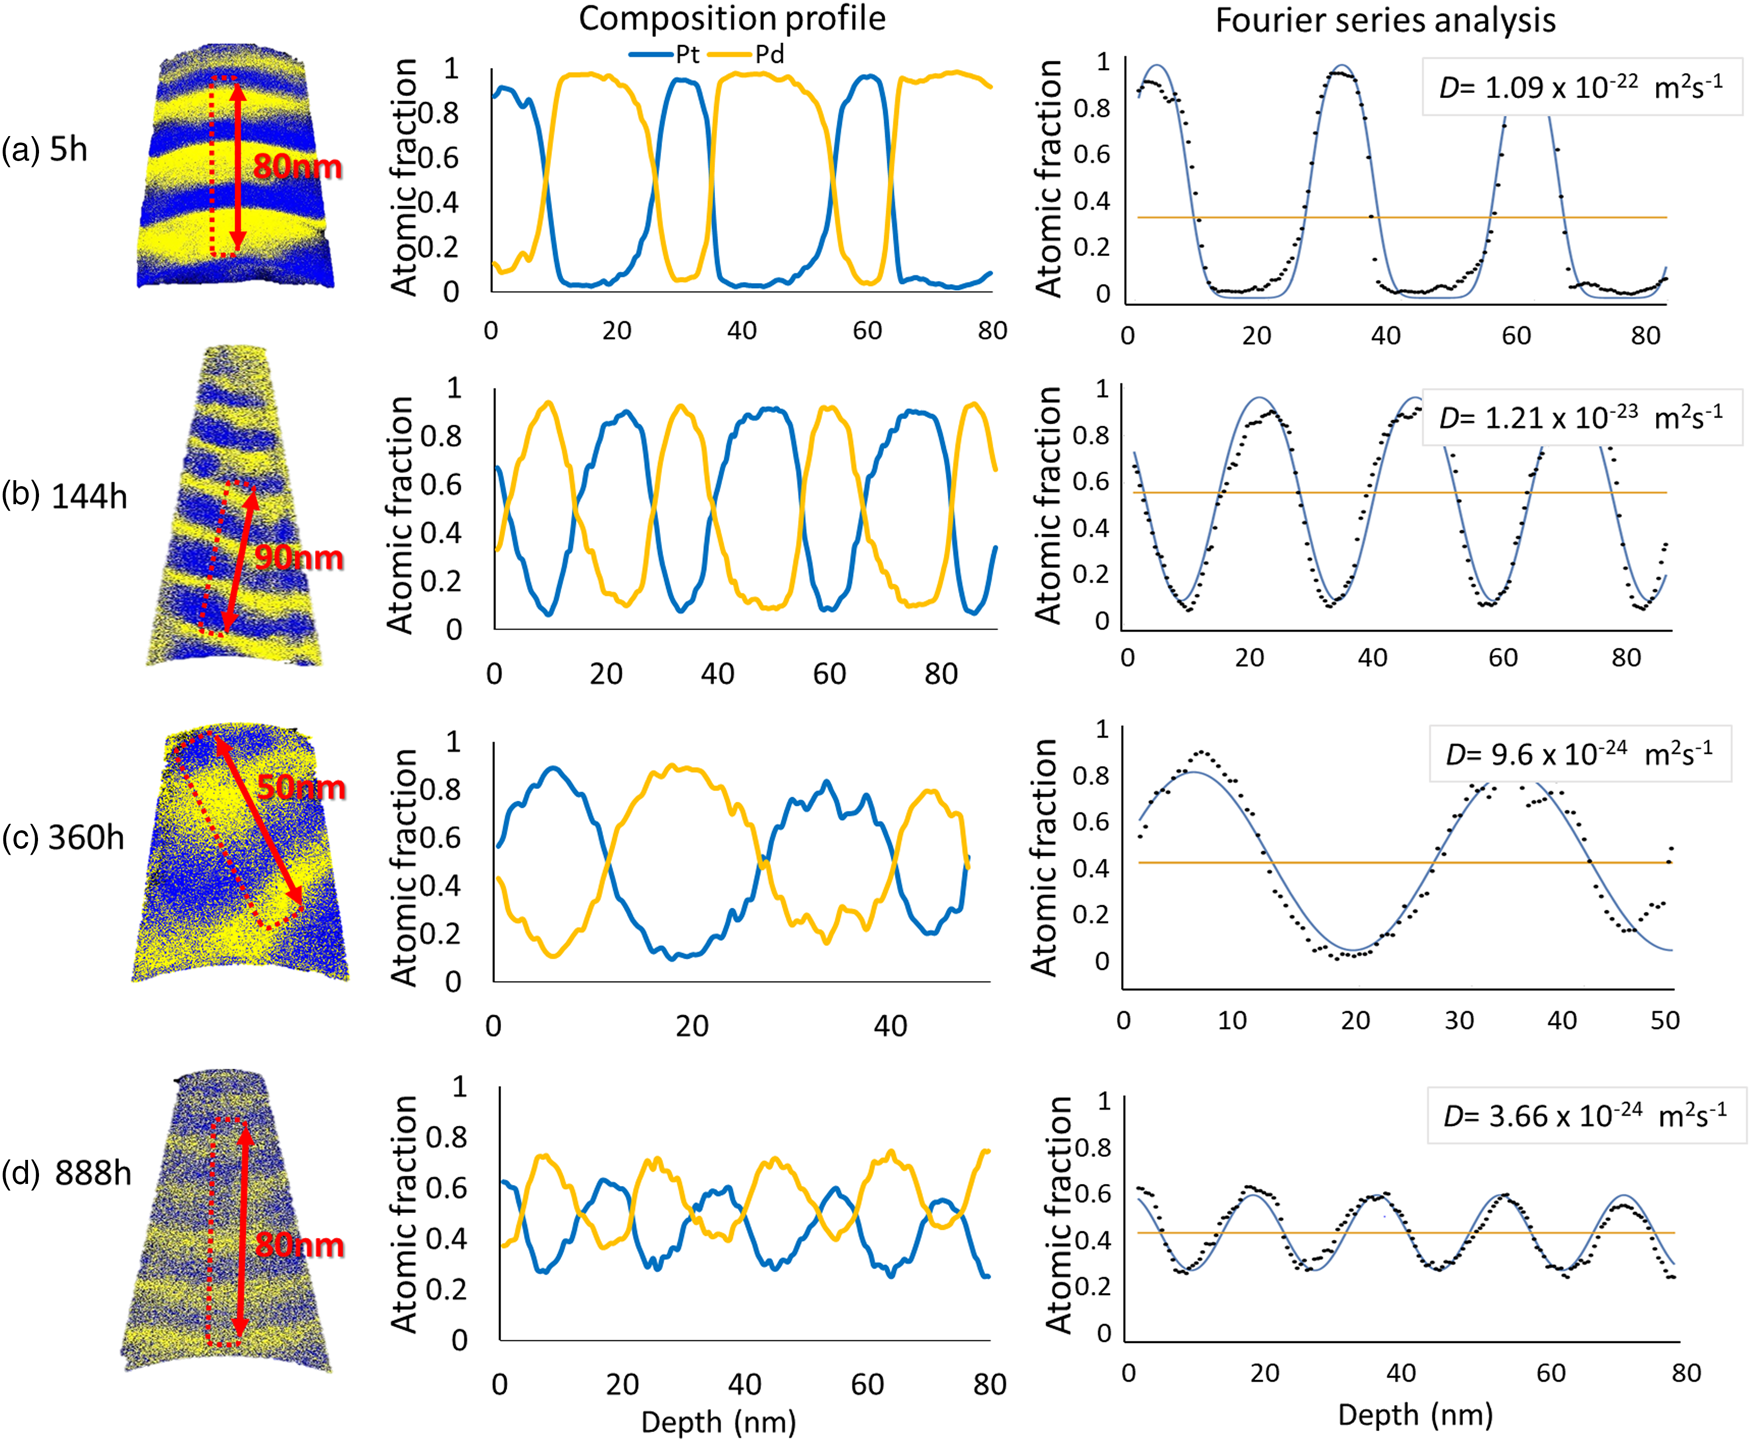
Fig. 7. The representative samples annealed at 773 K for (a) 5 h, (b) 144 h, (c) 360 h, and (d) 888 h.
The samples annealed at 673 K for 15, 36, 40, 80, and 140 h show lower diffusivity compared to the other annealing temperatures. From 15 to 36 h, the diffusion coefficients have decreased to one-tenth, from (4.12 ± 0.38) × 10−23 m2/s to (7.05 ± 0.33) × 10−24 m2/s. During further annealing for 40, 80, and 140 h, the diffusivities keep decreasing, but the extent of reduction is diminished as shown in Figure 8. Interestingly, in the case of 80 h, the samples exhibit a significant composition change, even more pronounced than for the longer annealed samples. The reason for this is that layer thicknesses are very thin, about 5–7 nm, almost half of the other samples. However, the calculated diffusion coefficients are in the acceptable range, because the actual layer thickness is taken into account in the Fourier series calculation approach.
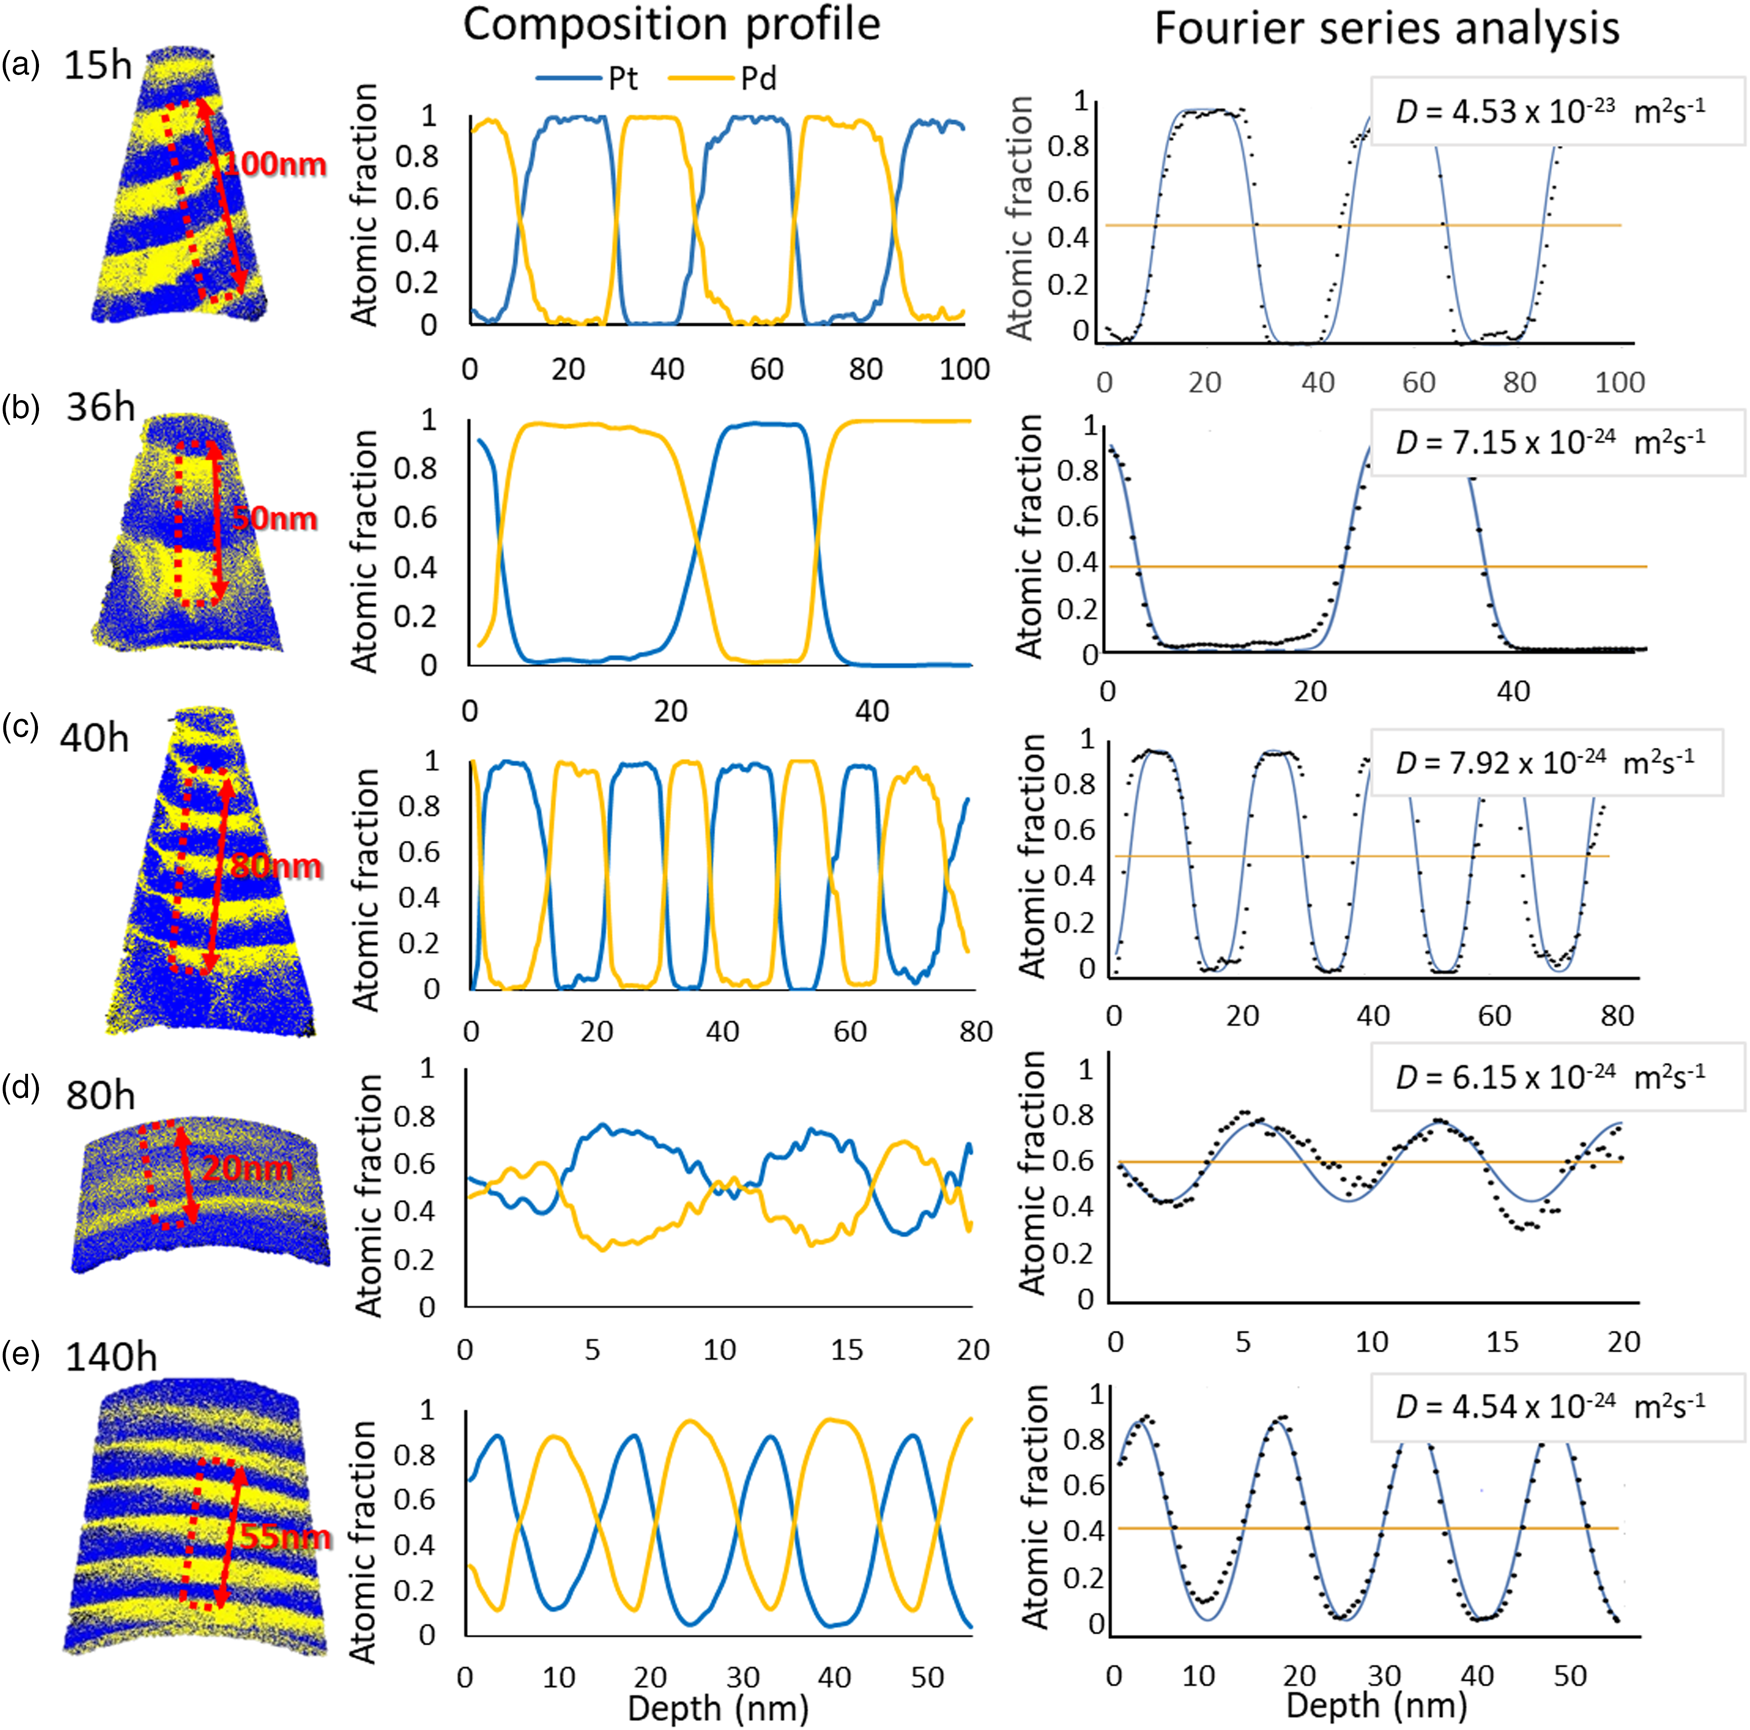
Fig. 8. The representative samples annealed at 673 K for (a) 15 h, (b) 36 h, (c) 40 h, (d) 80 h, and (e) 140 h.
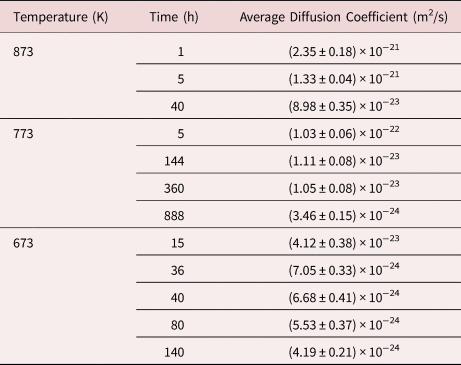
The calculated interdiffusion coefficients are plotted in Figure 9 in dependence of the annealing time. The average values of  $\bar{D}$ for the corresponding temperatures and times are listed in Table 2. As expected, the diffusivity is increased with increasing temperature.
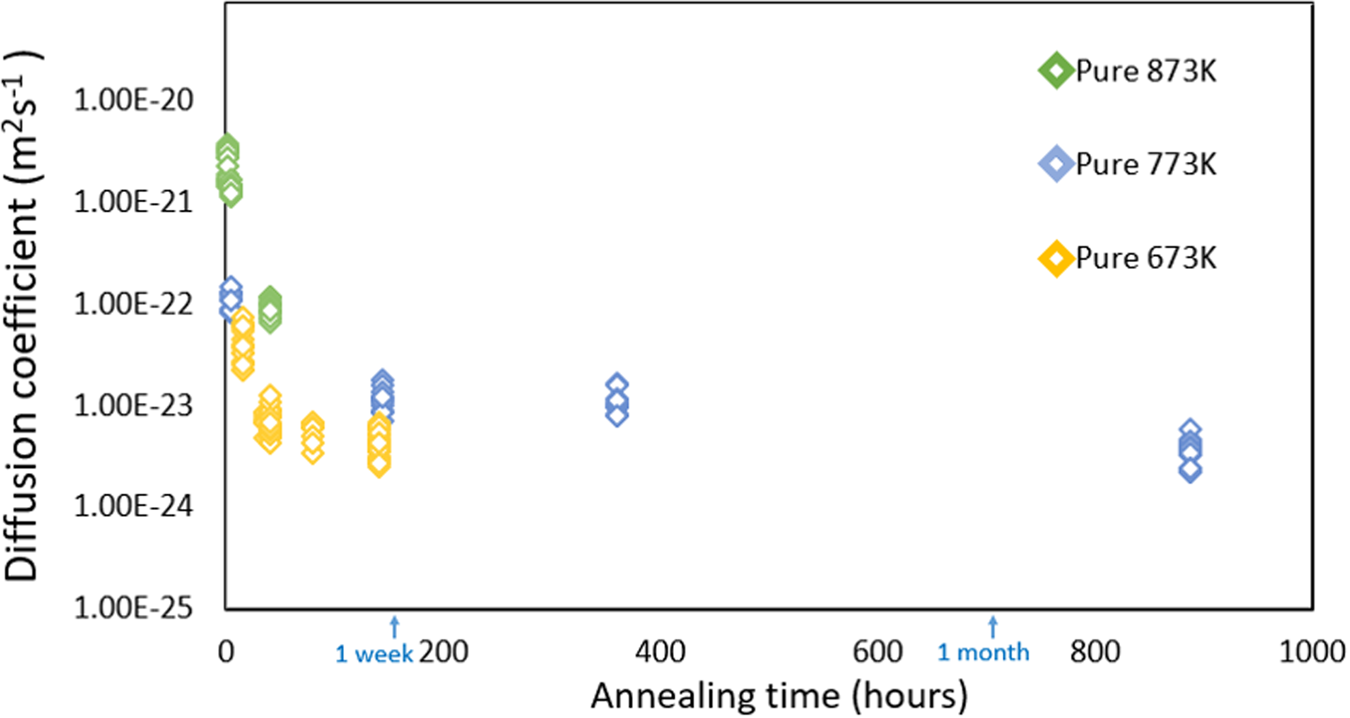
Fig. 9. Determined interdiffusion coefficients at corresponding annealing temperatures for pure multilayer samples.
Table 2. The Average Interdiffusion Coefficients Determined Using Fourier Series Analysis for the Pure Multilayer Samples Annealed at 873, 773, and 673 K.
For a respective isothermal annealing sequence, the diffusivity changes depending on the annealing time. The initial diffusivities for short annealing times, 5 h at 773 and 873 K, 15 h at 673 K, were higher as compared to the values of the longer annealed samples. But obviously the coefficients reach a steady level for a long duration which clearly points out the full solubility even at the lowest investigated temperature. The time dependence of the diffusion coefficient can be attributed to its concentration dependence, eventually complemented by an additional vacancy super-saturation stemming from the sputter process.
That far, the reaction study of the pure multilayer systems appears to indicate that the Pt–Pd binary metal system reveals full mixing properties and the existence of a miscibility gap can be denied.
Pre-Alloyed Multilayer Systems
According to the miscibility gap proposed by Raub (Reference Raub1959), the possible temperature range is below 1,043 K. If the system had a tendency of demixing, the composition oscillation would reach a stable end state. Indeed, as described above, most of the samples with a pure multilayer structure have not reached complete mixing, except for 973 K annealed samples. But even for very long annealing times for more than a month at 773 K, still a relatively small further composition change is observed with a steady diffusion coefficient. So if a miscibility gap would exist, it would have to be very narrow. It is more likely that the slow-down of the kinetics demands much longer annealing times. For final clarification, samples with pre-alloyed layer compositions within the proposed miscibility gap were investigated. If the proposed miscibility gap is valid, pre-alloyed films should separate toward the solubility lines showing that the concentration of Pt moves outwards in the phase diagram. However, such phase separation is not observed.
In the example of Figure 10, the composition change from the initial 27 at%–Pt/71 at%–Pt clearly demonstrates further mixing of the pre-alloyed multilayer system during the annealing treatment at 773 K for 576 h. Also, due to the periodic nature of the initial layer stack, Fourier series analysis were conducted to calculate the diffusion coefficients.
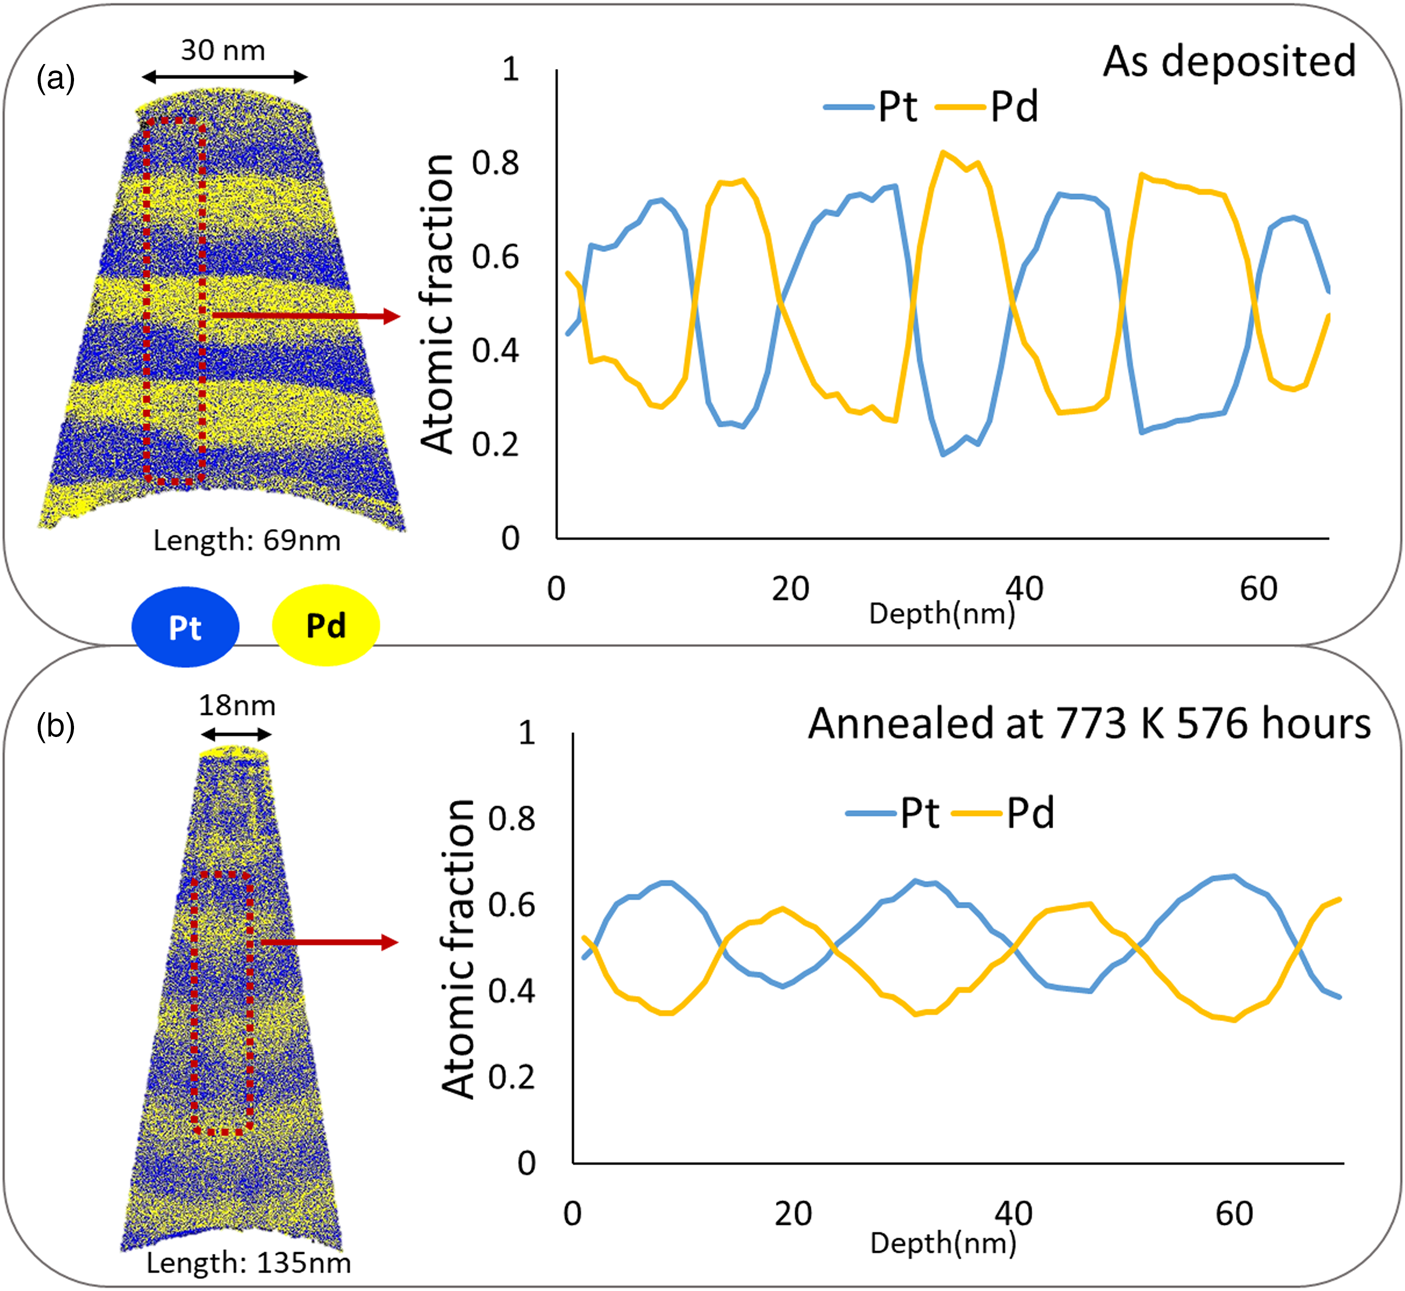
Fig. 10. Comparison of composition before and after annealing of the pre-alloyed multilayers: (a) as-deposited and (b) annealed at 773 K for 576 h.
Table 3 presents the average diffusion coefficients and standard error for the corresponding annealing temperature and time. The samples of different starting composition annealed at 773 K for 480 and 576 h, as shown in Figure 11, have similar diffusion coefficient values of (4.30 ± 0.19) × 10−24 m2/s and (6.39 ± 0.14) × 10−24 m2/s, respectively. These values are furthermore in reasonable match with the formerly presented results from the pure multilayer samples.
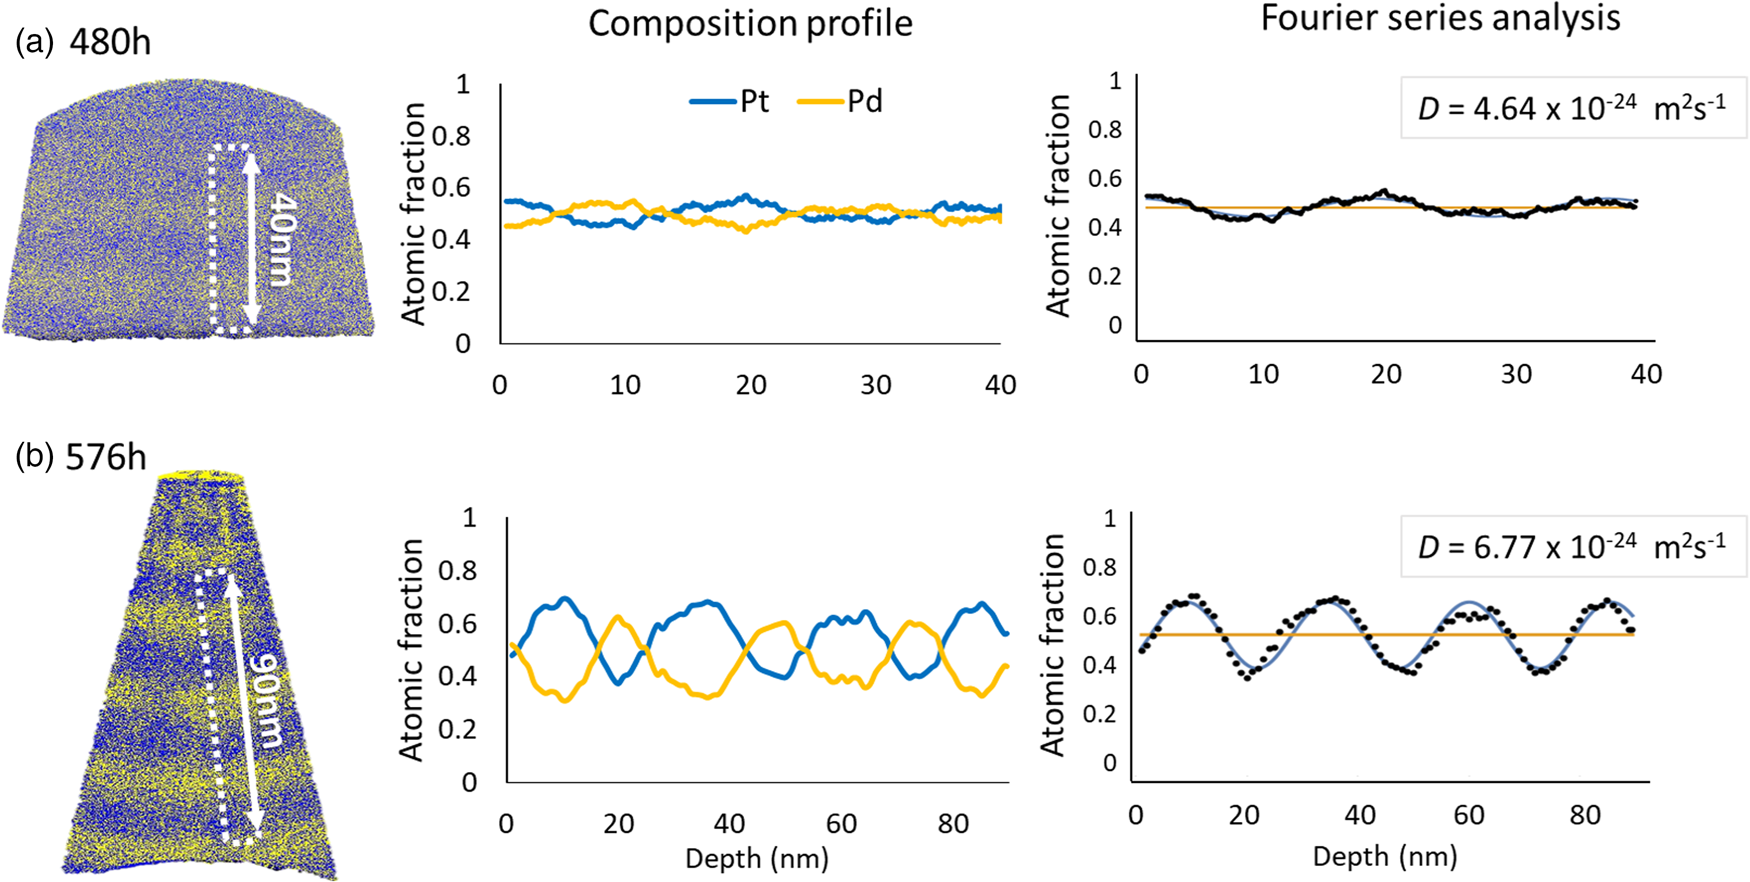
Fig. 11. The representative results of pre-alloyed multilayer samples annealed at 773 K for (a) 480 h and (b) 576 h.
Table 3. Determined Diffusion Coefficients for the Alloyed Multiple Bilayer System.
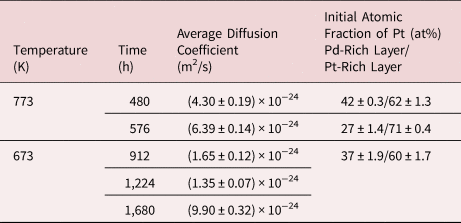
In the case of isothermal annealing sequence conducted at 673 K as shown in Figure 12, the determined diffusivities are at a stable level with (1.65 ± 0.12) × 10−24 m2/s, (1.35 ± 0.07) × 10−24 m2/s, and (9.90 ± 0.32) × 10−25 m2/s for 912, 1,224, and 1,680 h, respectively. At this temperature, the diffusion process is very slow and certainly cannot reach the equilibrium state of complete mixing even after the longest tested annealing of 1,680 h (70 days). This is even the case, although, the initial composition is close to the mean composition. By using equation (1), the required time for total mixing is calculated to 195 days.
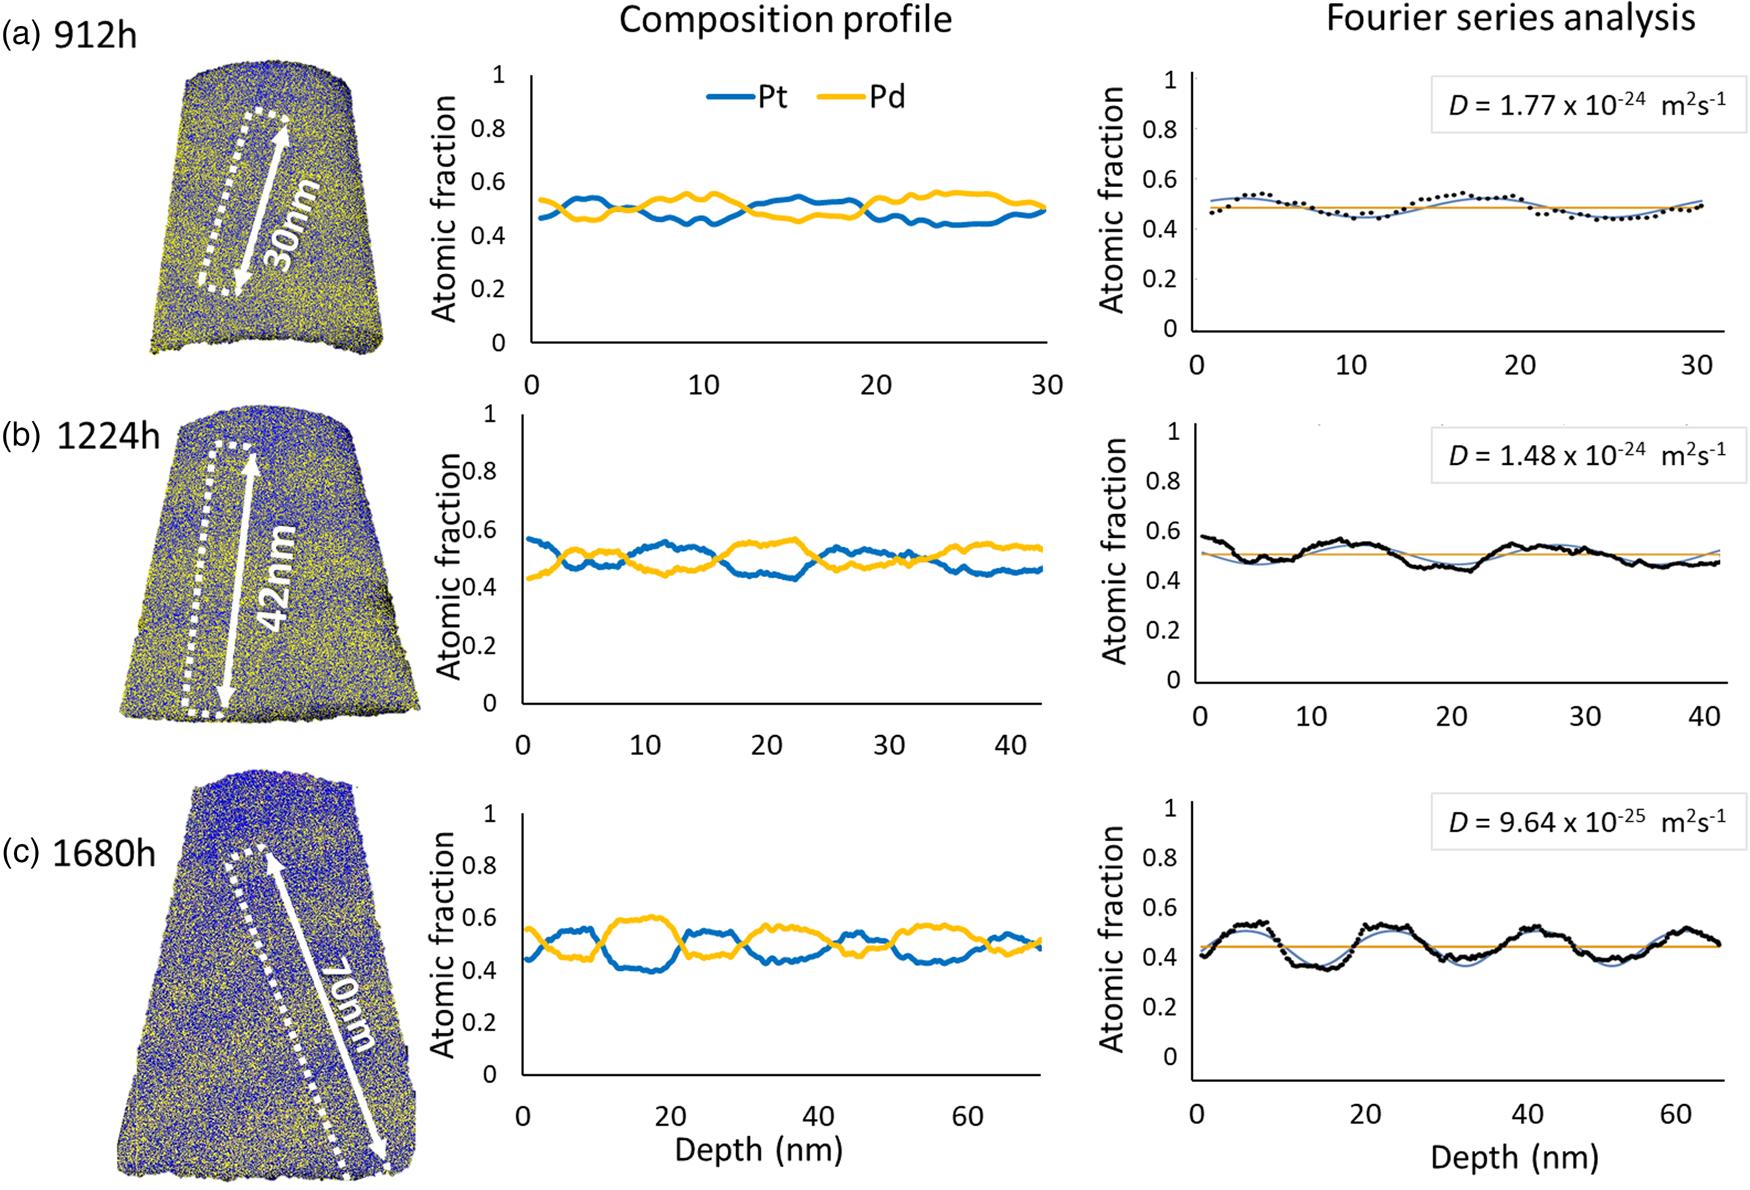
Fig. 12. The representative measurements of pre-alloyed multilayer samples (37 at%–Pt/60 at%–Pt) annealed at 673 K for (a) 912 h, (b) 1,224 h, and (c) 1,680 h.
Figure 13 summarizes all results determined by the Fourier series analysis in a plot for both multiple bilayer samples. Open data points present the samples of the pure multilayer structure and black filled ones indicate those of the pre-alloyed samples after the corresponding annealing times.
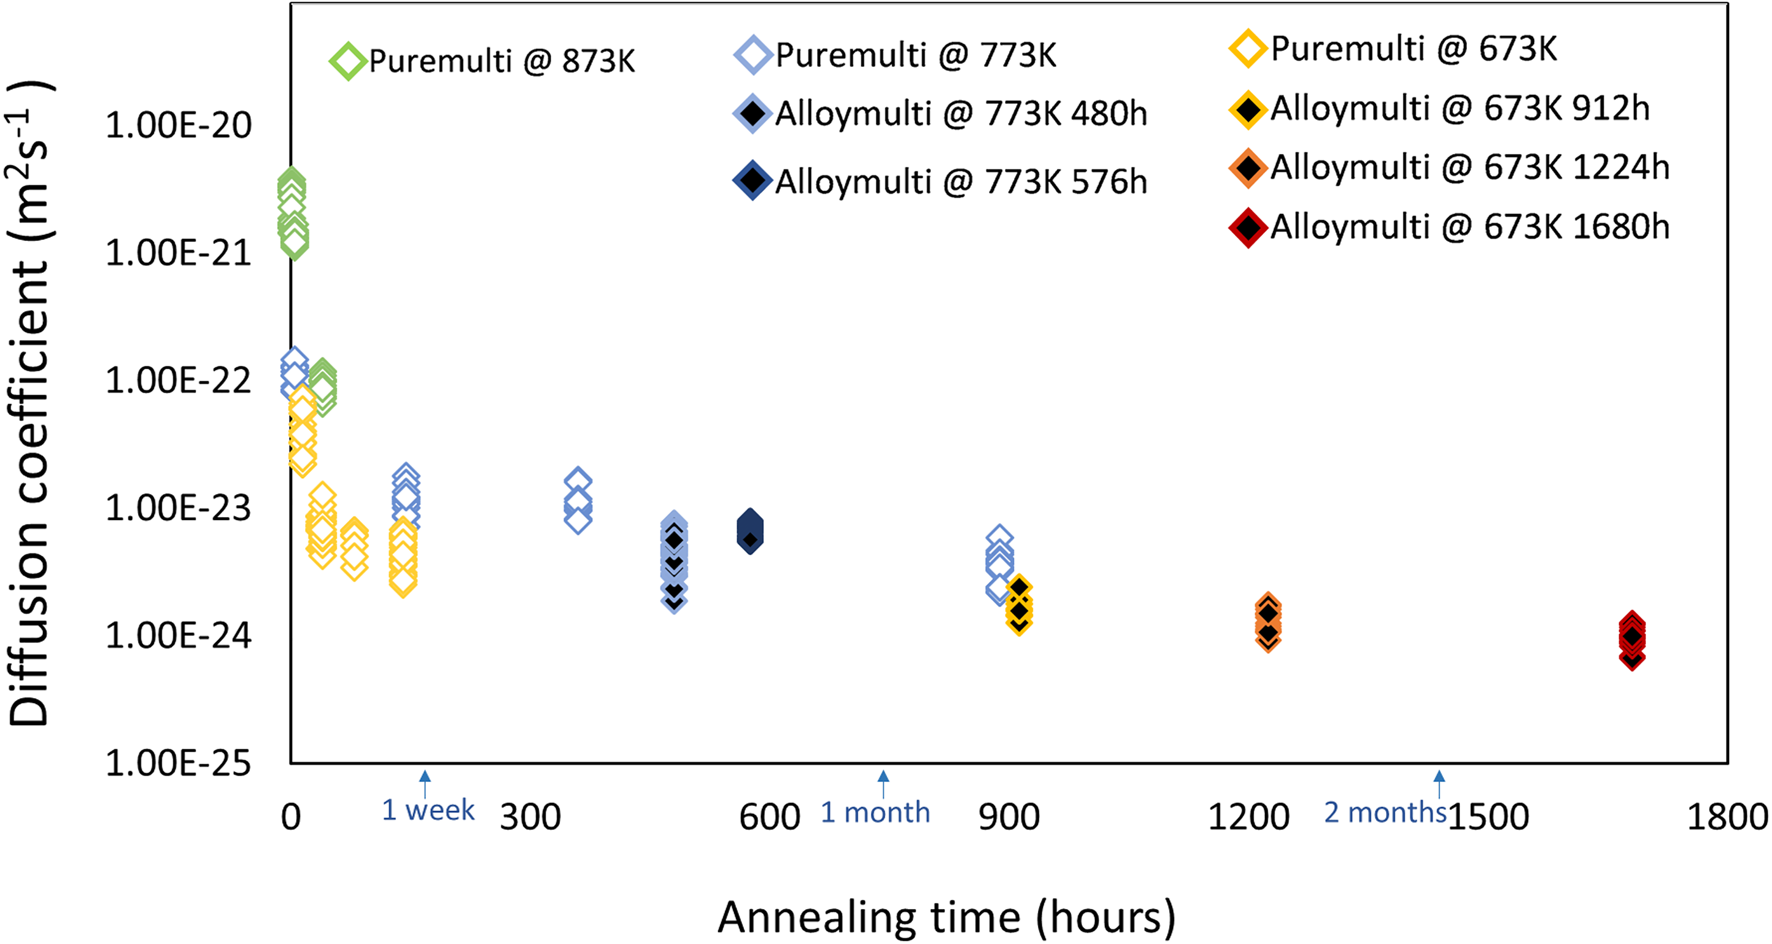
Fig. 13. Determined diffusion coefficients at corresponding annealing temperatures for pure multilayer samples (open diamond) and pre-alloyed multilayer samples (black color filled diamond).
Finally, samples of a single layer with the composition of Pt0.5Pd0.5 were generated. The samples were annealed at 773 K for 285 h and 873 K for 165 h. The results, presented in Figure 14, indicate no demixing tendencies.
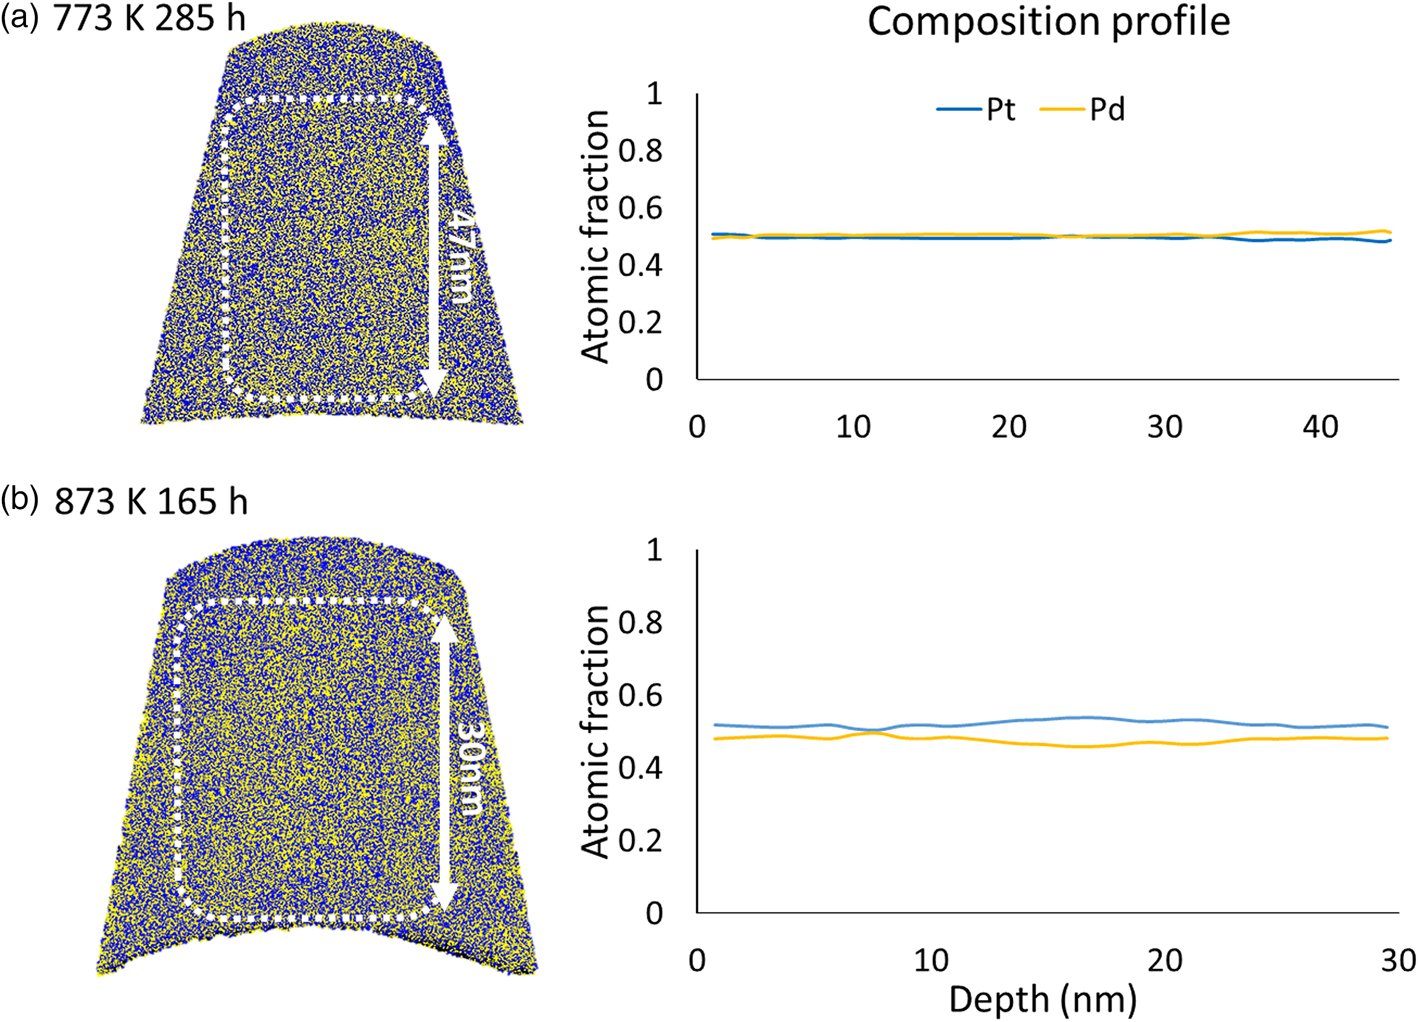
Fig. 14. Pre-alloyed single layer with 50 at% of Pt Pd annealed at (a) 773 K for 285 h and (b) 873 K for 165 h.
In the total overview on all measurements, it becomes evident that the binary metallic system PtPd does show a mixing tendency between 673 and 973 K. The obtained composition profiles reveal a purely diffusion-controlled process and no evidence of the existence of a miscibility gap or ordered phase.
Discussion
The variation of the interdiffusion coefficients with annealing times shows a common trend for measured multilayered samples, that is, the evaluated diffusion coefficient is higher in the beginning and slows down for longer annealing times, ultimately reaching a plateau value. This effect can be attributed to the implicit composition-dependence of the diffusion coefficient which cannot be captured with the Fourier series solution according to equation (1). However, the trend shown here can be compared qualitatively to the results obtained by Baheti et al. (Reference Baheti, Ravi and Paul2013) who explicitly determined the composition-dependence of the interdiffusion coefficient for PtPd diffusion couples using electron probe micro-analyzer (EPMA), annealed at elevated temperatures of 1,423–1,573 K, though. They found that the diffusivities are the highest for both pure compositions, but reach a practically steady value for intermediate compositions. Since in the beginning, our diffusion samples intrinsically offer all possible alloy compositions, we do expect a higher diffusion coefficient. However, after a certain time, only compositions within the intermediate range appear so that we should obtain a practically constant diffusion coefficient for the longer times when the influence of the early staged of diffusion become less dominant (cf. Fig. 13). The diffusion coefficient for the longest annealing time may then directly be compared to the one obtained by Bahetti et al. for a composition close to 50 at%.
The determined diffusion coefficients from this work (blue circles), which are the selected for the longest annealed samples at the corresponding temperatures, are larger than the results extrapolated from Baheti's experiment (yellow points) for 50 at%Pt, as shown in Figure 15. The deviations could be explained by two reasons. Firstly, grain boundaries might have a significant effect on the diffusion. The samples deposited via the sputtering method have nanocrystalline structure, containing plenty of grain boundaries which are the fast paths for atomic transport. Another feasible reason is that the extrapolation of the diffusivities from the high temperature (1,423–1,573 K) certainly may have limitations (e.g., the diffusion mechanism may change and/or the activation enthalpy may vary with temperature).
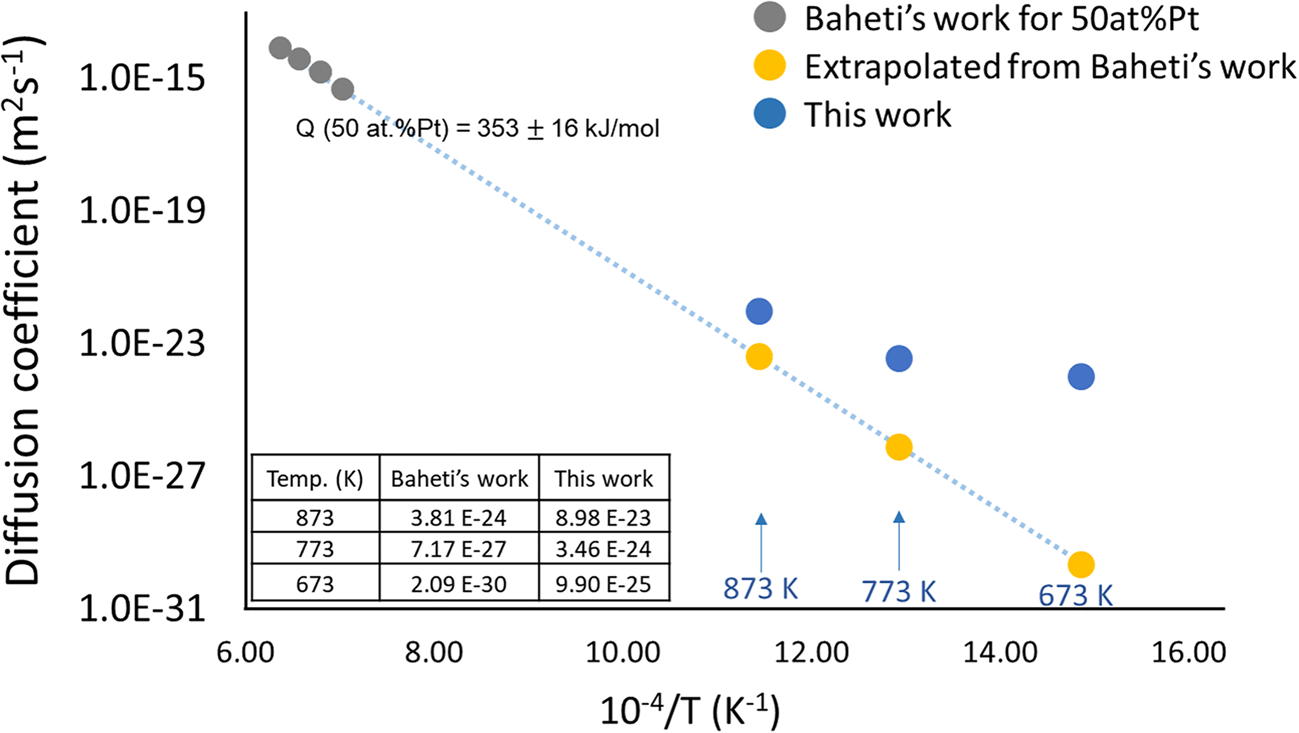
Fig. 15. Comparison of the interdiffusion coefficients from this work and the Baheti's work.
Conclusion
In the present work, the thermal reactions of nanometric Pt, Pd, and PtPd layers were studied by atom probe tomography to define the phase diagram. The absence of a discussed miscibility gap in the temperature range of 673–973 K for the Pt–Pd phase diagram has been clearly demonstrated by investigating the time-evolution of composition profiles and determining the diffusion coefficients for the nano thin film specimens.
Acknowledgments
We gratefully acknowledge the financial support of the Deutsche Forschungsgemeinschaft (DFG) project number SCHM 1182/18-1t.


 Open access